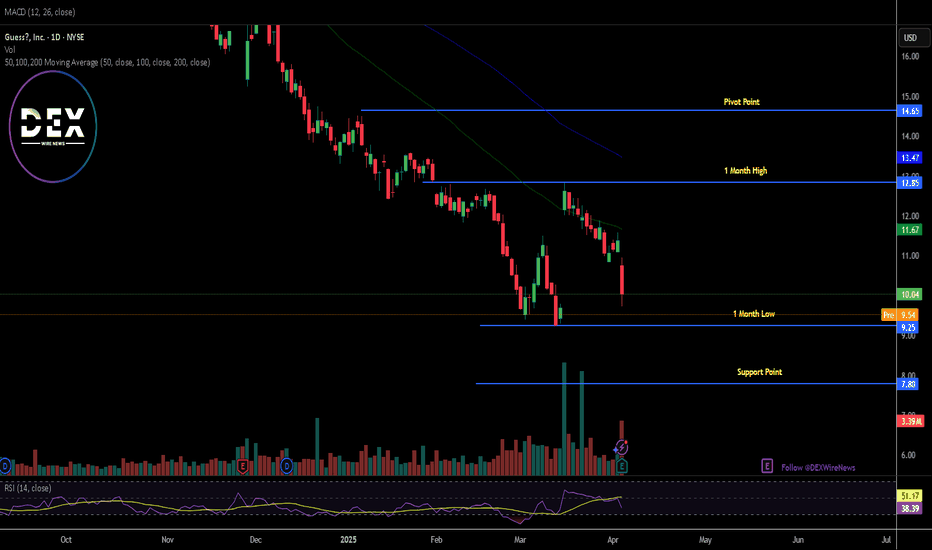
Guess?, Inc. Reports Fiscal Year 2025 Fourth Quarter ResultsGuess?, Inc. (NYSE: NYSE:GES ) a company that designs, markets, distributes, and licenses lifestyle collections of apparel and accessories for men, women, and children- operating through five segments: Americas Retail, Americas Wholesale, Europe, Asia, and Licensing, reports fiscal year 2025 fourth quarter results.
Reports Highlights
Fourth Quarter Fiscal 2025 Results:
Revenues Increased to $932 Million, Up 5% in U.S. Dollars and 9% in Constant Currency
Delivered Operating Margin of 11.1%; Adjusted Operating Margin of 11.4%
GAAP EPS of $1.16 and Adjusted EPS of $1.48.
Full Fiscal Year 2025 Results:
Revenues Increased to $3.0 Billion, Up 8% in U.S. Dollars and 10% in Constant Currency
Delivered Operating Margin of 5.8%; Adjusted Operating Margin of 6.0%
GAAP EPS of $0.77 and Adjusted EPS of $1.96
Full Fiscal Year 2026 Outlook:
Expects Revenue Increase between 3.9% and 6.2% in U.S. Dollars
Expects GAAP and Adjusted Operating Margins between 4.3% and 5.2% and 4.5% and 5.4%, Respectively
Expects GAAP EPS between $1.03 and $1.37 and Adjusted EPS between $1.32 and $1.76
Plans to Execute Business and Portfolio Optimization Expected to Unlock Approximately $30 Million in Operating Profit in Fiscal Year 2027
Financial Performance
In 2024, Guess?'s revenue was $3.00 billion, an increase of 7.88% compared to the previous year's $2.78 billion. Earnings were $60.42 million, a decrease of -69.15%.
Analyst Forecast
According to 5 analysts, the average rating for GES stock is "Strong Buy." The 12-month stock price forecast is $21.6, which is an increase of 115.14% from the latest price.
As of the time of writing, NYSE:GES shares closed Thursday's session down 11.78% extending the loss to Friday's premarket trading down by 2.38%. With a weaker RSI of 38, should trades open, NYSE:GES shares might break the 1-month low pivot and dip to the $7 support point. About $2.85 trillion was wiped out from the US stock market yesterday.
Guessforecast
'inexperience 'retail' holdr'.... Variation of my last btc chartVariation of my last btc chart, with added sub parallel channels within the potential top channel from previous charts, and new projected top number around 81500, if it doesn't continue to keep selling off from here.... just guessing tho
It is Spring, but still cold!Thank you for reading!
Greenfield
Disclosure: I am not a financial advisor. This is not a recommendation, not a representation, and not a solicitation. You should do your research and come to your own decision. Investment involves significant risks. You need to understand that you may lose your money. Past performance is not an indication of future performance. Chart reading is subjective information.
Bear Stampede to the bottom until the Christmas week. Just another pointless prediction, but I am often close to reality. Just experience, or perhaps logical thinking.
I took a beating this season. I gave back anything I made in the spring. Why, because I am human, and my bias' clouded my normal logical thinking. I too fell into that death trap. I got out months ago, and bought real estate. I negotiated very well and pretty much made back my losses in that deal. Well I guess that remains to be seen when and if I resell.
As for the markets, its still a hold. I expect to see a similar year-end pull back, mini-crash until Christmas week. Investors step in after Christmas pushing markets up until Spring.
The key point is, you should be in cash right now, or other investments, hopefully, ETF's. If you are buying and holding anything in the POT sector, all I can say is, ouch! I bet you won't do that again. Following the bear stampede over a cliff has never been a good strategy.
In my opinion investing with your bias is a sure way to lose money. Invest with the trend, the path of least resistance, and is a much much better method. Read all you can find about trend trading. I have a great reading list on www.wealthandgrowth.com to get you started.
-Randal
BTCUSD Chart with 5k and 3k as support Looking at chart taking 5k and 3k as major support level and fib fan from august 2016 low.
Well it gives either bottom or near top when fib fan and 5k/3k support crosses(not accurate someplace by 2-3 days).
Last unattended crossing gives date in September end and another crossing happens in April 2019.
9 january vertical line added as a pure guess and have no base at all.
I believe 9 january will get some news or fud.
This chart not to be considered as a Financial advise or trading advise, I made it as a learner and made few out of rule adjustments.


