golden trend line zone 1780 to 1880 time to being bull again ?gold price is making series of higher high and higher low on H1 time frame along yellow trend line zone
resistance 1850, 1877,
support 1780 at the time of writing
1753, 1721 and 1677
bearish on breakout of trend line
sell on retest of trend line or side way correction
support 1753, 1721, 1677
bullish as long as price is trading above yellow trend line zone
@anshitjainrotract2k17 thanks for your feedback
H1


XAUUSD ShortAccording to m y analysis the H1 is on a key level of resistance which I strongly believe will hold thus creating room for bears to run their business before the bulls take over the rally.

long Atomusdt in demand zonebuy atomusdt in demand zone
breakout in daily time frame
entry position in 1h timeframe demand zone


PARALLEL CHANNELThe price has been in a beautiful bearish Parallel channel since September 17, 2021. The price also responds really well to the midline of the channel.
The price is down until it breaks the price of this channel from above.

#xauusd(gold) technical analysis H1 H4its break the downtrendline and now its on pullback so we look for a good candlestick pattern in area for a uptrend...
thanks for your watch&vote


GBPAUD H1 SMCIntraday idea.
overall on the Daily we are on the bearish flow, I dont think its gonna rocket up (if there are no news) so overall bearish.
I guess we will have a reaction from that IMB to the downside or we have to wait untill price reaches imb or OB and look for change in MS.

XAUUSD (H1) Buy now
Gold dropped suddenly without any unusual news
The resistance area 1786.294-1788.097 is showing positive signals, RSI is below 30
The ability to form a Pull Back is very high
Ignore the abnormal wave from 21 to 22 o'clock on October 22,
the wave bottom area should be noted at 1776,376
Buy current price 1786-1788.1
Stop Loss: 1776,376
Take Profit 1: 1792,476
Take profit 2: 1799,045
Take Profit 3: 1806,645


xauusd long position xauusd
make a long trade when you see the ichimoku cross on h1 timeframe
target:1808
sl:1790

GBPCHF H1 MARKET STRUCTUREGBPCHF H1 MARKET STRUCTURE
Market Structure Alignment
GBPCHF
M
W
D
H4
H1 = BEARISH RANGE
M15
M5
M1
b = Bullish
bg = Bullish Range
br = Bearish
brg = Bearish Range

Ger30 Short (H1)Nice swing into supply, nice volatility, expecting a move down to demand zone, let's see how it plays out.
TRADING IDEA --- NOT AN INVESTMENT OPPORTUNITY

ETH - Buy in 2 partsBuy ETH in 2 parts
Buy 1 - $1826 (1/3 order size)
Buy 2 - $1726 (2/3 order size)
Stop loss: 1666

Short on GBPUSD (H1)Bit of a late entry, preferably earlier, not worth entering now I think. Nice impulse move to the upside, with a shark fin formation, should get a nice bounce from it hopefully! Check out my other idea on EURNZD currently playing out!


NAS100 SHORT H1BREAK & RETESTPRICE IS SHOWING SIGNS OF SHORT REVERSAL TO POSSIBLE TOUCH THE TREND LINE TO THE UPSIDE.
WE NEED TO SEE PRICE BREAK STRUCTURE. CANDLE STICK CONFIRMATONS ARE BEARISH SPINNING TOPS ON H1 AND THE 15M

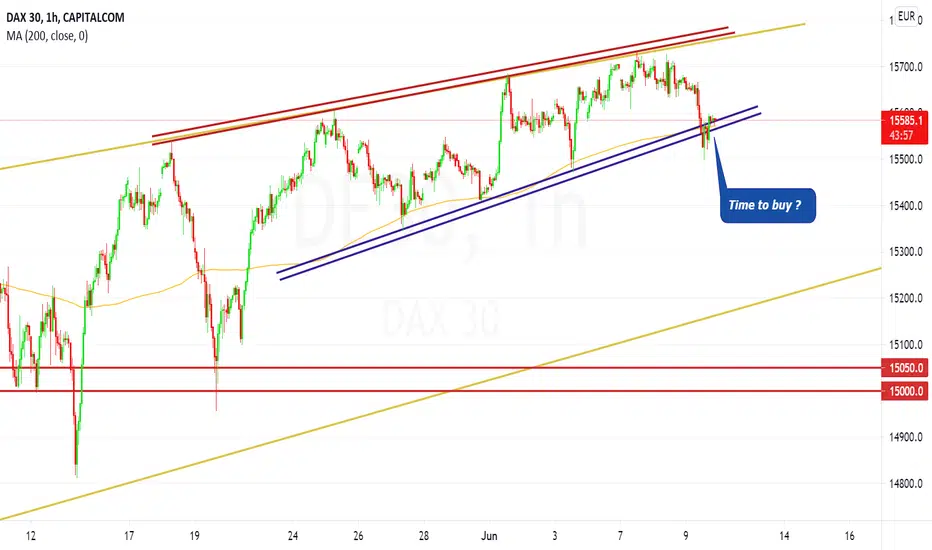
Time to buy the DAX ?This one rejected our support at 15000 forming something similar to an inverse head and shoulder and a double bottom so this one is overall bullish.
The price is now retesting the MA200 on H1 and the support.
Is it time to buy ? YOUR DECISION !