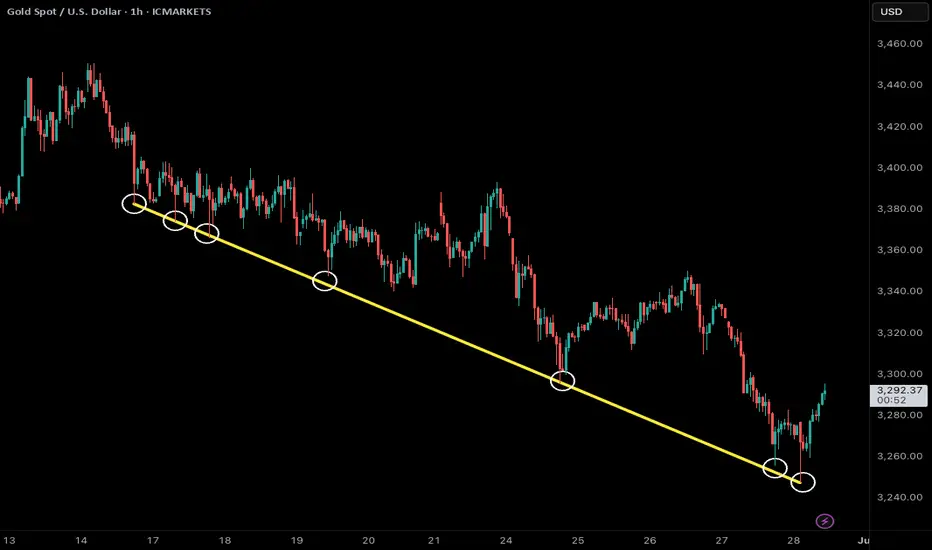
golden trend linegold price peaked on intraday h1 chart on 3450 level despite shocking war news
opposite to crowd consensus price came down last two week until crowd give up buying war news
but price was falling like text book from trend line
test bounce then new lower low
(price now testing h4 support 3245)
H1chart
XAU/USD - H1 Time Frame Trade Plan 23-04-2024⚙️ Gold (XAU/USD) – H1 Time Frame Trade Plan
🧭 Current Market Bias (H1)
Check if price is above or below 50 EMA and 200 EMA
Above both = bullish bias
Below both = bearish bias
Between = range / indecision
✅ Bullish Trade Setup (Buy the Dip)
Entry Zone: $2,340 – $2,350 (recent demand zone)
Entry Signal: Bullish engulfing / hammer / RSI bounce from 40
Stop Loss: $2,325 (below recent swing low)
Take Profit 1: $2,370
Take Profit 2: $2,390
Risk:Reward: At least 1:2
❌ Bearish Trade Setup (Sell the Rally)
Entry Zone: $2,390 – $2,400 (strong resistance)
Entry Signal: Bearish engulfing / shooting star / RSI rejection from 70
Stop Loss: $2,415 (above previous swing high)
Take Profit 1: $2,360
Take Profit 2: $2,340
📌 Extra Tips
Use MACD crossovers or RSI divergence for confirmation.
Avoid entering during high-impact news (e.g., FOMC, CPI, NFP).
Consider partial closes and trailing stops if price action moves in your favor.

parallel channel on weak dollar gbpusd is going up
making higher high with higher low inside a yellow parallel channel
1.34297 first big resistance
lower yellow line first big support

USD/JPY- Correction Phase with Potential TargetsThe main trend for USD/JPY is down, but the price is currently in a correction. We expect the secondary trend to continue. In the H1 timeframe, the wave structure suggests a higher high is likely.
Target areas:
T1: 141.64
T2: 142.28
H4 Target: 143.04
Stop Loss: 140.30

simple trend linegold price are trading near all time high below white trend line
after fed said time has come for rate cut
price is testing is trendline 4th time before big gdp, pce, job claims news


golden support levelgold price is up since UR is ticking up in usa now 4.1% and ISM service PMI going down now 48
which says us economy heading towards recession and geopolitical risks
one of the many reason intraday gold h1 chart is up
yellow horizontal lines are big intraday horizontal support level in gold
since bringing of the week price came down before it even tested $2400 psychological level
on news of china central bank stopped buying gold
up trend as long as price trend above yellow lines
if price close below both yellow line then intraday down trend

ICT Long setup in a Hong Kong stock : 941👋Hello Traders,
Our 🖥️ AI system detected that there is an H1 or higher timeframe ICT Long setup in HK stock : 941 for Swing trade.
Please refer to the details Stop loss, FVG(Buy Zone),open for take profit.
For more ideas, you are welcome to visit our profile in tradingview.
Have a good day!
Please give this post a like if you like this kind of simple idea, your feedback will bring our signal to next better level, thanks for support!

Long setup H4 uptrend swing trade👋Hello Traders,
Our 🖥️ AI system detected that there is an ICT Long setup in USDCAD for scalping.
Please refer to the details Stop loss, FVG(Buy Zone),open for take profit.
For more ideas, you are welcome to visit our profile in tradingview.
Have a good day!
Please give this post a like if you like this kind of simple idea, your feedback will bring our signal to next better level, thanks for support!

rising wedge pattern bitcoin and gold were flying and now silver also flying
price is overbought and it has made rising wedge chart patten

🌟📈 Exciting Trading Insights for HK50! 💼💹Get ready for some thrilling opportunities as we dive into the market dynamics of HK50! Let's explore the charts, analyze the trends, and uncover potential pathways for profitable trades. 🚀💰
📈 Higher Timeframe Trend:
Zooming out to the higher timeframes (H4 or above), we observe a clear trend in HK50. This sets the stage for exciting possibilities and potential gains. Let's ride the trend! 📈📊
🔍🔄 Double Bottom Formation:
In the H1 chart, we anticipate HK50 to form a double bottom pattern, as indicated. This pattern suggests a potential trend reversal and can provide excellent entry opportunities. Keep a close watch! 👀🔄
⚡️💼 Supply Zone at 16330:
Our analysis reveals a small but significant Supply Zone at 16330. Today's breakdown of this level serves as a Launchpad for potential upward movement. Brace yourself for a bullish breakthrough! 🚀💼
🔮📉📈 Forecast Path:
Let's map out the potential path for HK50's future movements:
1️⃣ Hit Supply Zone 16330:
The first step is for HK50 to reach the Supply Zone at 16330. This level acts as a crucial milestone to watch out for. Prepare for potential price reactions and exciting trading opportunities! 🎯📉
2️⃣ Retest and Lower Low Formation:
Following the initial hit, we anticipate a retest above 16150, accompanied by the formation of a lower low. This scenario may exhibit indicators such as MACD divergence, providing insightful signals for traders. Stay sharp! 🔄📉
3️⃣ Fast Move to 16480:
Our forecast suggests a rapid upward move to 16480, potentially occurring on Friday afternoon or next Monday. This surge presents an excellent chance to capitalize on favorable market conditions. Get ready for action! ⚡️📈💪
Embrace the excitement, stay informed, and adapt to the evolving market conditions. Remember, thorough analysis and risk management are key to successful trading. Let's make the most of HK50's potential and aim for profitable trades! 💪💼💹
#HK50 #TradingInsights #DoubleBottomFormation #SupplyZone #ForecastPath 🌍💱

simple price action - parallel channelprice is making up trend inside a parallel channel on h1 chart
price testing upper and lower trend line as dynamic support and resistance
(intraday bullish until channel breakout)

fed head and shoulder chart pattern last time fed give hawkish speech but still gold spiked to 2150
now back again below 2050
nfp news tomorrow will decide rate cut speculation in march is right or wrong
march rate cut will decide gold will go back to 2150 or 1900

CAD JPY H4 SELL The price is higher in the hourly resistance range, a trend reversal or at least a correction is expected

AUD USD H1 BUYIt's currently correcting and it may not correct in the main uptrend and go sharp but I'm entering here.

Analysis is against the trend and risky {buy NZD USD H1}Analysis is against the trend and risk ..........................................

Bearish Cypher H1Open - 1.30288
TP1 - 1.30202
TP2 - 1.29314
TP3 - 1.28949
SL - 1.30639
Please note that my setups are not signals to trade but my own personal analysis and predicted direction. To enter a trade it must be validated by multiple different indicators and confluence factors.

