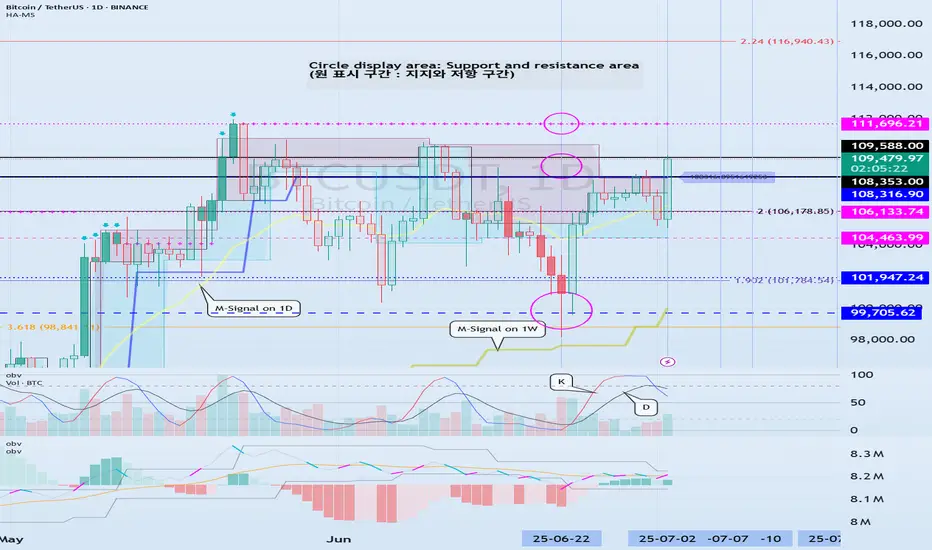
Check support at 108316.90-111696.21
Hello, traders.
If you "Follow", you can always get new information quickly.
Have a nice day today.
-------------------------------------
(BTCUSDT 1D chart)
Among the many trend lines, the one marked 1W is the important one.
Therefore, we need to look at whether it can rise above the 1W trend line or rise along the trend line.
If not, and it falls below 108316.90, it may lead to further decline, so we need to think about a countermeasure for this.
This volatility period is expected to continue until July 3, but it is expected to last until July 11, so caution is required when trading.
-
Indicators that indicate high points are DOM(60), HA-High, and StochRSI 80.
HA-High and StochRSI 80 are formed around 108316.90, and DOM(60) is formed at 111696.21.
Therefore, the 108316.90-111696.21 section is a high point boundary section, and if it is supported and rises in this section, it is highly likely that a stepwise uptrend will begin.
The conditions for a stepwise uptrend to begin are:
- The K of the StochRSI indicator must show an upward trend below 80,
- The PVT-MACD oscillator indicator must show an upward trend above the 0 point,
- The OBV of the Low Line ~ High Line channel must show an upward trend. If possible, it is better for the Low Line ~ High Line channel to form an upward channel.
When the above conditions are met, I think that if it is supported and rises in the 108316.90-111696.21 section, it is highly likely that a stepwise uptrend will continue.
If the above conditions are not met, it is likely that it will show a downward trend again while pretending to rise.
-
Thank you for reading to the end.
I wish you successful trading.
--------------------------------------------------
- This is an explanation of the big picture.
(3-year bull market, 1-year bear market pattern)
I will explain more details when the bear market starts.
------------------------------------------------------
HA
Check if price can hold above M-Signal indicator on 1D chart
Hello, traders.
If you "Follow", you can always get new information quickly.
Have a nice day today.
-------------------------------------
I failed to register a modified indicator of StochRSI indicator on TradingView alone, so I added it to the existing OBV by readCrypto indicator.
From the top of the indicator setting window to the bottom
1. OBV indicator of Low Line ~ High Line channel
2. PVT-MACD oscillator indicator
3. StochRSI indicator
They are registered in the order above.
Since the values used are all different, you should activate and use one indicator.
Please check the chart above.
------------------------------------------
(BTCUSDT 1D chart)
It is showing a downward trend as it failed to rise above the HA-High indicator (108316.90) on the 1D chart.
It is currently checking whether there is support near 107340.58, which is the StochRSI 50 indicator point.
If it fails to receive support and falls, it is expected to fall to around 104463.99.
The 104463.99 point is the DOM (60) indicator point of the 1W chart, which corresponds to the end of the high point on the 1W chart.
Since the StochRSI 20 indicator point is formed near the 104463.99 point, its importance can be considered high.
-
Since the M-Signal indicator of the 1D chart is passing near 106133.74, there is a possibility of volatility when touching this area.
Since the volatility period begins around July 2 (July 1-3), it is necessary to keep an eye on the current movement.
-
However, the key is to buy near the HA-Low indicator and sell near the HA-High indicator, so the current movement may be natural.
This volatility period is expected to last until around July 10 (July 9-11), so be careful when trading to avoid being fooled by fakes.
----------------------------------------
- The StochRSI indicator is showing signs of transitioning to a state where K < D.
- The PVT-MACD oscillator indicator is showing signs of decline.
- The OBV indicator of the Low Line ~ High Line channel is showing signs of decline in the High Line.
Therefore, if you look at the indicators, they are showing signs of decline overall.
However, if the OBV rises above the High Line, the price will show signs of rise.
Therefore, we need to observe the movements of the indicators while checking whether there is support at the StochRSI 50 indicator point.
Basically, the time to make a purchase is when it shows support near the DOM (-60) ~ HA-Low indicator.
If you want to make a purchase outside of that, you should not forget that a short and quick response is required.
The indicators that tell you the high point are HA-High, DOM(60) indicators.
In addition, there are StochRSI 80 and StochRSI 20 indicators that require quick response.
-
Thank you for reading to the end.
I wish you successful trading.
--------------------------------------------------
- Here is an explanation of the big picture.
(3-year bull market, 1-year bear market pattern)
I will explain the details again when the bear market starts.
------------------------------------------------------

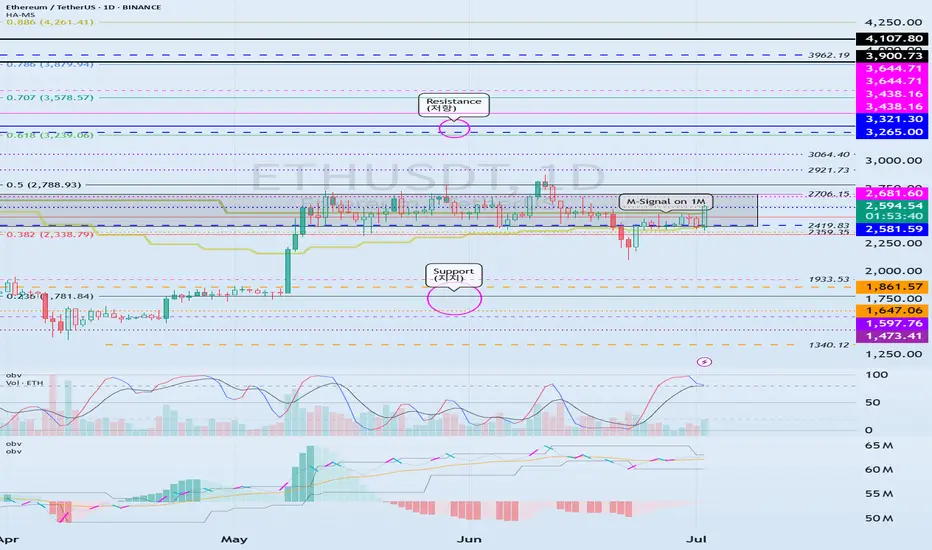
Important Support and Resistance Areas: 2419.83-2706.15
Hello, traders.
Please "Follow" to get the latest information quickly.
Have a nice day today.
-------------------------------------
(ETHUSDT 1D chart)
The key is whether ETH can find support in the 2419.83-2706.15 area and rise.
This is because this section is the section that needs to be supported in order for a full-fledged uptrend to begin.
Therefore, if you are trading ETH, you can proceed with a purchase when support is confirmed in the 2419.83-2706.15 section.
-
Thank you for reading to the end.
I hope you have a successful transaction.
--------------------------------------------------
- Here is an explanation of the big picture.
(3-year bull market, 1-year bear market pattern)
I will explain the details again when the bear market starts.
------------------------------------------------------
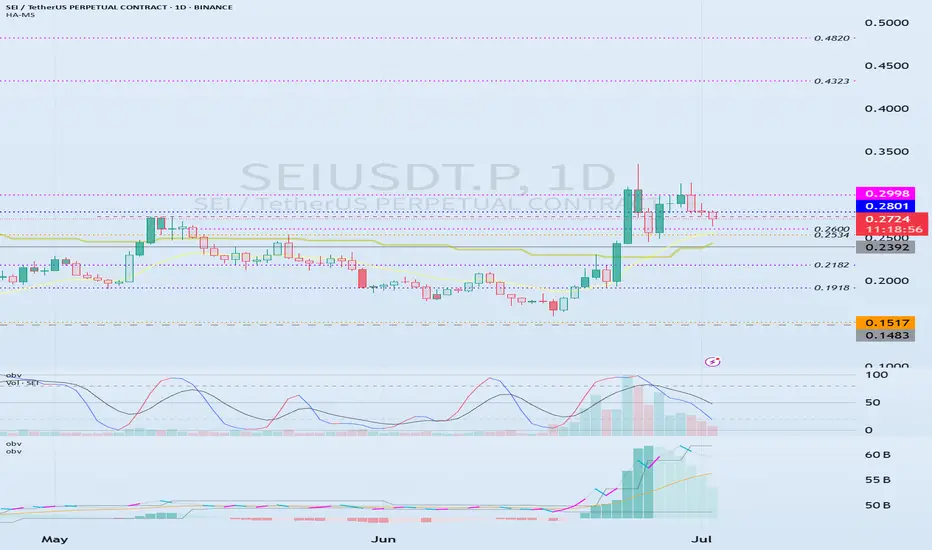
Important volume profile area: 0.2392
Hello, traders.
If you "follow", you can always get the latest information quickly.
Have a nice day today.
-------------------------------------
(SEIUSDT.P 1M chart)
I wonder what the 1M chart means on the futures chart, but if you know the current big picture trend, I think you can trade according to your main and secondary positions.
Currently, the volume profile section is formed at 0.2392 on the 1M chart, so it is expected that the major trend will be determined based on this point.
In other words, if the price is maintained above 0.2392, I think it is highly likely to turn into an uptrend.
-
(1W chart)
Currently, on the 1W chart, we are checking for support near the 0.2750 point, which is the StochRSI 80 indicator point.
The StochRSI 80 indicator is one of the indicators that indicates the high point section.
Therefore, if it is supported near the StochRSI 80 indicator, it is highly likely to rise.
On the other hand, if it is not supported, it is important to check for support because it corresponds to the resistance point.
Once the rise begins, it is basically likely to rise until it meets the HA-High indicator.
The HA-High indicator is currently formed at 0.7406.
However, when rising, there is a possibility of receiving resistance near the area where the arrow is pointing, so you should think about a countermeasure.
-
(1D chart)
In order to rise, the price must rise above the 0.2801-0.2998 range and maintain it.
If not, there is a possibility of falling until the HA-Low indicator is met.
However, since an important volume profile range is formed at the 0.2392 range, whether there is support near this area is an important issue.
Therefore, if it falls below 0.2392, it is recommended to stop trading and check the situation if possible.
If it rises above 0.2998, it seems likely to surge to the 0.4323-0.4820 range because the resistance range is weak.
-
Thank you for reading to the end.
I hope you have a successful trade.
--------------------------------------------------
- Here is an explanation of the big picture.
(3-year bull market, 1-year bear market pattern)
I will explain more details when the bear market starts.
------------------------------------------------------
Analyzing the new month, new week, new day
Hello, traders.
If you "follow", you can always get the latest information quickly.
Have a nice day today.
-------------------------------------
(BTCUSDT 1M chart)
A new month begins in one day.
The key is whether it can hold the price by rising above 109588.0.
If not, there is a possibility that it will fall below the 94172.00 StochRSI 50 indicator point that the arrow is pointing to.
We need to see if it can rise with support near the Fibonacci ratio of 1.618 (89050.0).
Since the current low-point trend line is not complete, it is not surprising that it can show a downward trend at any time.
However, if it rises above 109588.0 and maintains the price, it is expected that there will be an attempt to rise near the Fibonacci ratio of 2.618 (133889.92).
I think it is likely to be the last target of the target bull market in 2025.
-
(1W chart)
It is a period of volatility around the week including June 23.
That is, from June 16 to July 6 is the volatility period.
The key is whether it can rise to the right Fibonacci ratio 2.24 (116940.43) during this volatility period.
Even if it fails to rise, if the price maintains above 104463.99, it is expected to show an upward trend around the next volatility period.
The next volatility period on the 1W chart is expected to be around the week of August 18.
-
When it falls below 104463.99, we need to check whether the HA-High indicator is newly generated.
If not, it is important to check whether there is support around the current HA-High indicator point of 99705.62.
Since the M-Signal indicator on the 1W chart is passing around 99705.62, its importance can be said to be high.
If it falls below the M-Signal indicator of the 1W chart, it is expected to determine the trend again when it meets the M-Signal indicator of the 1M chart.
-
(1D chart)
The key is whether it can maintain the price by rising above the HA-High indicator point of 108316.90 on the 1D chart.
If it fails to rise,
1st: 104463.99
2nd: 99705.62
You should check for support near the 1st and 2nd above.
If it falls below the M-Signal indicator of the 1W chart,
1st: 89294.25
2nd: M-Signal of the 1M chart
There is a possibility that it will fall near the 1st and 2nd above.
-----------------------------------------
(1W chart)
The chart above is a trend line chart drawn on the 1W chart.
It looks complicated, but what's important to look at is the correlation between the high-point trend line and the low-point trend line.
That is, even if the price rises above 109.588.0, if it doesn't rise above the high-point trend line, it is likely to fall near the low-point trend line.
Fortunately, since it is forming an upward channel, it is expected that the price will eventually rise even if it falls.
-
(1D chart)
Unlike the trend line on the 1W chart, the high-point trend line on the 1D chart forms a downward trend line.
Accordingly, the period around July 7, when the low-point trend line and the high-point trend line intersect, can be considered an important period of volatility.
However, the volatility period starts around July 2nd and is expected to end around July 10th.
----------------------------------------------
As shown above, many lines were drawn to analyze the chart.
I have roughly explained which of the lines drawn in this way should be prioritized.
Since chart analysis is for creating a trading strategy, the support and resistance points drawn on the 1M, 1W, and 1D charts are ultimately the most important.
Therefore, it is most important to check how the support and resistance points were created and find the reason for them.
Other analyses are only additional elements.
As I always say, chart analysis that does not show support and resistance points is only an analysis chart that can be used for trading.
You cannot trade with such analysis charts.
Also, if support and resistance points are shown, you should check the basis for setting the support and resistance points.
In order to serve as a support and resistance point, there must be a basis.
When you cannot confirm the basis for the support and resistance point, it is important to ask questions and find out the basis.
Fibonacci ratios are not suitable for actual trading.
However, when the ATH or ATL is updated, it is valuable enough for analysis.
Other than that, there must be support and resistance points drawn on the 1M, 1W, and 1D charts.
-
Thank you for reading to the end.
I hope you have a successful trade.
--------------------------------------------------
- This is an explanation of the big picture.
(3-year bull market, 1-year bear market pattern)
I will explain more details when the bear market starts.
------------------------------------------------------

Example of how to draw a trend line using the StochRSI indicator
Hello, traders.
If you "Follow", you can always get new information quickly.
Have a nice day today.
-------------------------------------
We use the StochRSI indicator to draw a trend line.
We draw a trend line by connecting the peaks of the StochRSI indicator, i.e. the K line, when they are created in the overbought area or when they are created in the overbought area.
That is, when the K line of the StochRSI indicator forms a peak in the overbought area, the trend line is drawn by connecting the Open values of the falling candles.
If the candle corresponding to the peak of the StochRSI indicator is a rising candle, move to the right and use the Open value of the first falling candle.
When drawing the first trend line, draw it from the latest candle.
Since the third trend line indicates a new trend, do not draw anything after the third trend line.
The currently drawn trend line corresponds to the high-point trend line.
-
Therefore, you should also draw the low-point trend line.
The low-point trend line is drawn by connecting the K line of the StochRSI indicator when the top is formed in the oversold zone.
The low-point trend line uses the low value of the candle when the K line of the StochRSI indicator forms the top in the oversold zone.
That is, it doesn't matter whether the candle is a bearish candle or a bullish candle.
The drawing method is the same as when drawing the high-point trend line, drawing from the latest candle.
The top of the best K line of the StochRSI indicator was not formed within the oversold zone.
(The top is indicated by the section marked with a circle.)
Since the trend line was not formed, the principle is not to draw it.
If you want to draw it and see it, it is better to display it differently from the existing trend line so that it is intuitively different from the existing trend line.
-
The chart below is a chart that displays the trend line drawn separately above as a whole.
It is also good to distinguish which trend line it is by changing the color of the high-point trend line and the low-point trend line.
The chart below is a chart that distinguishes the high-point trend line in blue (#5b9cf6) and the low-point trend line in light green (#00ff00).
The low-point trend line is a line drawn when the trend has changed, so it does not have much meaning, but it still provides good information for calculating the volatility period.
-
To calculate the volatility period, support and resistance points drawn on the 1M, 1W, and 1D charts are required.
However, since I am currently explaining how to draw a trend line, it is only drawn on the 1M chart.
-
I use the indicators used in my chart to indicate support and resistance points.
That is, I use the DOM(60), DOM(-60), HA-Low, HA-High, and OBV indicators to indicate support and resistance points.
Since the DOM(-60) and HA-Low indicators are not displayed on the 1M chart, I have shown the 1W chart as an example.
The indicators displayed up to the current candle correspond to the main support and resistance points.
Although it is not displayed up to the current candle, the point where the horizontal line is long is drawn as the sub-support and resistance point.
It is recommended to mark them separately to distinguish the main support and resistance point and the sub-support and resistance point.
The trend line drawn in this way and the support and resistance points are correlated on the 1D chart and the volatility period is calculated.
(For example, it was drawn on the 1M chart.)
The sections marked as circles are the points that serve as the basis for calculating the volatility period.
That is,
- The point where multiple trend lines intersect
- The point where the trend line and the support and resistance points intersect
Select the point that satisfies the above cases at the same time to display the volatility period.
When the point of calculating the volatility period is ambiguous, move to the left and select the first candle.
This is because it is meaningless to display it after the volatility period has passed.
If possible, the more points that are satisfied at the same time, the stronger the volatility period.
If the K-line peak of the StochRSI indicator is formed outside the overbought or oversold zone, it is better to exclude it when calculating the volatility period.
-
The chart below is a chart drawn on a 1D chart by summarizing the above contents.
The reason why there are so many lines is because of this reason.
For those who are not familiar with my charts, I have been simplifying the charts as much as possible these days.
However, when explaining, I have shown all the indicators to help you understand the explanation.
-
Thank you for reading to the end.
I hope you have a successful trade.
--------------------------------------------------

StochRSI indicator and support and resistance levels
Hello, traders.
If you "follow" me, you can always get the latest information quickly.
Have a nice day today.
-------------------------------------
The StochRSI indicator on the left chart is slightly different from the StochRSI indicator on the right.
The StochRSI indicator on the left chart is the StochRSI indicator provided by default in TradingView, and the StochRSI indicator on the right chart is an indicator with a modified formula.
The StochRSI indicator is a leading indicator that is reflected almost in real time.
Therefore, it reacts sensitively to price changes.
Although it is advantageous because it reacts sensitively, it also increases the possibility of being caught in a fake, so I thought that a slight delay(?) was necessary, and so I created the StochRSI indicator on the left chart.
If you look at the relationship between the K and D of the StochRSI indicators on the two charts, you can see that there is a big difference.
In the end, you can predict the movement by checking whether the movement of the K line has escaped the overbought or oversold section.
However, I think that you will receive information that can determine the sustainability of the trend depending on the positional relationship between K and D.
Therefore, it is important to distinguish the inflection points that occur in the StochRSI indicator.
This is because these inflection points provide important information for drawing trend lines.
Therefore, the StochRSI indicator on the left chart, which better expresses the inflection point, is being used to draw the trend line.
(Unfortunately, this indicator was not registered on TradingView because I did not explain it well.)
-
As a new candle was created, the StochRSI indicator on the left chart is showing an inflection point on the K line.
The StochRSI indicator on the right chart is showing a transition to a state where K < D.
We will have to check whether the inflection point was created only when today's candle closes, but I think that the fact that it is showing this pattern means that there is a high possibility of a change in the future trend.
Since the next volatility period is expected to start around July 2nd (July 1st-3rd), I think it has started to show meaningful movements.
-
It is true that you want to buy at the lowest price possible and sell at the highest price.
However, because of this greed, one mistake can lead to a loss that can overturn nine victories, so you should always be careful.
Therefore, if possible, it is better to check for support and respond.
In that sense, I think it is worth referring to the relationship between K and D of the StochRSI indicator on the left chart.
This is because the actual downtrend is likely to start when K < D.
-
In order to check for support, you definitely need support and resistance points drawn on the 1M, 1W, and 1D charts.
Ignoring this and checking for support at the drawn support and resistance points can result in not being able to apply the chart you drew to actual trading.
Therefore, you should draw support and resistance points first before starting a trade.
Otherwise, if you draw support and resistance points after starting a trade, you are more likely to set support and resistance points that reflect your subjective thoughts, so as I mentioned earlier, you are more likely to lose faith in the chart you drew.
If this phenomenon continues, it will eventually lead to leaving the investment market.
-
It is important to determine whether there is support by checking the correlation between the StochRSI indicator and other indicators at the support and resistance points drawn on the 1M, 1W, and 1D charts.
Even if the inflection point of the StochRSI indicator or other indicators occurs at a point other than the support and resistance points you drew, you should consider it as something that occurred beyond your ability to handle.
In other words, you should observe the price movement but not actually trade.
As I mentioned earlier, if you start to violate this, you will become less and less able to trust the chart you drew.
-
Accordingly, the basic trading strategy I suggest is to buy near the HA-Low indicator and sell near the HA-High indicator.
However, since the HA-Low and HA-High indicators are expressed as average values, they may move in the opposite direction to the basic trading strategy.
In other words, if the HA-Low indicator is resisted and falls, there is a possibility of a stepwise downward trend, and if the HA-High indicator is supported and rises, there is a possibility of a stepwise upward trend.
Therefore, the basic trading strategy mentioned above can be considered a trading strategy in the box section.
In the case of deviating from this box section, it is highly likely to occur before and after the volatility period indicated by the relationship between the trend line using the StochRSI indicator mentioned above and the support and resistance points drawn on the 1M, 1W, and 1D charts.
Therefore, special care is required when conducting new transactions during the volatility period.
This is because there is a high possibility of being caught in a fake when trading during the volatility period.
-
The DOM(60) and DOM(-60) indicators are good indicators to look at together with the HA-Low and HA-High indicators.
The DOM indicator is an indicator that comprehensively evaluates the DMI, OBV, and MOMENTUM indicators.
Therefore, the DOM(60) indicator is likely to be at the end of the high point range, and the DOM(060) indicator is likely to be at the end of the low point range.
In the explanation of the HA-Low and HA-High indicators,
- I said that if the HA-Low indicator receives resistance and falls, there is a possibility that a stepwise downtrend will begin,
- and if the HA-High indicator receives support and rises, there is a possibility that a stepwise uptrend will begin.
In order for an actual stepwise downtrend to begin, the price must fall below DOM(-60), and in order for a stepwise uptrend to begin, it must rise above DOM(60).
In other words, the DOM(-60) ~ HA-Low section and the HA-High ~ DOM(60) section can be seen as support and resistance sections.
-
If these correlations start to appear, I think you will be able to create a trading strategy that fits your investment style without being swayed by price volatility and proceed with trading.
The reason for analyzing charts is to trade.
Therefore, the shorter the time for chart analysis, the better, and you should increase the start of creating a trading strategy.
-
Thank you for reading to the end.
I hope you have a successful trade.
--------------------------------------------------

Next Volatility Period: Around July 2nd
Hello, traders.
If you "Follow", you can always get the latest information quickly.
Have a nice day today.
-------------------------------------
(BTCUSDT 1D chart)
The key is whether it can rise above 108316.90 and find support.
When OBV rises above the High Line, we need to check if the PVT-MACD oscillator switches to above the 0 point.
However, since the StochRSI indicator is currently showing signs of entering the overbought zone, I think there is a high possibility of resistance.
We need to check for support in the 108316.90-111696.21 zone, which is the high point boundary zone.
- If OBV fails to rise above the High Line,
- If the PVT-MACD oscillator fails to remain above the 0 point,
- If the StochRSI indicator falls from the overbought zone and switches to a state where K<D,
It is highly likely that it will eventually encounter resistance in the high point boundary zone and fall.
Therefore, what we need to do is to check for support near 108361.90-108353.0.
If it rises after that, we need to check for support near 111696.21.
Entering a new purchase in the high point boundary section is a very risky transaction.
Therefore, a short and quick response is required when making a purchase.
The basic trading strategy is to buy near the HA-Low indicator and sell near the HA-High indicator.
Do not forget this.
However, since the HA-Low or HA-High indicators are intermediate values, they may move in the opposite direction.
In other words, there is a possibility that the HA-Low indicator will receive resistance and fall, showing a stepwise downtrend, and the HA-High indicator will receive support and rise, showing a stepwise uptrend.
Therefore, you must check whether there is support in the low point boundary section of the DOM(-60) ~ HA-Low section or the high point boundary section of the HA-High ~ DOM(60) section.
To do this, you must trade in a split transaction method.
-
The next volatility period is expected to start around July 2 (July 1-3).
The reason why we calculate the volatility period is because it can be a turning point of the trend.
Therefore, making a new trade during the volatility period means that there is a high possibility of being caught in a fake.
-
Thank you for reading to the end.
I hope you have a successful trade.
--------------------------------------------------
- Here is an explanation of the big picture.
(3-year bull market, 1-year bear market pattern)
I will explain the details again when the bear market starts.
------------------------------------------------------

The key is whether it can rise above 61800
Hello, traders.
If you "Follow", you can always get new information quickly.
Have a nice day today.
-------------------------------------
(Samsung Electronics 1D chart)
HA-Low indicator and HA-High indicator have begun to converge.
Accordingly, a trend is expected to occur soon.
Since the price is currently located below the M-Signal indicator on the 1M chart, it is possible that the rise is limited.
In addition, the PVT-MACD oscillator is showing signs of falling below the 0 point, so it is showing signs of switching to a selling trend.
Since the Low Line ~ High Line channel is showing signs of switching to a rising channel, if it rises above the High Line this time and is maintained, it is possible that it will switch to a buying trend again.
That is, when it shows support around 54100-58500, it is the first purchase period.
When it rises above the M-Signal indicator on the 1M chart and maintains the price, it is the second purchase period.
Accordingly, when it shows support around 61800 from the current price position, it is the second purchase period.
The expected target range is 77500-79400, which is near the current HA-High point.
-
Thank you for reading to the end.
I hope you have a successful transaction.
--------------------------------------------------

Check 350.47 support (HA-MS indicator interpretation method)
Hello, traders.
If you "Follow", you can always get new information quickly.
Have a nice day today.
-------------------------------------
(HD 1D chart)
Can the HA-MS indicator be applied to stock charts?!!!
The conclusion is that it can be applied to all charts.
However, since the stock market is traded one week at a time, you cannot collect stocks corresponding to the profit of the coin market.
Since the coin market can be traded in decimals, you can create a medium- to long-term trading strategy by selling the purchase amount when realizing profit and collecting the number of coins (tokens) corresponding to profit.
The basic trading strategy is to buy near the HA-Low indicator and sell near the HA-High indicator.
However, when conducting short-term trading, you need to be careful to check whether the price is above or below the M-Signal indicator on the 1M chart.
If the price is below the M-Signal indicator on the 1M chart, you need to respond quickly and quickly in the form of day trading.
Therefore, it is important to find stocks that maintain their price above the M-Signal indicator on the 1M chart if possible.
If you are familiar with day trading, you can conduct trading according to the basic trading strategy regardless of the location of the M-Signal indicator on the 1M chart.
However, since the HA-Low or HA-High indicators are intermediate values, they may proceed in the opposite direction to the basic trading strategy depending on whether there is support.
In other words, if the HA-Low indicator is resisted and falls, there is a possibility of a stepwise downtrend, and if the HA-High indicator is supported and rises, there is a possibility of a stepwise uptrend.
To confirm this, you need to check the movement of the auxiliary indicator PVT-MACD oscillator indicator and the OBV indicator consisting of the Low Line ~ High Line channel.
One thing to keep in mind here is that there are differences depending on the situation, whether it is a decline or an increase.
In other words, if the HA-Low indicator declines, there is a possibility of a stepwise decline, but the end is an increase.
This means that if the HA-Low indicator shows a stepwise decline, you should focus on finding the right time to buy.
On the other hand, if the HA-High indicator rises, there is a possibility of a stepwise rise, but the end is a decline.
Therefore, if the HA-HIgh indicator shows a stepwise rise, you should focus on finding the right time to sell.
----------------------------------------------
Looking at the current price position based on the above, the price is located near the HA-Low indicator.
However, since the price is located below the M-Signal indicator on the 1M chart, it is recommended to approach the transaction in a short and fast short-term trading (day trading) manner.
The PVT-MACD oscillator indicator is showing a downward trend below the 0 point.
In other words, it should be interpreted that the selling force is dominant.
The OBV indicator is showing signs of breaking through the Low Line upward.
However, since the Low LIne ~ High Line channel is not showing an upward trend, caution is required when trading even if the price is rising until it turns into an upward trend.
Therefore, the key is whether there is support near 350.47, which is the HA-Low indicator point.
If it receives support and rises above the M-Signal indicator of the 1M chart and maintains the price, it is highly likely to turn into an upward trend.
At this time, since the HA-High indicator of the 1M chart is formed at the 363.37 point, there is a high possibility that it will act as resistance near this point.
Therefore, if you are going to make a mid- to long-term investment in this stock, it is recommended to check for support near 363.37 or near the M-Signal indicator on the 1M chart.
Otherwise, if you are thinking of buying in installments, you can buy whenever it shows support on the HA-Low indicator regardless of the M-Signal indicator on the 1M chart.
This is because the end of the stepwise downtrend on the HA-Low indicator is ultimately an uptrend.
-
Thank you for reading to the end.
I hope you have a successful transaction.
--------------------------------------------------

Checking the trend change after the volatility period
Hello, traders.
If you "Follow", you can always get the latest information quickly.
Have a nice day today.
-------------------------------------
(BTCUSDT 1D chart)
This volatility period is expected to last from June 21st to 23rd.
Therefore, it is necessary to check the trend formed after the volatility period.
The 99705.62 point is the HA-High indicator point of the 1W chart, so it is important to see if there is support near this point.
If it falls without support, it may fall to around 89294.25.
The 89294.25 point is the HA-Low indicator point of the 1D chart.
Since the M-Signal indicator of the 1W chart is rising to around 99705.62, the area around 99705.62 is likely to play an important role as support and resistance.
Even if it turns upward, it must rise above the HA-High indicator point of 108316.90 of the 1D chart to maintain the price.
If not, it is likely to fall again.
-
The fact that the HA-High indicator was created means that it fell from the high point range.
In other words, if it falls below the HA-HIgh indicator point, it is likely to start a downtrend.
However, since the HA-High indicator is an intermediate value, if it is supported near the HA-High indicator, it is possible to show a stepwise upward trend.
The end point of the high point is the DOM (60) indicator.
Therefore, it should be interpreted that it has risen above the high point section only if it rises above the 111696.21 point.
Therefore, depending on how the 108316.90-111696.21 section is broken upward, an upward trend can be predicted.
----------------------------------------------------------------------
There are auxiliary indicators OBV indicators made of Low Line ~ High Line channels and PVT-MACD oscillator indicators.
The OBV indicator made of Low Line ~ High Line channels is an indicator that can see how the channel is structured, and whether OBV falls below the Low Line of the channel or rises above the High Line.
Therefore, you can predict the future trend based on the channel pattern.
-
The PVT-MACD oscillator indicator is an indicator created by adding the Close value dash PVT value to the MACD formula.
Therefore, it shows a similar appearance to the MACD oscillator indicator.
The reason for looking at the PVT-MACD oscillator indicator is to find out how the trading volume flows.
There are many trading volume indicators, but I think this PVT-MACD oscillator indicator reflects the trading volume flow well.
-
However, you should look at the support and resistance points where the changes in the movement of the PVT-MACD oscillator indicator, the OBV indicator created by the Low Line ~ High Line channel, and the StochRSI indicator occur.
If the changes in these indicators occur near the DOM(-60), HA-Low, HA-High, and DOM(60) indicator points, it can be of great help in creating a trading strategy.
The DOM(-60) indicator indicates the end point of the low point.
That is, falling below the DOM(-60) indicator means that it has entered the low point range, and there is a high possibility that it will show a full-scale downtrend.
The fact that the HA-Low indicator was created means that it has left the low point range.
That is, if it rises above the HA-Low indicator, it means that there is a high possibility that an uptrend will begin.
However, since the HA-Low indicator is an intermediate value, if it encounters resistance and falls, it is possible that it will show a stepwise downtrend.
Therefore, whether there is support in the DOM(-60) ~ HA-Low range is important.
-
Currently, the OBV indicator created as the Low Line ~ High Line channel has fallen below the Low Line.
Therefore, we need to look at whether the Low Line ~ High Line channel will change to a downtrend channel in the future.
We need to look at whether an 'M'-shaped pattern indicating a trend change occurs.
Since the PVT-MACD oscillator indicator is still below the 0 point, it can be seen that the selling force is dominant.
However, since the oscillator is maintaining an upward trend, you can see that the overall selling pressure is decreasing.
Even so, since it is located near the HA-High indicator, the resistance in the HA-High ~ DOM(60) section is expected to be considerable.
-
Support and resistance points should be drawn on the 1M, 1W, and 1D charts.
This will increase accuracy.
However, since the standard time frame chart for all indicators is a 1D chart, it is most important to check the flow of the 1D chart.
-
You may think it is difficult because you have to look at multiple indicators at once.
The most important thing is to look at the movement when approaching the HA-Low or HA-High indicator.
The reason is that the basic trading strategy is to buy near the HA-Low indicator and sell near the HA-High indicator.
-
Thank you for reading to the end.
I hope you have a successful transaction.
--------------------------------------------------
- Here is a description of the big picture.
(3-year bull market, 1-year bear market pattern)
I will explain more details when the bear market starts.
------------------------------------------------------

The Importance of the 104463.99 Point
Hello, traders.
Please "Follow" to get the latest information quickly.
Have a nice day today.
-------------------------------------
(BTCUSDT 1D chart)
This volatility period is around June 22nd (June 21-23rd).
Therefore, waves can be generated at any time during the volatility period.
The 104463.99 point is the DOM (60) indicator point of the 1W chart, which corresponds to the end of the high point of the 1W chart.
Therefore, it seems that the price defense is being done well.
I think that defending the price at the high point is significant because it raises expectations for further increase.
-
If it falls after a period of volatility, there is a possibility that it will meet the M-Signal indicator of the 1W chart, and I think the important point at that time is the 99705.62 point.
Therefore, when it falls, you need to check whether the M-Signal indicator of the 1W chart rises to around 99705.62 and whether it is supported.
-
Even if it rises after receiving support near 104463.99, the key is whether it can maintain the price by rising above 108316.90.
The 108316.90 point is the HA-High indicator point of the 1D chart, which corresponds to the middle value of the high point range.
Therefore, in order to continue the uptrend, it must be supported and rise in the 108316.90-111696.21 range.
Currently, both the Low Line and High Line of the auxiliary indicator OBV are showing a downward trend.
Therefore, in order for the uptrend to begin, OBV must rise above the High Line and be maintained.
If not, it is highly likely that it will fall due to selling pressure.
One hopeful(?) thing is that the PVT oscillator is showing an overall upward trend.
(Changed from OBV oscillator to PVT oscillator.)
Therefore, we can see how important the area around 104463.99 is playing a role of support and resistance.
-
In my chart, the basic trading strategy is to buy near the HA-Low indicator and sell near the HA-High indicator.
Therefore, it is virtually impossible to create a trading strategy at the current price level.
In such cases, you should conduct trading through day trading or quick response.
If not, you may experience a lot of psychological fear and anxiety.
The basic time frame chart of all indicators is the 1D chart.
Therefore, if you cannot read the flow of the 1D chart, you are likely to end up getting faked and suffer losses.
Therefore, you should read the flow of the 1D chart and create a big picture of how to create a trading strategy, and respond in detail on the time frame chart below the 1D chart.
-
Thank you for reading to the end.
I hope you have a successful trade.
--------------------------------------------------
- This is an explanation of the big picture.
(3-year bull market, 1-year bear market pattern)
I will explain more details when the bear market starts.
------------------------------------------------------

Breakout point: 2706.15
Hello, traders.
If you "follow", you can always get the latest information quickly.
Have a nice day today.
-------------------------------------
(ETHUSDT 1D chart)
The key is whether the price can rise above the important support and resistance area of 2419.83-2706.15 and maintain it.
Therefore, when the 2706.15 point is broken upward, it can be said that a breakout trade is possible.
The conditions for a breakout trade are:
- OBV must rise above the High Line and be maintained,
- OBV oscillator must show an upward trend,
- StochRSI indicator must show an upward trend.
However, it is better if StochRSI indicator has not entered the overbought zone.
When the rise begins, the resistance zone is expected to be around 3265.0-3321.30.
-
Although funds are continuously flowing into the coin market, it may feel like the trading volume has decreased.
The reason for this is thought to be that BTC dominance is generally showing an upward trend.
The meaning of BTC dominance rising means that funds in the coin market are concentrated toward BTC.
Therefore, I think that the overall trading volume has decreased because more funds are needed for the price to rise.
When the altcoin bull market begins, more transactions will occur, which will make you think that liquidity has increased in the coin market.
Therefore, for the altcoin bull market to begin, the BTC dominance must fall below 55.01 and remain there or continue to fall.
If the USDT dominance remains below 4.97 or continues to fall, the coin market is likely to rise.
At this time, depending on the BTC dominance mentioned earlier, you can distinguish whether the rise is focused on BTC or whether the altcoin is also rising.
If the BTC dominance continues to rise, most altcoins are likely to gradually move sideways or fall.
Therefore, if you are trading altcoins in this situation, I think it would be useful to increase the number of coins (tokens) corresponding to profit while responding quickly and briefly.
In other words, it means selling the purchase amount (+including transaction fees) when the price rises by purchase price, leaving the number of coins (tokens) corresponding to profit.
The coins (tokens) increased in this way are coins (tokens) with an average purchase price of 0, which will reduce the psychological burden when the altcoin bull market begins, allowing you to obtain a good average purchase price.
-
Thank you for reading to the end.
I hope you have a successful transaction.
--------------------------------------------------
- This is an explanation of the big picture.
(3-year bull market, 1-year bear market pattern)
I will explain more details when the bear market starts.
------------------------------------------------------

Next Volatility Period: Around June 22
Hello, traders.
If you "Follow", you can always get new information quickly.
Have a nice day today.
-------------------------------------
(BTCUSDT 1M chart)
The morning star candle that we often heard about when studying candles appeared.
However, since the candle has not closed yet, the shape of the candle may change.
In stock charts, there were cases where the movement could be predicted with the shape of these candles, but in the coin market, it is impossible to predict.
The reason is that trading is possible 24 hours a day.
Most candle shapes occur with gaps, allowing for a comprehensive interpretation, but in the coin market, gaps are not likely to occur, so I think there is nothing that can be known from the shape of the candles.
Therefore, it is recommended not to try to analyze the chart with the actual shape or pattern of the candles.
However, you need to study to be able to read the arrangement of the candles in order to set support and resistance points.
Even this is not difficult to indicate support and resistance points because there are indicators that indicate support and resistance points.
-
(1W chart)
The 104463.99 point is the DOM (60) indicator point, which corresponds to the end of the high point.
Also, the 99705.62 point is the HA-High indicator point, which corresponds to the middle of the high points.
Therefore, the 99705.62-104463.99 section can be interpreted as the high point boundary section.
The actual trend is likely to occur while falling from 99705.62.
The importance of the 99705.62 point is increasing because the M-Signal indicator on the 1W chart is rising near the HA-High indicator point.
If it falls below the M-Signal indicator on the 1W chart, it is possible that the trend will be determined again when it meets the M-Signal indicator on the 1M chart.
Also, if it falls from the HA-High indicator, it can meet the HA-Low indicator.
Therefore, if the price starts to fall, you should check whether the HA-Low indicator is generated.
The fact that the HA-Low indicator was created means that it rose from the low range.
That is, just as the HA-High indicator corresponds to the midpoint of the highs, the HA-Low indicator corresponds to the midpoint of the lows.
The end point of the lows corresponds to the DOM(-60) indicator point.
-
(1D chart)
For this reason, it is important to see support around 104463.99-106133.74.
The trend is likely to appear after the next volatility period, around June 22nd (June 21st-23rd).
Therefore, we should consider the 104463.99-106133.74 range as the middle range,
- and see if it falls below 99705.62,
- or rises above 108316.90.
Accordingly, we should create a response strategy and be prepared not to panic when a trend appears.
-
The OBV is currently below the Low Line.
Therefore, if it does not receive support at the 104463.99 point, it is likely to fall again.
Since the OBV oscillator is still below the 0 point, we can see that the selling pressure is strong.
However, looking at the overall movement of the oscillator, we can see that the selling pressure is decreasing.
Therefore, if there is another decline, the key issue is whether there is support near 99705.62.
-
In summary, the area around 104463.99 is playing an important role as support and resistance.
Therefore, after the next volatility period, around June 22, we need to check and respond to the direction in which it deviates from the 99705.62-108316.90 range.
-
Thank you for reading to the end.
I hope you have a successful trade.
--------------------------------------------------
- This is an explanation of the big picture.
(3-year bull market, 1-year bear market pattern)
I will explain more details when the bear market starts.
------------------------------------------------------

About the chart that shows a sideways movement...
Hello, traders.
If you "follow", you can always get new information quickly.
Have a nice day today.
-------------------------------------
When you study charts, you will realize how difficult it is to move sideways.
Therefore, depending on how long the sideways movement was before the big wave, the size of the wave is also predicted.
However, in the charts showing sideways movement, the price range and wave size are often known after the wave appears.
This shows that the location of the sideways movement and the size of the sideways wave are important.
-
Looking at the chart above, we can say that it is showing a sideways movement.
However, since the price is located at the lowest price range, it is better to exclude this chart.
The reason is that if it is showing a sideways movement at the lowest price range, it is likely that the trading volume has decreased significantly due to being excluded from the market.
This is because it is likely to take a long time to turn into an upward trend in this state.
-
Looking at the chart above, the price is showing a sideways movement while maintaining a certain interval after rising.
The sideways movement is about 31%, so it may be ambiguous to say that it is actually sideways.
However, if the price moves sideways while maintaining a certain interval after rising, it means that someone is trying to maintain the price.
Therefore, when it shows a movement that breaks through the sideways section, it should be considered that there is a possibility that a large wave will occur.
The wave can be either upward or downward.
Therefore, it is necessary to be careful not to jump into a purchase with the idea that it will definitely rise in the future just because it moves sideways.
A box section is set at both ends of the sideways section.
Therefore, it is recommended to proceed with a purchase in installments when it shows support after entering this box section.
In other words, it is important to check the support in the 1.5-1.9669 section or the 25641-2.6013 section.
You can see that the HA-Low indicator and the HA-High indicator are converging.
Therefore, if this convergence is broken, it is expected that a trend will be formed.
-
Like this, you should measure the price position of the sideways movement and the width of the sideways movement well and think in advance about whether to proceed with the transaction when it deviates from that range.
Otherwise, if you start trading after the wave has already started, you may end up giving up the transaction because you cannot overcome the wave.
Since it is not known when the movement will start once the sideways movement starts, individual investors easily get tired.
Therefore, when the coin (token) you want to trade shows a sideways movement, it is recommended to increase the number of coins (tokens) corresponding to the profit while conducting short-term trading (day trading).
If you do this, you will naturally be able to see how the sideways waves change, and you will be able to hold out until a big wave starts.
I think there are quite a few people who are not familiar with day trading and say they will buy at once when the wave starts.
If you can hold out well against the wave, you will get good results, but there is a possibility that the trade will fail 7-8 times out of 10, so if possible, it is good to get used to the feeling by day trading coins (tokens) that show this sideways pattern.
-
Thank you for reading to the end.
I hope you have a successful trade.
--------------------------------------------------

Check for support near 104463.99-106133.74
Hello, traders.
Please "Follow" to get the latest information quickly.
Have a nice day today.
-------------------------------------
(BTCUSDT 1D chart)
The next volatility period we should pay attention to is around June 22nd (June 21-23).
Currently, the HA-High indicator of the 1D chart is formed at 108316.90, so the key is whether it can rise above that point and maintain the price.
If not, there is a possibility that it will touch the M-Signal indicator of the 1W chart.
In other words, we need to check whether there is support near 99705.62.
However, we need to check whether there is support near 104463.99-106133.74.
-
If we look at the auxiliary indicator OBV, the High Line is showing a downward trend.
This means that the high point is getting lower.
Therefore, if it rises above 108316.90 this time, we need to check whether the OBV can rise above the High Line and maintain it.
-
DOM(60), DOM(-60) indicators are displayed by the Close value.
HA-Low, HA-High indicators are displayed by the (Open + High + Low + Close) / 4 value.
Therefore, HA-Low and HA-High indicators represent the middle value, and DOM(60) and DOM(-60) represent the end point value.
This makes it difficult to trade when DOM(60) and DOM(-60) indicators are generated.
To make this clearer, I added an arrow signal.
DOM(60) indicator and HA-High indicator are indicators that represent high points.
In other words, the generation of DOM(60) indicator and HA-High indicator means that there has been a decline in the high point range.
However, as I mentioned earlier, the DOM(60) indicator is not easy to respond to because it indicates the end point, but the HA-High indicator indicates the middle value, so there is time to check whether there is support near the HA-High indicator and respond accordingly.
Therefore, you should check whether there is support in the section between the HA-High indicator and the DOM(60) indicator and respond accordingly.
On the contrary, the DOM(-60) indicator and the HA-Low indicator are indicators that indicate the low point.
You can think of it as the opposite of what I explained above.
-
By not indicating the support and resistance points according to the arrangement of the candles, but using the indicator points as the support and resistance points, anyone can see how the support and resistance points were created.
This will provide important objective information for trading.
-
Thank you for reading to the end.
I wish you successful trading.
--------------------------------------------------
- This is an explanation of the big picture.
(3-year bull market, 1-year bear market pattern)
I will explain more details when the bear market starts.
------------------------------------------------------

Differences Between Trading Stock Market and Coin Market
Hello, traders.
If you "Follow", you can always get new information quickly.
Have a nice day today.
-------------------------------------
Please read with a light heart.
-
Trading stock market and coin market seem similar, but they are very different.
In stock market, you have to buy and sell 1 share at a time, but in coin market, you can buy and sell in decimals.
This difference makes a big difference in buying and selling.
In the stock market, you should buy when the price is rising from a low price if possible.
The reason is that since you buy in units of 1 week, you have to invest more money when you sell and then buy to buy 1 week.
I think the same goes for the coin market, but since you can buy in decimal units, you have the advantage of being able to buy at a higher price than when you buy in the stock market.
For example, if you sell and then buy again at the same price, the number of coins (tokens) will decrease, but there will be no cases where you can't buy at all.
Therefore, the coin market is an investment market where you can trade at virtually any price range.
-
In terms of profit realization, the stock market can only be traded in a way that earns cash profits.
The reason is that, as I mentioned earlier, since you have to trade in units of 1 week, there are restrictions on trading.
However, in the coin market, in addition to the method of earning cash profits, you can also increase the number of coins (tokens) corresponding to the profits.
The biggest advantage of increasing the number of coins (tokens) corresponding to profit is that you can get a large profit in the long term, and the burden of the average purchase price when conducting a transaction is reduced.
When the price rises by purchase price, if you sell the purchase amount (+ including the transaction fee), the coins (tokens) corresponding to profit will remain.
Since these coins (tokens) have an average purchase price of 0, they always correspond to profit even if there is volatility.
In addition, even if the price falls and you buy again, the average purchase price is set low, so it plays a good role in finding the right time to buy and starting a transaction.
Of course, when the number of coins (tokens) corresponding to profit is small, it does not have a big effect on the average purchase price, but as the number increases, you will realize its true value.
You can also get some cash when you increase the number of coins (tokens) corresponding to profit.
When selling, if you add up the purchase price + transaction fee X 2~3, you can also get some cash profit.
If you get cash profit, the number of coins (tokens) remaining will decrease, so you can adjust it well according to the situation.
When the profit is large, increase the cash profit slightly, and when you think the profit is small, decrease the cash profit.
-
Therefore, when you first move from the stock market to the coin market and start trading, you will experience that the trading is not going well for some reason.
In the stock market, there are some restrictions on the rise and fall, but in the coin market, there are no restrictions, so it is not easy to respond.
However, as I mentioned earlier, the biggest problem is the difference in the transaction unit.
When trading in the stock market, you need to check various announcements and issues in addition to the chart and determine how this information affects the stock or theme you want to trade.
This is because trading is not conducted 24 hours a day, 365 days a year like the coin market.
This is because if an announcement or issue occurs during a non-trading period, the stock market may rise or fall significantly when trading begins.
-
When using my chart on a stock chart, the basic trading strategy is to buy near the HA-Low indicator and sell near the HA-High indicator.
However, if you want to buy more, you can buy more when the M-Signal of the 1D chart > M-Signal of the 1W chart, and it shows support near the M-Signal indicator of the 1W chart.
In the stock chart, it is recommended to trade when the M-Signal indicators of the 1D, 1W, and 1M charts are aligned.
The reason is that, as I mentioned earlier, trading must be done in 1-week units, so the timing of the purchase is important.
In the coin chart, you can actually trade when it shows support at the support and resistance points.
However, since trading is possible 24 hours a day, 365 days a year, even if it shows support at the support and resistance points, psychological anxiety due to volatility increases, so it is recommended to proceed with trading according to the basic trading strategy.
The creation of the HA-Low indicator means that it has risen from the low range, and the creation of the HA-High indicator means that it has fallen from the high range.
Therefore, if it shows support near the HA-Low indicator, it is likely to rise, and if it shows resistance near the HA-High indicator, it is likely to fall.
However, on the contrary, if it is supported and rises at the HA-High indicator, it is likely to show a stepwise rise, and if it is resisted and falls at the HA-Low indicator, it is likely to show a stepwise fall.
In order to confirm this movement, you need to invest a lot of time and check the situation in real time.
-
Thank you for reading to the end.
I hope you have a successful transaction.
--------------------------------------------------

The key is whether the price can hold above 25.06
Hello, traders.
If you "Follow", you can always get the latest information quickly.
Have a nice day today.
-------------------------------------
(ENSUSDT 1D chart)
The key is whether the price can be maintained by rising above the important support and resistance zone of 20.93-25.06.
If it fails to rise, it is likely to fall to the support zone of 11.86-14.61, so you should think about a response plan for this.
However, the 20.93 point is a volume profile zone, so you should check whether it is supported when falling to this area.
If it starts to rise,
1st: 28.15
2nd: 33.54
The 1st and 2nd areas above are likely to act as resistance.
-
The indicators used as basic trading strategies are the HA-Low indicator and the HA-High indicator.
The basic trading strategy is to buy near the HA-Low indicator and sell near the HA-High indicator.
However, if it is supported by the HA-High indicator and rises, it is likely to show a stepwise upward trend, and if it is resisted by the HA-Low indicator and falls, it is likely to show a stepwise downward trend.
Therefore, the trading method should be a split trading method.
The end of the stepwise upward trend is a decline, and the end of the stepwise downward trend is an increase.
Therefore, if you buy when the HA-High indicator is supported and rises, a short and quick response is required.
Accordingly, it is not recommended to use the HA-High indicator as the first purchase point.
If you are familiar with day trading, the HA-High indicator may also be a purchase point.
Currently, the HA-Low indicator is formed at the 14.61 point, and the HA-High indicator is formed at the 23.12 point.
-
Depending on the arrangement of the candles, the important support and resistance zones are in the 20.93-25.06 zone.
Therefore, regardless of the current HA-High indicator position, if it shows support above 25.06, it is a time to buy.
However, since the buy zone and resistance zone are close, a quick response is required.
Therefore, the support and resistance points drawn on the 1M, 1W, and 1D charts correspond to important trading strategy points.
In order to draw reliable support and resistance points, objective information is required.
Be careful because the support and resistance points drawn after starting a transaction may reflect your psychological state and become unreliable support and resistance points.
-
Thank you for reading to the end.
I wish you successful trading.
--------------------------------------------------
- This is an explanation of the big picture.
(3-year bull market, 1-year bear market pattern)
I will explain more details when the bear market starts.
------------------------------------------------------

Important Support and Resistance Zones: 23.03-28.93
Hello, traders.
If you "Follow", you can always get the latest information quickly.
Have a nice day today.
-------------------------------------
(INTC 1D chart)
It shows an upward trend above the 18.69-21.33 zone, which is a medium- to long-term buy zone.
However, you need to be relaxed because it needs to rise above 28.93 to turn into an uptrend.
The 28.93 point is the HA-Low indicator point on the 1M chart, and it is expected that a breakout trade will be possible when it breaks above this point.
Since the price is located below the M-Signal indicator on the 1M chart, you should respond quickly and briefly with short-term trading while observing the situation.
Therefore, if you were unable to purchase in the mid- to long-term purchase section,
1st: M-Signal indicator on the 1M chart
2nd: 28.93
You can proceed with a purchase when it shows support near the 1st and 2nd above.
If it falls below 18.69, you should stop trading and observe the situation.
-
Thank you for reading to the end.
I hope you have a successful transaction.
--------------------------------------------------

Volatility period: around June 13 (June 12-14)
Hello, traders.
If you "Follow", you can always get new information quickly.
Have a nice day today.
-------------------------------------
I think BNB is a coin that can be invested in the long term, like BTC and ETH.
This is because many people around the world are using it.
The exchange may close at any moment, but I think the probability of that happening is quite low, so I think it is suitable for long-term investment.
-
(BNBUSDT 1M chart)
Since the trading volume seems to have decreased significantly due to the large increase in the price, I think it is not surprising that volatility can occur at any time.
For now, the key is whether it can maintain the price by rising above 702.30.
The important support and resistance range is the 533.90-587.58 range.
Therefore, even if it falls, it is necessary to check whether it is supported near the important support and resistance range.
-
(1W chart)
In order to escape the mid-term downtrend line, the key is whether it can receive support near 661.74 and rise above 702.30.
If not, and it falls, there is a possibility that it will fall to around 58758-595.0.
Accordingly, the important volatility period is expected to be around the week of July 21.
-
(1D chart)
The key is whether it can maintain the price above 675.54 by following the short-term uptrend.
To do so, we need to see whether the price maintains above 661.74 after passing the volatility period around June 13 (June 12-14).
If it falls, it is expected to determine the trend again when it meets the M-Signal indicator on the 1W chart.
At this time, if it shows support around 583.54-595.0, I think it is a time to buy.
However, since the important section is the 533.90-587.58 section, if a strong decline occurs, it seems likely to touch the important section.
-
I think it has risen a lot to make a long-term investment.
Therefore, I think it is better to make a short-term investment and increase the number of coins (tokens) corresponding to the profit for now.
The method of increasing the number of coins (tokens) corresponding to the profit is to sell the purchase principal (+including transaction fees) when the price rises by purchase price.
In that case, the cash profit will be almost non-existent or small, but I think it is advantageous from a long-term investment perspective because the number of coins (tokens) increases.
The coins (tokens) created this way have an average purchase price of 0, so it will reduce the psychological burden of buying when the price falls.
-
Thank you for reading to the end.
I hope you have a successful transaction.
--------------------------------------------------
- This is an explanation of the big picture.
(3-year bull market, 1-year bear market pattern)
I will explain more details when the bear market starts.
------------------------------------------------------

Important support and resistance levels: 0.019249-0.024672
Hello, traders.
If you "Follow", you can always get the latest information quickly.
Have a nice day today.
-------------------------------------
(JASMYUSDT.P 1D chart)
It is showing signs of breaking away from the medium- to long-term downtrend line (1).
However, since it is located below the M-Signal indicator of the 1M chart, a short and quick response is required when trading.
It is expected that the price will start to rise if it rises above the important support and resistance area of 0.019249-0.024672 and maintains the price.
Even if it does not rise and falls, if the price is maintained above the downtrend line (1), it is expected that there will be an increase to eventually rise to the important support and resistance area.
The volatility period is around June 24, which is similar to the BTC volatility period, so it seems that it will have a big impact on the movement of BTC.
Since the HA-Low indicator of the 1D chart is formed at the 0.014447 point, if it is supported, it is an aggressive buying period.
-
Thank you for reading to the end.
I hope you have a successful transaction.
--------------------------------------------------
- This is an explanation of the big picture.
(3-year bull market, 1-year bear market pattern)
I will explain more details when the bear market starts.
------------------------------------------------------

Support and resistance zone: 104463.74-106133.74
Hello traders.
If you "Follow", you can always get new information quickly.
Have a nice day today.
-------------------------------------
(BTCUSDT 1W chart)
When a new candle is created, you should check if the HA-High indicator is created at the 99705.62 point.
The reason is that the HA-High indicator was created, which means that it has fallen from the high point range.
In other words, it also means that it can fall to around or below the 97705.62 point.
Since the current candle fell to around 99705.62 and then rose, it can rise like this when a new candle is created.
We have several indicators that can determine the high point.
Representative indicators include DOM (60), StochRSI 80, and HA-High.
Therefore, the high point range is 104463.99-104984.57 and 97705.62.
Therefore, in order to turn downward, it is likely to start when it falls below 104463.99-104984.57 and shows resistance, and it can be interpreted that the downtrend is confirmed when it falls below 97705.62.
If we think about it the other way around, if the price stays above 104463.99-104984.57, it will eventually create a new high.
-
When we first study charts, we start to become curious about charts as we learn about price moving averages.
As such, when we look at charts, our understanding of charts changes depending on how well we understand the average value.
However, when we first learn about price moving averages in chart analysis, we start to study all sorts of different analysis techniques as we realize that there are ambiguous parts in conducting transactions.
As a result, chart analysis becomes more and more difficult, and we end up giving up on chart analysis.
If you have studied chart analysis in your own way without giving up on it, you will realize that it will eventually converge to the average.
No matter what indicator or analysis technique you use, you will eventually converge to the average and then diverge.
Therefore, we should try to analyze the chart using the easiest and most convenient method.
The reason is that chart analysis is ultimately just a means to create a trading strategy and has no other meaning.
-
The basic trading strategy on my chart is to buy near the HA-Low indicator and sell near the HA-High indicator.
The HA-Low and HA-High indicators are indicators created for trading on the Heikin-Ashi chart and ultimately represent the average.
The HA-High indicator is the average value that represents the high point range, and the HA-Low indicator is the average value that represents the low point range.
Therefore, if it is supported and rises near the HA-Low indicator, it is a buying period, and if it is resisted and falls near the HA-High indicator, it is a selling period.
However, since it is an average, if it is supported and rises near the HA-High indicator, it is likely to show a stepwise upward trend, and if it is resisted and falls near the HA-Low indicator, it is likely to show a stepwise downward trend.
Because of this, we need to adopt a split trading method.
-
The auxiliary indicator, StochRSI, is an indicator that moves based on the 50 point.
Therefore, when the StochRSI indicator value is below 50, we need to focus on finding a buying point, and when it is above 50, we need to focus on finding a selling point.
A decisive hint for this is when it enters the overbought or oversold zone.
The auxiliary indicator, OBV, is an indicator that adds up the difference in trading volume according to price.
If you divide the OBV indicator into High Line and Low Line and understand the movement of OBV, you can understand the movement of the price to some extent.
However, since not all indicators follow the price trend exactly, you should not try to judge everything with just one indicator.
If you express the OBV indicator in the form of an oscillator, it will look similar to the MACD oscillator.
As I mentioned earlier, this is because the chart eventually converges to the average value.
Using this characteristic, we combined the OBV indicator with a MACD-type oscillator.
If it is located below 0 based on the 0 point, it means that the selling pressure is high, and if it is located above 0, it means that the buying pressure is high.
No matter what indicator or analysis technique you study, you must have a solid basic understanding of the average value.
If not, no matter how good the indicator or analysis technique you learn, you will not be able to analyze it as you studied and create a trading strategy when you actually trade.
-
(1D chart)
It is highly likely that the uptrend will resume if it rises above the HA-High indicator point of 108316.90.
To do so, it is important to see if it can receive support and rise around 104463.99-106133.74.
If it fails to rise, it will eventually show a downward trend again.
If it meets the HA-High indicator and falls, it is likely to fall until it meets the HA-Low indicator.
Currently, the HA-Low indicator is formed at the 89294.25 point, but as the price falls, the HA-Low indicator is likely to be newly created.
Therefore, we need to check if the HA-Low indicator is newly created when the price falls.
Since the OBV of the auxiliary indicator is located near the Low Line and the OBV oscillator is also located below the 0 point, we can see that the selling pressure is strong.
Therefore, we need to check whether the OBV rises above the High Line when it is supported near 104463.99-106133.74 or whether the OBV oscillator rises above the 0 point.
-
I think that all indicators or analysis techniques are ultimately tools that confirm whether there is support at the support and resistance points or sections drawn on the 1M, 1W, and 1D charts.
Therefore, in order to use indicators or analysis techniques, it depends on how well you understand and draw the support and resistance points or sections according to the arrangement of the candles.
Therefore, you need to first check how reliable the support and resistance points you drew are and practice creating a trading strategy accordingly.
Ultimately, it can be seen that how well the support and resistance points are drawn depends on how well the chart analysis or trading strategy is made.
-
If you look at the 1W chart and the 1D chart, you can see that the important volatility period is around June 22.
The volatility period of the 1W chart is from June 16 to 29.
The volatility period of the 1D chart is from June 10 to 14 and from June 21 to 23.
Therefore, when the HA-High indicator of the 1W chart is generated at the 99705.62 point, it is important to maintain the price above 99705.62 after passing the volatility period of the 1W chart.
Since the HA-High indicator on the 1D chart is formed at 108316.90, we need to see if it can be supported and rise near 108316.90.
In summary, we can see that the important support and resistance range in the volatility period is 99705.62-108316.90.
Among these ranges, it is expected that the wave will start depending on whether the current price is supported in the 104463.99-106133.74 range.
In other words, the 104463.99-106133.74 range corresponds to the middle range of the 99705.62-108316.90 range, the average value.
-
Thank you for reading to the end.
I hope you have a successful transaction.
--------------------------------------------------
- This is an explanation of the big picture.
(3-year bull market, 1-year bear market pattern)
I will explain more details when the bear market starts.
------------------------------------------------------

Important support and resistance sections: 267.07-311.48
Hello, traders.
If you "Follow", you can always get new information quickly.
Have a nice day today.
-------------------------------------
(TSLA 1D chart)
If you see support within the important support and resistance sections, it is a time to buy.
However, if a strong decline occurs, strong buying is expected around 172.6-234.59.
It is expected to be an important buying period for long-term investment.
-
Thank you for reading to the end.
I hope you have a successful transaction.
--------------------------------------------------
