Check if the price can hold above 2627.18
Hello, traders.
If you "Follow", you can always get the latest information quickly.
Have a nice day today.
-------------------------------------
(ETHUSDT 1D chart)
The M-Signal indicator on the 1M chart has risen above.
Accordingly, the key is whether it can find support near 2677.18 and rise.
If OBV rises above the A line, the price is expected to rise significantly once more.
Then, it is expected to rise to around 3265.0-3321.30.
-
If it falls without being supported near 2627.18, it is necessary to check whether it is supported near the right Fibonacci ratio 0.5 (2295.84).
Since the M-Signal indicator on the 1W and 1D charts is passing near that point, it is expected to play an important role.
-
Since the StochRSI indicator is in the overbought zone, it will eventually show a downward trend.
It is not known how much this decline will occur, but since the StochRSI 50 indicator is currently formed near 2359.35, it is important to check whether there is support near that area.
Therefore, in order to proceed with a new transaction, I think it is better to check the support point when the StochRSI indicator shows a downward and then upward trend in the overbought zone.
-
Thank you for reading to the end.
I hope you have a successful transaction.
--------------------------------------------------
- Here is an explanation of the big picture.
I used TradingView's INDEX chart to check the entire range of BTC.
I rewrote the previous chart to update it while touching the Fibonacci ratio range of 1.902 (101875.70) ~ 2 (106275.10).
(Previous BTCUSD 12M chart)
Looking at the big picture, it seems to have been maintaining an upward trend following a pattern since 2015.
In other words, it is a pattern that maintains a 3-year bull market and faces a 1-year bear market.
Accordingly, the upward trend is expected to continue until 2025.
-
(Current BTCUSD 12M chart)
Based on the currently written Fibonacci ratio, it is displayed up to 3.618 (178910.15).
It is expected that it will not fall again below the Fibonacci ratio of 0.618 (44234.54).
(BTCUSDT 12M chart)
Based on the BTCUSDT chart, I think it is around 42283.58.
-
I will explain it again with the BTCUSD chart.
The Fibonacci ratio ranges marked in the green boxes, 1.902 (101875.70) ~ 2 (106275.10) and 3 (151166.97) ~ 3.14 (157451.83), are expected to be important support and resistance ranges.
In other words, it seems likely that they will act as volume profile ranges.
Therefore, in order to break through these ranges upward, I think the point to watch is whether they can receive support and rise near the Fibonacci ratios of 1.618 (89126.41) and 2.618 (134018.28).
Therefore, the maximum rising range in 2025 is expected to be the 3 (151166.97) ~ 3.14 (157451.83) range.
In order to do that, we need to see if it is supported and rises near 2.618 (134018.28).
If it falls after the bull market in 2025, we don't know how far it will fall, but based on the previous decline, we expect it to fall by about -60% to -70%.
Therefore, if it starts to fall near the Fibonacci ratio 3.14 (157451.83), it seems likely that it will fall to around Fibonacci 0.618 (44234.54).
I will explain more details when the bear market starts.
------------------------------------------------------
HA-MS

Check support near 104984.57
Hello, traders.
If you "Follow", you can always get new information quickly.
Have a nice day today.
-------------------------------------
(BTCUSDT 1D chart)
OBV indicator is showing signs of rising above High Line.
Therefore, the candle body color has changed to dark green (#00332a).
Therefore, the key is whether it can be supported near StochRSI 80 (104984.57) and rise above 10613.74.
If it falls,
1st: 104463.99
2nd: 102302.08
You should check whether it is supported near the 1st and 2nd above.
-
If it is supported near 104984.57, it is likely to rise, but since the volatility period continues until May 20 (up to May 28), it is recommended to check whether it is supported.
Therefore, the point of observation is whether the price can be maintained above 102302.08 even after the volatility period.
-
Thank you for reading to the end.
I hope you have a successful trade.
--------------------------------------------------
- Explanation of the big picture.
I used TradingView's INDEX chart to check the entire range of BTC.
I rewrote it to update the previous chart by touching the Fibonacci ratio range of 1.902 (101875.70) ~ 2 (106275.10).
(Previous BTCUSD 12M chart)
Looking at the big picture, it seems to have been maintaining an upward trend following a pattern since 2015.
In other words, it is a pattern that maintains a 3-year upward trend and faces a 1-year downward trend.
Accordingly, the upward trend is expected to continue until 2025.
-
(Current BTCUSD 12M chart)
Based on the currently written Fibonacci ratio, it is displayed up to 3.618 (178910.15).
It is expected that it will not fall again below the Fibonacci ratio of 0.618 (44234.54).
(BTCUSDT 12M chart)
Based on the BTCUSDT chart, I think it is around 42283.58.
-
I will explain it again with the BTCUSD chart.
The Fibonacci ratio ranges marked in the green boxes, 1.902 (101875.70) ~ 2 (106275.10) and 3 (151166.97) ~ 3.14 (157451.83), are expected to be important support and resistance ranges.
In other words, it seems likely that they will act as volume profile ranges.
Therefore, in order to break through these ranges upward, I think the point to watch is whether they can receive support and rise near the Fibonacci ratios of 1.618 (89126.41) and 2.618 (134018.28).
Therefore, the maximum rising range in 2025 is expected to be the 3 (151166.97) ~ 3.14 (157451.83) range.
In order to do that, we need to see if it is supported and rises near 2.618 (134018.28).
If it falls after the bull market in 2025, we don't know how far it will fall, but based on the previous decline, we expect it to fall by about -60% to -70%.
Therefore, if it starts to fall near the Fibonacci ratio 3.14 (157451.83), it seems likely that it will fall to around Fibonacci 0.618 (44234.54).
I will explain more details when the bear market starts.
------------------------------------------------------

The point to watch is whether it can rise above 106133.74
Hello, traders.
If you "Follow", you can always get new information quickly.
Have a nice day today.
-------------------------------------
In order to distinguish which time frame chart the line was drawn on, it is divided into 3 types of lines.
You can create a trading strategy by responding to the support and resistance points or sections drawn on the chart depending on whether there is support or not.
-
The left is an example of when the support and resistance points were first created, and the right is an example of what it looked like after that.
To draw support and resistance points, you need to understand the arrangement of candles.
By checking how the candles are arranged, you can draw support and resistance points or sections like the example chart.
To draw support and resistance points or sections on a time frame chart like this, you need to check the arrangement of candles while minimizing the chart as much as possible.
-
Indicators are used to draw this work using more objective information.
That is, lines are drawn at the DOM(60), DOM(-60), HA-High, and HA-Low indicator points.
In this way, you will be able to reduce your subjective thoughts as much as possible.
Reducing your subjective thoughts will ensure the reliability of the drawn support and resistance points or sections.
-
Going back and drawing support and resistance points or sections with the arrangement of candles means that there must have been movement of candles in the past.
Therefore, if the candle moves to a point where there is no trace of the past, you can no longer draw support and resistance points or sections.
In terms of compensating for this shortcoming, it may be more useful to use indicators to display support and resistance points or sections.
-
The DOM indicator is an indicator that comprehensively evaluates the DMI + OBV + MOMENTUM indicators.
If the DOM indicator is 60 or higher, it means that all indicators have risen above their highest value.
If the DOM indicator is -60 or lower, it means that all indicators have fallen below their lowest value.
The fact that the DOM(60) indicator was created means that it is likely to enter the high point range.
The fact that the DOM(-60) indicator was created means that it is likely to enter the low point range.
Therefore, the DOM(60) indicator is likely to correspond to the resistance point, and the DOM(-60) indicator is likely to correspond to the support point.
Since the DOM indicator is displayed on the Close value, it has the disadvantage of being difficult to respond immediately when the actual DOM indicator is created.
However, once it is created, it will faithfully perform the role of support and resistance.
-
The HA-Low and HA-High indicators are indicators created to determine the trading point from the Heikin-Ashi candle.
Accordingly, the plotted point corresponds to the average value.
Therefore, the HA-Low and HA-High indicator points have the disadvantage of being expressed differently from the candle's value.
As you can see from the formulas of the HA-Low and HA-High indicators, the RSI value is included in the conditions of the formula.
The fact that the HA-Low indicator was created means that the price rose from the low point range.
Therefore, the HA-Low indicator corresponds to the support point.
The fact that the HA-High indicator was created means that the price fell from the high point range.
Therefore, the HA-High indicator corresponds to the resistance point.
Therefore, we basically have a trading strategy of buying when the HA-Low indicator is created and selling when the HA-High indicator is created.
-
It is not clear whether the actual support and resistance points or sections are supported or resisted.
However, as time passes, we can see whether it is supported or resisted.
To help determine whether it is supported or resisted, we use the StochRSI indicator and OBV indicator as auxiliary indicators.
-----------------------------------------
(BTCUSDT 1D chart)
It is showing an upward trend above the DOM (60) indicator displayed at the current candle position.
And, if StochRSI rises above 80 and maintains the price, the possibility of an upward trend will increase.
If the auxiliary indicator StochRSI indicator rises in the oversold zone and OBV rises above the High Line, the upward trend will be guaranteed.
The previous DOM (60) indicator is formed near the Fibonacci ratio 2 (106178.85).
Therefore, the point of observation is whether it can rise above that.
If it rises and maintains the price, it is expected to renew the ATH.
If not, and it falls below the HA-High indicator or the M-Signal indicator on the 1D chart,
1st: 97226.92
2nd: M-Signal on the 1W chart
You should check for support near the 1st and 2nd above.
-
This volatility period is expected to continue until May 20.
However, volatility may also occur around May 23 (May 22-24) and around May 27 (May 26-28), so you should be careful of volatility until May 28.
-
Thank you for reading to the end.
I hope you have a successful trade.
--------------------------------------------------
- This is an explanation of the big picture.
I used TradingView's INDEX chart to check the entire range of BTC.
I rewrote the previous chart to update it by touching the Fibonacci ratio range of 1.902 (101875.70) ~ 2 (106275.10).
(Previous BTCUSD 12M chart)
Looking at the big picture, it seems to have been following a pattern since 2015 and has been rising.
In other words, it is a pattern that maintains a 3-year uptrend and faces a 1-year downtrend.
Accordingly, the uptrend is expected to continue until 2025.
-
(Current BTCUSD 12M chart)
Based on the currently written Fibonacci ratio, it shows up to 3.618 (178910.15).
Fibonacci ratio 0.618 (44234.54) is not expected to fall again.
(BTCUSDT 12M chart)
I think it is around 42283.58 when looking at the BTCUSDT chart.
-
I will explain it again with the BTCUSD chart.
The Fibonacci ratio ranges marked in the light green boxes, 1.902 (101875.70) ~ 2 (106275.10) and 3 (151166.97) ~ 3.14 (157451.83), are expected to be important support and resistance ranges.
In other words, it seems likely to act as a volume profile range.
Therefore, in order to break through this section upward, I think the point to watch is whether it can rise with support near the Fibonacci ratios of 1.618 (89126.41) and 2.618 (134018.28).
Therefore, the maximum rising section in 2025 is expected to be the 3 (151166.97) ~ 3.14 (157451.83) section.
To do that, we need to look at whether it can rise with support near 2.618 (134018.28).
If it falls after the bull market in 2025, we don't know how far it will fall, but considering the previous decline, we expect it to fall by about -60% to -70%.
So, if the decline starts near the Fibonacci ratio 3.14 (157451.83), it seems likely that it will fall to around Fibonacci 0.618 (44234.54).
I will explain more details when the downtrend starts.
------------------------------------------------------

Important section: 101947.24-106133.74
Hello, traders.
If you "Follow", you can always get new information quickly.
Have a nice day today.
-------------------------------------
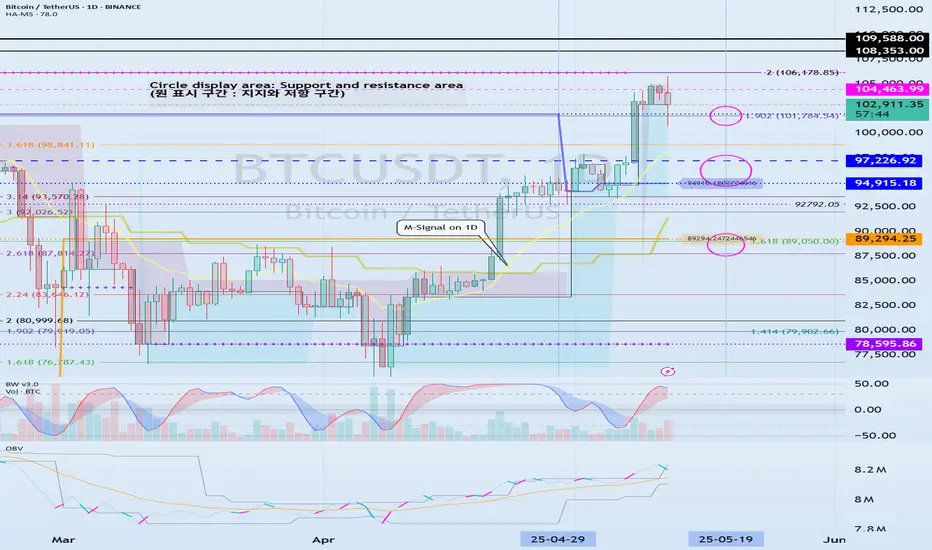
(BTCUSDT 1D chart)
It has touched the Fibonacci ratio 1.902 (101784.54) and is rising.
The key is whether it can receive support near the StochRSI 50 indicator (102971.99) and rise.
If not, it can fall to the 94915.18-97226.92 area.
Since the HA-Low indicator is formed at the 89294.25 point, it is important whether the price can be maintained above that point.
If the StochRSI indicator falls below the overbought range and then rises while moving sideways around the Fibonacci ratio range of 1.902 (101784.54) ~ 2 (106178.85), it is expected to renew the ATH.
Even if it falls more than expected, if it rises along the M-Signal indicator on the 1D chart, it is highly likely to renew the ATH.
----------------------------------------------------------
I will explain the newly added indicators, StochRSI 50, StochRSI 80, and StochRSI 20.
The disadvantage of interpreting the StochRSI indicator added as an auxiliary indicator is that it cannot determine the price movement.
Because of this, when interpreting the StochRSI indicator so far,
- Whether it is in the overbought or oversold zone,
- Whether StochRSI is above or below the 50 point,
we interpreted it as above.
Therefore, we added the price movement to the StochRSI indicator to check the movement more accurately.
-
The StochRSI 50 indicator is literally created when the StochRSI indicator passes the 50 point.
Therefore, we need to think about a response plan based on the price StochRSI 50 indicator.
-
The fact that StochRSI 80 is created means that the StochRSI indicator has risen above 80.
Therefore, in order to continue the upward trend, StochRSI must rise above 80.
If StochRSI 80 is not created and only StochRSI 20 is created, the upward trend will occur when the price is maintained above the StochRSI 50 indicator.
-
The fact that StochRSI 20 was created means that the StochRSI indicator has fallen below 20.
Therefore, in order to continue the downtrend, it must fall below StochRSI 20.
If StochRSI 20 is not created and only StochRSI 80 is created, the downtrend will occur when the price is maintained below the StochRSI 50 indicator.
-
Thank you for reading to the end.
I hope you have a successful trade.
--------------------------------------------------
- This is an explanation of the big picture.
I used TradingView's INDEX chart to check the entire range of BTC.
I rewrote the previous chart to update it by touching the Fibonacci ratio range of 1.902 (101875.70) ~ 2 (106275.10).
(Previous BTCUSD 12M chart)
Looking at the big picture, it seems to have been following a pattern since 2015.
In other words, it is a pattern that maintains a 3-year bull market and faces a 1-year bear market.
Accordingly, the bull market is expected to continue until 2025.
-
(Current BTCUSD 12M chart)
Based on the currently written Fibonacci ratio, it is displayed up to 3.618 (178910.15).
It is expected that it will not fall again below the Fibonacci ratio of 0.618 (44234.54).
(BTCUSDT 12M chart)
I think it is around 42283.58 when looking at the BTCUSDT chart.
-
I will explain it again with the BTCUSD chart.
The Fibonacci ratio ranges marked in the light green boxes, 1.902 (101875.70) ~ 2 (106275.10) and 3 (151166.97) ~ 3.14 (157451.83), are expected to be important support and resistance ranges.
In other words, it seems likely to act as a volume profile range.
Therefore, in order to break through this section upward, I think the point to watch is whether it can rise with support near the Fibonacci ratios of 1.618 (89126.41) and 2.618 (134018.28).
Therefore, the maximum rising section in 2025 is expected to be the 3 (151166.97) ~ 3.14 (157451.83) section.
To do that, we need to look at whether it can rise with support near 2.618 (134018.28).
If it falls after the bull market in 2025, we don't know how far it will fall, but considering the previous decline, we expect it to fall by about -60% to -70%.
So, if the decline starts near the Fibonacci ratio 3.14 (157451.83), it seems likely that it will fall to around Fibonacci 0.618 (44234.54).
I will explain more details when the downtrend starts.
------------------------------------------------------
Breakout trading possible range: 0.4140-0.4424
Hello, traders.
If you "Follow", you can always get new information quickly.
Have a nice day today.
-------------------------------------
(ENAUSDT 1D chart)
The key is whether it can break through the 0.4140-0.4424 range and rise.
It is expected that breakout trading will be possible if the 0.4140-0.4424 range breaks through.
However, it is judged that it is possible to lead to additional rise only if it rises above 0.5082 at once and maintains the price.
Therefore, if breakout trading was not possible, trading is possible if support is confirmed near 0.4140-0.4424.
-
If it rises above 0.5082 and is supported, there is a possibility that it will rise significantly as there is no special resistance zone.
In other words, it seems possible that it will break through 0.7907 and 1.0382.
-
Thank you for reading to the end.
I hope you have a successful trade.
--------------------------------------------------
- Here is an explanation of the big picture.
I used TradingView's INDEX chart to check the entire range of BTC.
I rewrote it to update the previous chart while touching the Fibonacci ratio range of 1.902 (101875.70) ~ 2 (106275.10).
(Previous BTCUSD 12M chart)
Looking at the big picture, it seems that it has been maintaining an upward trend following a pattern since 2015.
That is, it is a pattern that maintains a 3-year uptrend and faces a 1-year downtrend.
Accordingly, the uptrend is expected to continue until 2025.
-
(Current BTCUSD 12M chart)
Based on the currently written Fibonacci ratio, it is displayed up to 3.618 (178910.15).
It is expected that it will not fall again below the Fibonacci ratio of 0.618 (44234.54).
(BTCUSDT 12M chart)
Based on the BTCUSDT chart, I think it is around 42283.58.
-
I will explain it again with the BTCUSD chart.
The Fibonacci ratio ranges marked in the green boxes, 1.902 (101875.70) ~ 2 (106275.10) and 3 (151166.97) ~ 3.14 (157451.83), are expected to be important support and resistance ranges.
In other words, it seems likely that they will act as volume profile ranges.
Therefore, in order to break through these ranges upward, I think the point to watch is whether they can receive support and rise near the Fibonacci ratios of 1.618 (89126.41) and 2.618 (134018.28).
Therefore, the maximum rising range in 2025 is expected to be the 3 (151166.97) ~ 3.14 (157451.83) range.
In order to do that, we need to see if it is supported and rises near 2.618 (134018.28).
If it falls after the bull market in 2025, we don't know how far it will fall, but based on the previous decline, we expect it to fall by about -60% to -70%.
Therefore, if it starts to fall near the Fibonacci ratio 3.14 (157451.83), it seems likely that it will fall to around Fibonacci 0.618 (44234.54).
I will explain more details when the bear market starts.
------------------------------------------------------

Check if it can break through 0.03779-0.04757 at once
Hello, traders.
If you "Follow", you can always get new information quickly.
Have a nice day today.
-------------------------------------
(VETUSDT 1W chart)
Support zone: 0.00440-0.101741
Resistance zone: 0.03779-0.04757
If it breaks through the resistance zone upward and maintains the price, it is expected that a step-by-step uptrend will begin.
Therefore, it is important to check whether there is support around 0.03779-0.04757.
-
(1D chart)
The key is whether it can maintain the price by receiving support near the M-Signal indicator on the 1M chart and rising to around 0.03779.
If it fails to rise, you should check for support near 0.02778.
If it falls below the 0.01741-0.2135 range, you should stop trading and watch the situation.
Therefore, the 0.01741-0.2135 range is an important support range from a short-term perspective.
-
The 0.03779, 0.04757, and 0.06603 points are important points as HA-High indicator points on the 1W, 1M, and 1D charts.
It is expected that a breakout trade will be possible when it breaks through the 0.03779 point, but since an important point is located before it rises much, the point to watch is whether it can maintain the price by rising above 0.04757 at once.
Therefore, when making a breakout trade, check if it rises above 0.04757, and if not, respond.
-
Thank you for reading to the end.
I hope you have a successful trade.
--------------------------------------------------
- This is an explanation of the big picture.
I used TradingView's INDEX chart to check the entire range of BTC.
I rewrote the previous chart to update it by touching the Fibonacci ratio range of 1.902 (101875.70) ~ 2 (106275.10).
(Previous BTCUSD 12M chart)
Looking at the big picture, it seems to have been following a pattern since 2015.
In other words, it is a pattern that maintains a 3-year bull market and faces a 1-year bear market.
Accordingly, the bull market is expected to continue until 2025.
-
(Current BTCUSD 12M chart)
Based on the currently written Fibonacci ratio, it is displayed up to 3.618 (178910.15).
It is expected that it will not fall again below the Fibonacci ratio of 0.618 (44234.54).
(BTCUSDT 12M chart)
I think it is around 42283.58 when looking at the BTCUSDT chart.
-
I will explain it again with the BTCUSD chart.
The Fibonacci ratio ranges marked in the light green boxes, 1.902 (101875.70) ~ 2 (106275.10) and 3 (151166.97) ~ 3.14 (157451.83), are expected to be important support and resistance ranges.
In other words, it seems likely to act as a volume profile range.
Therefore, in order to break through this section upward, I think the point to watch is whether it can rise with support near the Fibonacci ratios of 1.618 (89126.41) and 2.618 (134018.28).
Therefore, the maximum rising section in 2025 is expected to be the 3 (151166.97) ~ 3.14 (157451.83) section.
To do that, we need to look at whether it can rise with support near 2.618 (134018.28).
If it falls after the bull market in 2025, we don't know how far it will fall, but considering the previous decline, we expect it to fall by about -60% to -70%.
So, if the decline starts near the Fibonacci ratio 3.14 (157451.83), it seems likely that it will fall to around Fibonacci 0.618 (44234.54).
I will explain more details when the downtrend starts.
------------------------------------------------------

Support and resistance zone: 0.016987-0.017858
Hello, traders.
If you "Follow", you can always get new information quickly.
Have a nice day today.
-------------------------------------
(1000SHIBUSDT.P 1W chart)
The key is whether the M-Signal indicator on the 1M chart can rise above and maintain the price.
If the price rises above the important zone of 0.021175-0.026744 and maintains, the uptrend is likely to begin.
If it fails to rise, you should check for support near 0.008763.
-
(1D chart)
In order to maintain the price above the M-Signal indicator of the 1M chart, it is important to see if it can rise to the vicinity of 0.016987-0.017858 and receive support.
Since the volume profile section is formed at the point of 0.021175, it is important to see if it can receive support in this section.
If it fails to rise, it is necessary to check for support in the vicinity of 0.012618-0.013489.
-
Since the StochRSI indicator has entered the overbought section, it is expected that the rise will be limited even if it continues to rise further.
Therefore, it is recommended to first check for support in the vicinity of 0.016987-0.017858.
-
Thank you for reading to the end.
I wish you successful trading.
--------------------------------------------------
- Explanation of the big picture.
I used TradingView's INDEX chart to check the entire range of BTC.
I rewrote it to update the previous chart by touching the Fibonacci ratio range of 1.902 (101875.70) ~ 2 (106275.10).
(Previous BTCUSD 12M chart)
Looking at the big picture, it seems to have been maintaining an upward trend following a pattern since 2015.
In other words, it is a pattern that maintains a 3-year upward trend and faces a 1-year downward trend.
Accordingly, the upward trend is expected to continue until 2025.
-
(Current BTCUSD 12M chart)
Based on the currently written Fibonacci ratio, it is displayed up to 3.618 (178910.15).
It is expected that it will not fall again below the Fibonacci ratio of 0.618 (44234.54).
(BTCUSDT 12M chart)
Based on the BTCUSDT chart, I think it is around 42283.58.
-
I will explain it again with the BTCUSD chart.
The Fibonacci ratio ranges marked in the green boxes, 1.902 (101875.70) ~ 2 (106275.10) and 3 (151166.97) ~ 3.14 (157451.83), are expected to be important support and resistance ranges.
In other words, it seems likely that they will act as volume profile ranges.
Therefore, in order to break through these ranges upward, I think the point to watch is whether they can receive support and rise near the Fibonacci ratios of 1.618 (89126.41) and 2.618 (134018.28).
Therefore, the maximum rising range in 2025 is expected to be the 3 (151166.97) ~ 3.14 (157451.83) range.
In order to do that, we need to see if it is supported and rises near 2.618 (134018.28).
If it falls after the bull market in 2025, we don't know how far it will fall, but based on the previous decline, we expect it to fall by about -60% to -70%.
Therefore, if it starts to fall near the Fibonacci ratio 3.14 (157451.83), it seems likely that it will fall to around Fibonacci 0.618 (44234.54).
I will explain more details when the bear market starts.
------------------------------------------------------

Support and Resistance Zone: 2273.58-2359.35
Hello, traders.
If you "Follow", you can always get new information quickly.
Please click "Boost" as well.
Have a nice day today.
-------------------------------------
(ETHUSDT 1M chart)
In order to turn upward on the 1M chart, the price must rise to the Fibonacci ratio range of 0.382 (2674.80) ~ 0.382 (2723.46) and maintain it.
Before that, the key is whether it can rise above the M-Signal indicator on the 1M chart.
-
(1W chart)
The key is whether the price can be maintained and rise above the M-Signal indicator of the 1W chart.
To do so, we need to check whether the price is maintained by rising near the right Fibonacci ratio 0.5 (2295.84).
In order to continue the uptrend in the medium to long term, the price must be maintained above the M-Signal indicator of the 1M chart.
Accordingly, the key is whether the price can rise above the M-Signal indicator of the 1M chart when the price is maintained by rising near the right Fibonacci ratio 0.5 (2295.84).
Therefore, it is expected that a breakout trade will be possible when the right Fibonacci ratio 0.5 (2295.84) is broken upward.
However, since the StochRSI indicator is showing signs of entering the overbought zone, the increase may be limited.
-
(1D chart)
It showed a big rise as it broke through the A section, that is, the 1861.57 point.
In any case, since it is currently below the M-Signal indicator of the 1M chart, we can see that there is still time to buy.
Therefore, as I mentioned earlier, we should focus on finding a buying point when the price rises above the M-Signal indicator of the 1M chart and maintains the price, or when it rises to the Fibonacci ratio range of 0.382 (2674.80) ~ 0.382 (2723.46) and maintains the price.
ETH is in a typical reverse arrangement (M-Signal of the 1M chart > M-Signal of the 1W chart > M-Signal of the 1D chart).
Therefore, we should focus on finding a buying point while watching the situation with a relaxed mind.
If it continues to rise like this,
1st: 2273.58-2359.35
2nd: 2627.18
3rd: 2921.73
We need to check if it can rise with support near the 1st-3rd above.
If not, if it falls, we need to check if it can support near 1861.57.
-
Thank you for reading to the end.
I hope you have a successful trade.
--------------------------------------------------
- This is an explanation of the big picture.
I used TradingView's INDEX chart to check the entire range of BTC.
I rewrote it to update the previous chart while touching the Fibonacci ratio range of 1.902(101875.70) ~ 2(106275.10).
(Previous BTCUSD 12M chart)
Looking at the big picture, it seems to have been following a pattern since 2015.
In other words, it is a pattern that maintains a 3-year bull market and faces a 1-year bear market.
Accordingly, the bull market is expected to continue until 2025.
-
(Current BTCUSD 12M chart)
Based on the currently written Fibonacci ratio, it is displayed up to 3.618 (178910.15).
It is expected that it will not fall again below the Fibonacci ratio of 0.618 (44234.54).
(BTCUSDT 12M chart)
I think it is around 42283.58 when looking at the BTCUSDT chart.
-
I will explain it again with the BTCUSD chart.
The Fibonacci ratio ranges marked in the light green boxes, 1.902 (101875.70) ~ 2 (106275.10) and 3 (151166.97) ~ 3.14 (157451.83), are expected to be important support and resistance ranges.
In other words, it seems likely to act as a volume profile range.
Therefore, in order to break through this section upward, I think the point to watch is whether it can rise with support near the Fibonacci ratios of 1.618 (89126.41) and 2.618 (134018.28).
Therefore, the maximum rising section in 2025 is expected to be the 3 (151166.97) ~ 3.14 (157451.83) section.
To do that, we need to look at whether it can rise with support near 2.618 (134018.28).
If it falls after the bull market in 2025, we don't know how far it will fall, but considering the previous decline, we expect it to fall by about -60% to -70%.
So, if the decline starts near the Fibonacci ratio 3.14 (157451.83), it seems likely that it will fall to around Fibonacci 0.618 (44234.54).
I will explain more details when the downtrend starts.
------------------------------------------------------

3-year bull market, 1-year bear market pattern
Hello, traders.
If you "Follow", you can always get new information quickly.
Please click "Boost" as well.
Have a nice day today.
-------------------------------------
(BTCUSDT 12M chart)
It has been showing a pattern of 3-year bull market and 1-year bear market since 2015.
If this pattern continues, it is expected that 2025 will be the last bull market.
2015-2017: Up about 12124%
2019-2021: Up about 1971%
In the uptrend that started in 2023, the maximum uptrend point is expected to be around the Fibonacci ratio 3.618 (178910.15).
Before that, we need to see if the price can be maintained by rising above the Fibonacci ratio 2.168 (134018.28).
Since the increase is showing a sharp decrease in the increase as the price rises, I think the increase in 2025 is likely to be not that great.
-
(BTCUSDT 12M chart)
If we look at this on the BTCUSDT chart, it is the same as the chart above.
We will have to see the movement when the downtrend starts, but the current expected range is expected to be around 69K.
It is expected that the price range below 42K will never be seen again.
-
Thank you for reading to the end.
I hope you have a successful trade.
--------------------------------------------------
- Here is an explanation of the big picture.
I used TradingView's INDEX chart to check the entire range of BTC.
I rewrote it to update the previous chart while touching the Fibonacci ratio range of 1.902 (101875.70) ~ 2 (106275.10).
(Previous BTCUSD 12M chart)
Looking at the big picture, it seems to have been maintaining an upward trend following a pattern since 2015.
In other words, it is a pattern that maintains a 3-year uptrend and faces a 1-year downtrend.
Accordingly, the upward trend is expected to continue until 2025.
-
(Current BTCUSD 12M chart)
Based on the currently written Fibonacci ratio, it is displayed up to 3.618 (178910.15).
It is expected that it will not fall again below the Fibonacci ratio of 0.618 (44234.54).
(BTCUSDT 12M chart)
Based on the BTCUSDT chart, I think it is around 42283.58.
-
I will explain it again with the BTCUSD chart.
The Fibonacci ratio ranges marked in the green boxes, 1.902 (101875.70) ~ 2 (106275.10) and 3 (151166.97) ~ 3.14 (157451.83), are expected to be important support and resistance ranges.
In other words, it seems likely that they will act as volume profile ranges.
Therefore, in order to break through these ranges upward, I think the point to watch is whether they can receive support and rise near the Fibonacci ratios of 1.618 (89126.41) and 2.618 (134018.28).
Therefore, the maximum rising range in 2025 is expected to be the 3 (151166.97) ~ 3.14 (157451.83) range.
In order to do that, we need to see if it is supported and rises near 2.618 (134018.28).
If it falls after the bull market in 2025, we don't know how far it will fall, but based on the previous decline, we expect it to fall by about -60% to -70%.
Therefore, if it starts to fall near the Fibonacci ratio 3.14 (157451.83), it seems likely that it will fall to around Fibonacci 0.618 (44234.54).
I will explain more details when the bear market starts.
------------------------------------------------------

Important Point: 1.0113
Hello, traders.
If you "Follow", you can always get new information quickly.
Have a nice day today.
-------------------------------------
(ONDOUSDT.P 1D chart)
The 1.0113 point is the HA-Low indicator point on the 1D chart.
Therefore, if it is supported near 1.0113, it is a time to buy.
If it is supported at the 1.0113 point and rises,
1st: 1.2715
2nd: 1.8588
You need to respond depending on whether there is support near the 1st and 2nd above.
-
If it fails to receive support at the 1.0113 point, you need to check whether there is support near 0.8292.
The support zone is around 0.5911.
-
The location of the 1.0113 point is a point where a breakout trade is possible.
However, caution is required because the StochRSI indicator is showing signs of entering the overbought zone.
Therefore, it is recommended to check the support near 1.0113 and then decide on the trading point.
-
(30m chart)
As seen in the 30m chart, it is currently located near the HA-High indicator.
In other words, it is showing a stepwise upward trend.
The indicators that play an important role in finding trading strategies and trading points are the HA-Low and HA-High indicators.
Therefore, when it is supported by the HA-High indicator and rises, it is necessary to aggressively buy and respond quickly with the thought that it can fall at any time.
-
Thank you for reading to the end.
I hope you have a successful trade.
--------------------------------------------------
- Explanation of the big picture.
I used TradingView's INDEX chart to check the entire range of BTC.
I rewrote it to update the previous chart by touching the Fibonacci ratio range of 1.902(101875.70) ~ 2(106275.10).
(Previous BTCUSD 12M chart)
Looking at the big picture, it seems to have been maintaining an upward trend following a pattern since 2015.
In other words, it is a pattern that maintains a 3-year uptrend and faces a 1-year downtrend.
Accordingly, the uptrend is expected to continue until 2025.
-
(Current BTCUSD 12M chart)
Based on the currently written Fibonacci ratio, it is displayed up to 3.618 (178910.15).
It is expected that it will not fall again below the Fibonacci ratio of 0.618 (44234.54).
(BTCUSDT 12M chart)
Based on the BTCUSDT chart, I think it is around 42283.58.
-
I will explain it again with the BTCUSD chart.
The Fibonacci ratio ranges marked in the green boxes, 1.902 (101875.70) ~ 2 (106275.10) and 3 (151166.97) ~ 3.14 (157451.83), are expected to be important support and resistance ranges.
In other words, it seems likely that they will act as volume profile ranges.
Therefore, in order to break through these ranges upward, I think the point to watch is whether they can receive support and rise near the Fibonacci ratios of 1.618 (89126.41) and 2.618 (134018.28).
Therefore, the maximum rising range in 2025 is expected to be the 3 (151166.97) ~ 3.14 (157451.83) range.
In order to do that, we need to see if it is supported and rises near 2.618 (134018.28).
If it falls after the bull market in 2025, we don't know how far it will fall, but based on the previous decline, we expect it to fall by about -60% to -70%.
Therefore, if it starts to fall near the Fibonacci ratio 3.14 (157451.83), it seems likely that it will fall to around Fibonacci 0.618 (44234.54).
I will explain more details when the bear market starts.
------------------------------------------------------

Important Point: 0.00001271
Hello, traders.
If you "Follow", you can always get new information quickly.
Have a nice day today.
-------------------------------------
(PEPEUSDT 1D chart)
The 0.00001271 point is the HA-High indicator point on the 1M chart.
Accordingly, the key is whether it can receive support near 0.00001271 and rise.
If it fails to rise, it is possible to re-determine the trend by touching the M-Signal indicator on the 1W chart.
The support area is near 0.00000723.
-
If it is supported and rises near 0.00001271, it is necessary to respond depending on whether there is support near 0.00001898-0.00002244.
-
I think the 0.00001271 point is a point where a breakout trade is possible.
However, caution is required because the StochRSI indicator is showing signs of entering the overbought zone.
Therefore, I think it is better to check for support rather than a breakout trade.
-
Thank you for reading to the end.
I hope you have a successful trade.
--------------------------------------------------
- This is an explanation of the big picture.
I used TradingView's INDEX chart to check the entire range of BTC.
I rewrote the previous chart to update it while touching the Fibonacci ratio range of 1.902 (101875.70) ~ 2 (106275.10).
(Previous BTCUSD 12M chart)
Looking at the big picture, it seems to have been following a pattern since 2015.
In other words, it is a pattern that maintains a 3-year bull market and faces a 1-year bear market.
Accordingly, the bull market is expected to continue until 2025.
-
(Current BTCUSD 12M chart)
Based on the currently written Fibonacci ratio, it is displayed up to 3.618 (178910.15).
It is expected that it will not fall again below the Fibonacci ratio of 0.618 (44234.54).
(BTCUSDT 12M chart)
I think it is around 42283.58 when looking at the BTCUSDT chart.
-
I will explain it again with the BTCUSD chart.
The Fibonacci ratio ranges marked in the light green boxes, 1.902 (101875.70) ~ 2 (106275.10) and 3 (151166.97) ~ 3.14 (157451.83), are expected to be important support and resistance ranges.
In other words, it seems likely to act as a volume profile range.
Therefore, in order to break through this section upward, I think the point to watch is whether it can rise with support near the Fibonacci ratios of 1.618 (89126.41) and 2.618 (134018.28).
Therefore, the maximum rising section in 2025 is expected to be the 3 (151166.97) ~ 3.14 (157451.83) section.
To do that, we need to look at whether it can rise with support near 2.618 (134018.28).
If it falls after the bull market in 2025, we don't know how far it will fall, but considering the previous decline, we expect it to fall by about -60% to -70%.
So, if the decline starts near the Fibonacci ratio 3.14 (157451.83), it seems likely that it will fall to around Fibonacci 0.618 (44234.54).
I will explain more details when the downtrend starts.
------------------------------------------------------

Whether it can be supported and rise at 102429.56 is the key
Hello, traders.
If you "Follow", you can always get new information quickly.
Please also click "Boost".
Have a nice day today.
-------------------------------------
(USDT.D 1M chart)
If USDT dominance is maintained below 4.97 or continues to decline, the coin market is likely to enter an upward trend.
(BTC.D 1M chart)
However, I think that for the altcoin bull market to begin, BTC dominance must be maintained below 55.01 or continue to decline.
If USDT dominance falls and BTC dominance rises, most altcoins are likely to gradually move sideways or show a downward trend.
In other words, it is highly likely that only BTC will continue to rise.
-----------------------------------------
(BTCUSDT 1M chart)
Based on the current position, in order to continue the uptrend, the price must be maintained above the Fibonacci ratio of 1.902 (101784.54).
If not, it is likely to fall to around the Fibonacci ratio of 1.618 (89050.0).
If the uptrend continues, the point to watch is whether it can renew the new high (ATH) this time.
-
(1W chart)
It is rising after touching the 73499.86 area.
It is showing a large increase as it breaks through the HA-High indicator point of 97226.92 on the 1W chart.
Since the StochRSI indicator is expected to enter the overbought zone, it is highly likely that the future rise will be limited.
Therefore, the key is whether the price can be maintained above the left Fibonacci ratio of 1.902 (101784.54).
If it falls, you should check whether it is supported near 97226.92.
If it falls below 97226.92, you should check whether it is supported in the 1st and 2nd sections marked on the chart.
You should check where the StochRSI 80 indicator is formed when the next candle is created.
The StochRSI 80 indicator on the 1M chart is formed at the 102429.56 point.
Therefore, we need to check whether the StochRSI 80 indicator point on the 1W chart is formed around the 102429.56 point.
-
(1D chart)
Since the StochRSI indicator on the 1D chart is located below the midpoint, we need to focus on finding a buying point.
With this rise, the StochRSI indicator is expected to rise above the midpoint.
If the StochRSI indicator is located above the midpoint, we need to focus on finding a selling point.
Therefore, the point of interest is whether the price can be maintained around the right Fibonacci ratio 1.902 (101784.54) as we pass through the next volatility period around May 19.
-
Among the interpretation methods of the OBV indicator, there is an interpretation method that there is a possibility of an increase or decrease when the previous high or low is broken.
This time, it showed an upward break through the upper line of the OBV and broke through the lower line of the previous OBV.
In other words, it showed an upward break through the A section.
If this upward break through the B section is continued, it is expected to renew the ATH.
-
Thank you for reading to the end.
I hope you have a successful transaction.
--------------------------------------------------
- This is an explanation of the big picture.
I used TradingView's INDEX chart to check the entire section of BTC.
I rewrote the previous chart to update it by touching the Fibonacci ratio section of 1.902 (101875.70) ~ 2 (106275.10).
(Previous BTCUSD 12M chart)
Looking at the big picture, it seems to have been following a pattern since 2015.
In other words, it is a pattern that maintains a 3-year bull market and faces a 1-year bear market.
Accordingly, the bull market is expected to continue until 2025.
-
(Current BTCUSD 12M chart)
Based on the currently written Fibonacci ratio, it is displayed up to 3.618 (178910.15).
It is expected that it will not fall again below the Fibonacci ratio of 0.618 (44234.54).
(BTCUSDT 12M chart)
I think it is around 42283.58 when looking at the BTCUSDT chart.
-
I will explain it again with the BTCUSD chart.
The Fibonacci ratio ranges marked in the light green boxes, 1.902 (101875.70) ~ 2 (106275.10) and 3 (151166.97) ~ 3.14 (157451.83), are expected to be important support and resistance ranges.
In other words, it seems likely to act as a volume profile range.
Therefore, in order to break through this section upward, I think the point to watch is whether it can rise with support near the Fibonacci ratios of 1.618 (89126.41) and 2.618 (134018.28).
Therefore, the maximum rising section in 2025 is expected to be the 3 (151166.97) ~ 3.14 (157451.83) section.
To do that, we need to look at whether it can rise with support near 2.618 (134018.28).
If it falls after the bull market in 2025, we don't know how far it will fall, but considering the previous decline, we expect it to fall by about -60% to -70%.
So, if the decline starts near the Fibonacci ratio 3.14 (157451.83), it seems likely that it will fall to around Fibonacci 0.618 (44234.54).
I will explain more details when the downtrend starts.
------------------------------------------------------

Mid-term uptrend starts: 333.5-348.2 or higher
Hello, traders.
If you "Follow", you can always get new information quickly.
Please click "Boost" as well.
Have a nice day today.
-------------------------------------
(BCHUSDT 1D chart)
The M-Signal indicators on the 1M, 1W, and 1D charts are showing an upward trend in a convergent state.
Accordingly, if the price is maintained above 333.5-348.2, it is expected to continue the uptrend in the mid- to long-term.
If the uptrend continues,
1st: 473.4-480.4
2nd: 590.6
You should respond depending on whether there is support near the 1st and 2nd above.
If it falls below 333.5, you should check if it is supported around 294.6.
-
Thank you for reading to the end.
I hope you have a successful trade.
--------------------------------------------------
- Here is an explanation of the big picture.
I used TradingView's INDEX chart to check the entire range of BTC.
I rewrote it to update the previous chart while touching the Fibonacci ratio range of 1.902 (101875.70) ~ 2 (106275.10).
(Previous BTCUSD 12M chart)
Looking at the big picture, it seems to have been maintaining an upward trend following a pattern since 2015.
In other words, it is a pattern that maintains a 3-year bull market and faces a 1-year bear market.
Accordingly, the bull market is expected to continue until 2025.
-
(Current BTCUSD 12M chart)
Based on the currently written Fibonacci ratio, it is displayed up to 3.618 (178910.15).
It is expected that it will not fall again below the Fibonacci ratio of 0.618 (44234.54).
(BTCUSDT 12M chart)
Based on the BTCUSDT chart, I think it is around 42283.58.
-
I will explain it again with the BTCUSD chart.
The Fibonacci ratio ranges marked in the green boxes, 1.902 (101875.70) ~ 2 (106275.10) and 3 (151166.97) ~ 3.14 (157451.83), are expected to be important support and resistance ranges.
In other words, it seems likely that they will act as volume profile ranges.
Therefore, in order to break through these ranges upward, I think the point to watch is whether they can receive support and rise near the Fibonacci ratios of 1.618 (89126.41) and 2.618 (134018.28).
Therefore, the maximum rising range in 2025 is expected to be the 3 (151166.97) ~ 3.14 (157451.83) range.
In order to do that, we need to see if it is supported and rises near 2.618 (134018.28).
If it falls after the bull market in 2025, we don't know how far it will fall, but based on the previous decline, we expect it to fall by about -60% to -70%.
Therefore, if it starts to fall near the Fibonacci ratio 3.14 (157451.83), it seems likely that it will fall to around Fibonacci 0.618 (44234.54).
I will explain more details when the bear market starts.
------------------------------------------------------

Support and Resistance Zone: 42.19-44.57
Hello, traders.
If you "Follow", you can always get new information quickly.
Please click "Boost" as well.
Have a nice day today.
-------------------------------------
(ZECUSDT 1D chart)
The key is whether the price can be maintained above the M-Signal indicator on the 1M chart.
To do that, we need to see if we can get support around 42.19-44.57.
-
If the price is maintained above the M-Signal indicator on the 1M chart,
1st: 49.89
2nd: 70.62-73.20
We need to respond depending on whether there is support around the 1st and 2nd above.
-
If it goes down, you should check for support around 32.27-33.18.
-
If the price stays above the M-Signal indicator on the 1M chart, it is likely to continue to rise in the medium to long term, so the movement from the current position is important.
Therefore, if you want to trade ZEC, you should focus on the current movement.
-
Thank you for reading to the end.
I hope you have a successful trade.
--------------------------------------------------
- This is an explanation of the big picture.
I used TradingView's INDEX chart to check the entire range of BTC.
I rewrote the previous chart to update it while touching the Fibonacci ratio range of 1.902(101875.70) ~ 2(106275.10).
(Previous BTCUSD 12M chart)
Looking at the big picture, it seems to have been following a pattern since 2015.
In other words, it is a pattern that maintains a 3-year bull market and faces a 1-year bear market.
Accordingly, the bull market is expected to continue until 2025.
-
(Current BTCUSD 12M chart)
Based on the currently written Fibonacci ratio, it is displayed up to 3.618 (178910.15).
It is expected that it will not fall again below the Fibonacci ratio of 0.618 (44234.54).
(BTCUSDT 12M chart)
I think it is around 42283.58 when looking at the BTCUSDT chart.
-
I will explain it again with the BTCUSD chart.
The Fibonacci ratio ranges marked in the light green boxes, 1.902 (101875.70) ~ 2 (106275.10) and 3 (151166.97) ~ 3.14 (157451.83), are expected to be important support and resistance ranges.
In other words, it seems likely to act as a volume profile range.
Therefore, in order to break through this section upward, I think the point to watch is whether it can rise with support near the Fibonacci ratios of 1.618 (89126.41) and 2.618 (134018.28).
Therefore, the maximum rising section in 2025 is expected to be the 3 (151166.97) ~ 3.14 (157451.83) section.
To do that, we need to look at whether it can rise with support near 2.618 (134018.28).
If it falls after the bull market in 2025, we don't know how far it will fall, but considering the previous decline, we expect it to fall by about -60% to -70%.
So, if the decline starts near the Fibonacci ratio 3.14 (157451.83), it seems likely that it will fall to around Fibonacci 0.618 (44234.54).
I will explain more details when the downtrend starts.
------------------------------------------------------

The key is whether it can be supported and rise near 0.8033
Hello, traders.
If you "Follow", you can always get new information quickly.
Please click "Boost" as well.
Have a nice day today.
-------------------------------------
(EOSUSDT 1D chart)
The 0.8033 point is the HA-High indicator point on the 1W chart.
The M-Signal indicator on the 1M chart is passing near this point.
Accordingly, the key is whether it can be supported and rise near 0.8033.
If the price is maintained above the M-Signal indicator on the 1M chart, it is highly likely that the upward trend will continue in the medium to long term.
-
I think the 0.8033 point is a possible point for a breakout trade.
The next possible point for a breakout trade is the 1.3193 point.
-
If it is supported and rises near 0.8033, you should respond depending on whether there is support near 1.0044-1.100.
-
If it falls from the 0.8033 point,
1st: 0.6678-0.6920
2nd: 0.5255-0.5820
You should check whether there is support near the 1st and 2nd points above.
-
Thank you for reading to the end.
I hope you have a successful trade.
--------------------------------------------------
- This is an explanation of the big picture.
I used TradingView's INDEX chart to check the entire range of BTC.
I rewrote the previous chart to update it by touching the Fibonacci ratio range of 1.902 (101875.70) ~ 2 (106275.10).
(Previous BTCUSD 12M chart)
Looking at the big picture, it seems to have been following a pattern since 2015 and has been rising.
In other words, it is a pattern that maintains a 3-year uptrend and faces a 1-year downtrend.
Accordingly, the uptrend is expected to continue until 2025.
-
(Current BTCUSD 12M chart)
Based on the currently written Fibonacci ratio, it shows up to 3.618 (178910.15).
Fibonacci ratio 0.618 (44234.54) is not expected to fall again.
(BTCUSDT 12M chart)
I think it is around 42283.58 when looking at the BTCUSDT chart.
-
I will explain it again with the BTCUSD chart.
The Fibonacci ratio ranges marked in the light green boxes, 1.902 (101875.70) ~ 2 (106275.10) and 3 (151166.97) ~ 3.14 (157451.83), are expected to be important support and resistance ranges.
In other words, it seems likely to act as a volume profile range.
Therefore, in order to break through this section upward, I think the point to watch is whether it can rise with support near the Fibonacci ratios of 1.618 (89126.41) and 2.618 (134018.28).
Therefore, the maximum rising section in 2025 is expected to be the 3 (151166.97) ~ 3.14 (157451.83) section.
To do that, we need to look at whether it can rise with support near 2.618 (134018.28).
If it falls after the bull market in 2025, we don't know how far it will fall, but considering the previous decline, we expect it to fall by about -60% to -70%.
So, if the decline starts near the Fibonacci ratio 3.14 (157451.83), it seems likely that it will fall to around Fibonacci 0.618 (44234.54).
I will explain more details when the downtrend starts.
------------------------------------------------------

Trading Strategy and CEX Screen
Hello, traders.
If you "Follow", you can always get new information quickly.
Please click "Boost" as well.
Have a nice day today.
-------------------------------------
CEX(Centralized Exchange): Centralized Exchange
DEX(Decentralized Exchange): Decentralized Exchange
As coin futures trading becomes active, I think they started classifying the coin futures charts of CEX exchanges.
-
Tradingview supports various screeners.
There are several screeners in the menu at the bottom, so check them out.
-
As the coin market grows, it is being classified into various themes.
I think this movement means that it is evolving into a form similar to the existing stock market.
If this classification continues to be segmented, it is likely that individual investors will eventually find it increasingly difficult to make profits.
Therefore, in order to adapt to these changes, your investment style, that is, your trading strategy, must be clear.
The trading strategy must be clear on 1. Investment period, 2. Investment size, 3. Trading method and profit realization method.
The above 1-3 must be clear.
You must classify the coin (token) you want to trade by investment period, and determine the investment size according to the investment period.
And, you must proceed with the transaction by determining the trading method and profit realization method accordingly.
-
To create a trading method, you must check whether there is support near the HA-Low and HA-High indicators and create a trading method accordingly.
Basically, when the HA-Low indicator rises, it is a buying period, and when the HA-High indicator is met, it is a selling period.
In most cases, trading occurs in the HA-Low ~ HA-High indicator range as above.
If it is supported by the HA-High indicator and rises, it will show a stepwise upward trend, and if it is resisted by the HA-Low indicator and falls, it will show a stepwise downward trend.
-
If you can trade in decimals like the coin market, you can set a different profit realization method.
Basically, you will sell the number of coins (tokens) you purchased and earn cash profits.
However, if you can trade in decimals, you can increase the number of coins (tokens) by selling the amount of the purchase principal.
In this way, you can increase the number of coins (tokens) corresponding to the profit and earn large profits in the mid- to long-term.
You can decide whether to earn cash profits right now or increase the number of coins (tokens) for the future depending on your investment style.
For example, I think it is a good idea to increase the number of coins (tokens) corresponding to the profit for coins (tokens) that can be held for the long term, such as BTC and ETH.
Therefore, you should think about which coin (token) to hold for the long term and decide on the profit realization method accordingly.
This method can reduce the pressure on funds even if the trading period is long because the investment money is rotated.
-
Thank you for reading to the end.
I hope you have a successful transaction.
--------------------------------------------------

Check if it can rise above 0.1135
Hello, traders.
If you "Follow", you can always get new information quickly.
Please also click "Boost".
Have a nice day today.
-------------------------------------
(ICXUSDT 1D chart)
In order for a medium- to long-term uptrend to begin, the price must be maintained above the M-Signal indicator on the 1M chart.
Therefore, if you want to trade ICX, you should take your time and look at the situation.
-
If it rises to around 0.1135 and maintains the price, there is a possibility that a short-term uptrend will begin.
Therefore, in order to start an aggressive trade, you should check the support around 0.1135.
-
The HA-Low indicator of the 1D chart is formed at 0.0832,
the HA-Low indicator of the 1W chart is formed at 0.1602,
and the HA-Low indicator of the 1M chart is formed at 0.1976.
Ultimately, it is highly likely that the upward trend will start if the price rises above 0.1976 and maintains.
It is difficult to conduct day trading or short-term trading.
-
Thank you for reading to the end.
I hope you have a successful transaction.
--------------------------------------------------
- This is an explanation of the big picture.
I used TradingView's INDEX chart to check the entire range of BTC.
I rewrote the previous chart to update it by touching the Fibonacci ratio range of 1.902(101875.70) ~ 2(106275.10).
(Previous BTCUSD 12M chart)
Looking at the big picture, it seems to have been following a pattern since 2015.
In other words, it is a pattern that maintains a 3-year bull market and faces a 1-year bear market.
Accordingly, the bull market is expected to continue until 2025.
-
(Current BTCUSD 12M chart)
Based on the currently written Fibonacci ratio, it is displayed up to 3.618 (178910.15).
It is expected that it will not fall again below the Fibonacci ratio of 0.618 (44234.54).
(BTCUSDT 12M chart)
I think it is around 42283.58 when looking at the BTCUSDT chart.
-
I will explain it again with the BTCUSD chart.
The Fibonacci ratio ranges marked in the light green boxes, 1.902 (101875.70) ~ 2 (106275.10) and 3 (151166.97) ~ 3.14 (157451.83), are expected to be important support and resistance ranges.
In other words, it seems likely to act as a volume profile range.
Therefore, in order to break through this section upward, I think the point to watch is whether it can rise with support near the Fibonacci ratios of 1.618 (89126.41) and 2.618 (134018.28).
Therefore, the maximum rising section in 2025 is expected to be the 3 (151166.97) ~ 3.14 (157451.83) section.
To do that, we need to look at whether it can rise with support near 2.618 (134018.28).
If it falls after the bull market in 2025, we don't know how far it will fall, but considering the previous decline, we expect it to fall by about -60% to -70%.
So, if the decline starts near the Fibonacci ratio 3.14 (157451.83), it seems likely that it will fall to around Fibonacci 0.618 (44234.54).
I will explain more details when the downtrend starts.
------------------------------------------------------

The key is whether there is support near 95.73
Hello, traders.
If you "Follow", you can always get new information quickly.
Please also click "Boost".
Have a nice day today.
-------------------------------------
(LTCUSDT 1D chart)
The key is whether the price can be maintained above the M-Signal indicator on the 1M chart.
Accordingly, the key is whether there is support near 95.73.
If it fails to rise, you should check whether there is support near 79.84.
In order for the stepwise uptrend to begin, it is likely to start by rising above 113.39.
If you are trading LTC, you should check whether there is support near 95.73 and create a trading strategy.
-
Thank you for reading to the end.
I hope you have a successful trade.
--------------------------------------------------
- Here is an explanation of the big picture.
I used TradingView's INDEX chart to check the entire range of BTC.
I rewrote it to update the previous chart while touching the Fibonacci ratio range of 1.902(101875.70) ~ 2(106275.10).
(Previous BTCUSD 12M chart)
Looking at the big picture, it seems to have been following a pattern since 2015.
In other words, it is a pattern that maintains a 3-year bull market and faces a 1-year bear market.
Accordingly, the bull market is expected to continue until 2025.
-
(Current BTCUSD 12M chart)
Based on the currently written Fibonacci ratio, it is displayed up to 3.618 (178910.15).
It is expected that it will not fall again below the Fibonacci ratio of 0.618 (44234.54).
(BTCUSDT 12M chart)
Based on the BTCUSDT chart, I think it is around 42283.58.
-
I will explain it again with the BTCUSD chart.
The Fibonacci ratio ranges marked in the green boxes, 1.902 (101875.70) ~ 2 (106275.10) and 3 (151166.97) ~ 3.14 (157451.83), are expected to be important support and resistance ranges.
In other words, it seems likely that they will act as volume profile ranges.
Therefore, in order to break through these ranges upward, I think the point to watch is whether they can receive support and rise near the Fibonacci ratios of 1.618 (89126.41) and 2.618 (134018.28).
Therefore, the maximum rising range in 2025 is expected to be the 3 (151166.97) ~ 3.14 (157451.83) range.
In order to do that, we need to see if it is supported and rises near 2.618 (134018.28).
If it falls after the bull market in 2025, we don't know how far it will fall, but based on the previous decline, we expect it to fall by about -60% to -70%.
Therefore, if it starts to fall near the Fibonacci ratio 3.14 (157451.83), it seems likely that it will fall to around Fibonacci 0.618 (44234.54).
I will explain more details when the bear market starts.
------------------------------------------------------

Breakout trading point: 1861.57
Hello, traders.
If you "Follow", you can always get new information quickly.
Please click "Boost" as well.
Have a nice day today.
-------------------------------------
(ETHUSDT 1D chart)
The 1861.57 point is the HA-Low indicator point on the 1W chart.
The key is whether it can receive support and rise around the A section, that is, 1861.57.
Since the HA-Low indicator on the 1D chart is formed at the 1647.06 point, it is important whether it can receive support and rise in the 1647.06-1861.57 section.
If it shows support in the 1647.06-1861.57 section, it is a time to buy.
-
If it falls from 1647.06, there is a possibility that a stepwise downtrend will continue, so you should also consider a response plan for this.
In the case of a decline, the Fibonacci ratio section of 0 (1190.57) ~ 0.786 (1259.39) is expected to be an important support and resistance section.
-
Since the price is located below the M-Signal indicator on the 1M chart, it is recommended to conduct trading from a day trading or short-term trading perspective.
When it breaks through the 1861.57 point, a breakout trade is possible, but as I mentioned earlier, trading requires a short and quick response.
-
If the StochRSI indicator is above the midpoint, it is recommended to focus on finding a time to sell, and if it is below the midpoint, it is recommended to focus on finding a time to buy.
When creating a trading strategy by referring to the movement of these auxiliary indicators, you must check whether there is support at the support and resistance points drawn on the 1M, 1W, and 1D charts.
-
Thank you for reading to the end.
I hope you have a successful trade.
--------------------------------------------------
- Here is an explanation of the big picture.
I used TradingView's INDEX chart to check the entire range of BTC.
I rewrote the previous chart to update it while touching the Fibonacci ratio range of 1.902 (101875.70) ~ 2 (106275.10).
(Previous BTCUSD 12M chart)
Looking at the big picture, it seems to have been maintaining an upward trend following a pattern since 2015.
In other words, it is a pattern that maintains a 3-year bull market and faces a 1-year bear market.
Accordingly, the upward trend is expected to continue until 2025.
-
(Current BTCUSD 12M chart)
Based on the currently written Fibonacci ratio, it is displayed up to 3.618 (178910.15).
It is expected that it will not fall again below the Fibonacci ratio of 0.618 (44234.54).
(BTCUSDT 12M chart)
Based on the BTCUSDT chart, I think it is around 42283.58.
-
I will explain it again with the BTCUSD chart.
The Fibonacci ratio ranges marked in the green boxes, 1.902 (101875.70) ~ 2 (106275.10) and 3 (151166.97) ~ 3.14 (157451.83), are expected to be important support and resistance ranges.
In other words, it seems likely that they will act as volume profile ranges.
Therefore, in order to break through these ranges upward, I think the point to watch is whether they can receive support and rise near the Fibonacci ratios of 1.618 (89126.41) and 2.618 (134018.28).
Therefore, the maximum rising range in 2025 is expected to be the 3 (151166.97) ~ 3.14 (157451.83) range.
In order to do that, we need to see if it is supported and rises near 2.618 (134018.28).
If it falls after the bull market in 2025, we don't know how far it will fall, but based on the previous decline, we expect it to fall by about -60% to -70%.
Therefore, if it starts to fall near the Fibonacci ratio 3.14 (157451.83), it seems likely that it will fall to around Fibonacci 0.618 (44234.54).
I will explain more details when the bear market starts.
------------------------------------------------------

Check if it can rise along the rising channel
Hello, traders.
If you "Follow", you can always get new information quickly.
Please click "Boost" as well.
Have a nice day today.
-------------------------------------
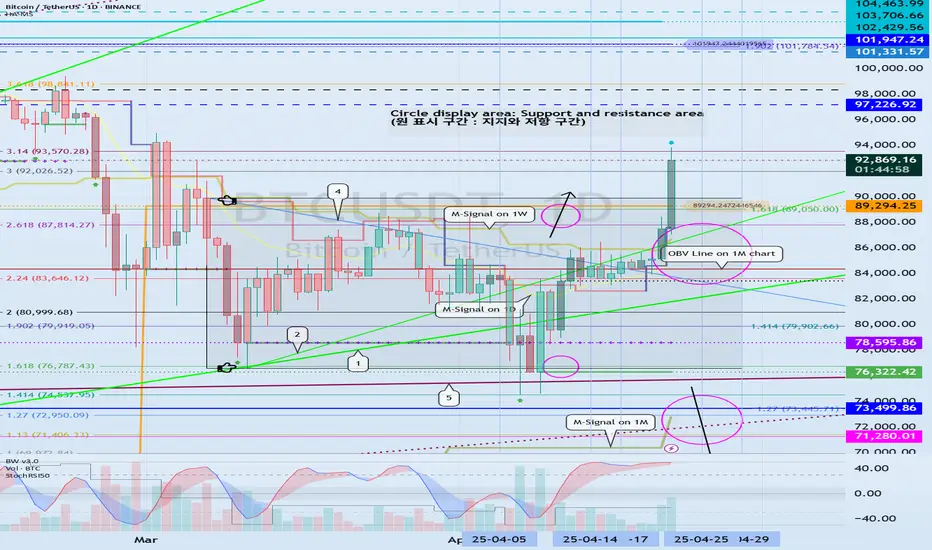
(BTCUSDT 1D chart)
This volatility period is until April 30th.
The point to watch is whether it can rise along the newly created trend line (4) or whether it can rise along the rising channel consisting of trend lines (2) ~ (4).
-
If it falls near Fibonacci 3.14 (93570.28), it seems likely that a new HA-High indicator on the 1D chart will be created.
Accordingly, if the HA-High indicator is created, the key is whether there is support near it.
That is, we need to check whether there is support near the Fibonacci ratio range of 3 (92026.52) ~ 3.14 (93570.28).
If not, there is a possibility of a decline near the trend line (2).
-
The next volatility period is around May 19.
-
Thank you for reading to the end.
I hope you have a successful trade.
--------------------------------------------------
- Here is an explanation of the big picture.
I used TradingView's INDEX chart to check the entire range of BTC.
I rewrote the previous chart to update it while touching the Fibonacci ratio range of 1.902 (101875.70) ~ 2 (106275.10).
(Previous BTCUSD 12M chart)
Looking at the big picture, it seems to have been following a pattern since 2015.
In other words, it is a pattern that maintains a 3-year bull market and faces a 1-year bear market.
Accordingly, the bull market is expected to continue until 2025.
-
(Current BTCUSD 12M chart)
Based on the currently written Fibonacci ratio, it is displayed up to 3.618 (178910.15).
It is expected that it will not fall again below the Fibonacci ratio of 0.618 (44234.54).
(BTCUSDT 12M chart)
I think it is around 42283.58 when looking at the BTCUSDT chart.
-
I will explain it again with the BTCUSD chart.
The Fibonacci ratio ranges marked in the light green boxes, 1.902 (101875.70) ~ 2 (106275.10) and 3 (151166.97) ~ 3.14 (157451.83), are expected to be important support and resistance ranges.
In other words, it seems likely to act as a volume profile range.
Therefore, in order to break through this section upward, I think the point to watch is whether it can rise with support near the Fibonacci ratios of 1.618 (89126.41) and 2.618 (134018.28).
Therefore, the maximum rising section in 2025 is expected to be the 3 (151166.97) ~ 3.14 (157451.83) section.
To do that, we need to look at whether it can rise with support near 2.618 (134018.28).
If it falls after the bull market in 2025, we don't know how far it will fall, but considering the previous decline, we expect it to fall by about -60% to -70%.
So, if the decline starts near the Fibonacci ratio 3.14 (157451.83), it seems likely that it will fall to around Fibonacci 0.618 (44234.54).
I will explain more details when the downtrend starts.
------------------------------------------------------

Support around 148.18 is important
Hello, traders.
If you "Follow", you can always get new information quickly.
Please click "Boost" as well.
Have a nice day today.
-------------------------------------
(SOLUSDT 1D chart)
The OBV Line indicator on the 1M chart is formed at the 148.18 point.
Therefore, the key is whether it can be supported around 148.18 and rise above the M-Signal indicator on the 1W chart.
If not, and it falls, you should check whether it is supported near the M-Signal indicator on the 1M chart.
-
Since the M-Signal indicators of the 1D, 1W, and 1M charts are converging, I think the current location is an important support and resistance zone.
-
If it continues to rise, there is a possibility that it will touch the HA-High indicator point of the 1D chart, which is around 225.0.
However, since the HA-High indicator of the 1M chart is formed at the 179.74 point, we need to see if it can break through this area upward.
-
Since the StochRSI indicator is in the overbought zone, even if it rises further, it will eventually show a downward trend.
We need to create a response strategy by keeping this in mind.
In other words, we need to check whether the price is maintained above the M-Signal indicator of the 1D chart or above the M-Signal indicator of the 1W chart and create a response strategy.
-
Thank you for reading to the end.
I hope you have a successful transaction.
--------------------------------------------------
- Explanation of the big picture.
I used TradingView's INDEX chart to check the entire range of BTC.
I rewrote it to update the previous chart by touching the Fibonacci ratio range of 1.902 (101875.70) ~ 2 (106275.10).
(Previous BTCUSD 12M chart)
Looking at the big picture, it seems to have been maintaining an upward trend following a pattern since 2015.
In other words, it is a pattern that maintains a 3-year upward trend and faces a 1-year downward trend.
Accordingly, the upward trend is expected to continue until 2025.
-
(Current BTCUSD 12M chart)
Based on the currently written Fibonacci ratio, it is displayed up to 3.618 (178910.15).
It is expected that it will not fall again below the Fibonacci ratio of 0.618 (44234.54).
(BTCUSDT 12M chart)
Based on the BTCUSDT chart, I think it is around 42283.58.
-
I will explain it again with the BTCUSD chart.
The Fibonacci ratio ranges marked in the green boxes, 1.902 (101875.70) ~ 2 (106275.10) and 3 (151166.97) ~ 3.14 (157451.83), are expected to be important support and resistance ranges.
In other words, it seems likely that they will act as volume profile ranges.
Therefore, in order to break through these ranges upward, I think the point to watch is whether they can receive support and rise near the Fibonacci ratios of 1.618 (89126.41) and 2.618 (134018.28).
Therefore, the maximum rising range in 2025 is expected to be the 3 (151166.97) ~ 3.14 (157451.83) range.
In order to do that, we need to see if it is supported and rises near 2.618 (134018.28).
If it falls after the bull market in 2025, we don't know how far it will fall, but based on the previous decline, we expect it to fall by about -60% to -70%.
Therefore, if it starts to fall near the Fibonacci ratio 3.14 (157451.83), it seems likely that it will fall to around Fibonacci 0.618 (44234.54).
I will explain more details when the bear market starts.
------------------------------------------------------

Important section: 12.560-18.301
Hello, traders.
If you "Follow", you can always get new information quickly.
Please click "Boost" as well.
Have a nice day today.
-------------------------------------
(TRUMPUSDT.P 1D chart)
The HA-Low indicator on the 1D chart is showing an upward trend after being created.
The HA-Low indicator is currently formed at 7.933.
-
The 12.560-18.301 section corresponds to the Close value of Heikin-Ashi on the 1M chart.
Accordingly, in order to continue the upward trend, it is expected that the price will have to rise above 12.560-18.301 to maintain the price.
-
If it falls below 11.796-12.560, it is likely to meet the HA-Low indicator on the 1D chart again, so a response strategy is needed.
-
If it rises above 18.301 and maintains the price, it is expected to determine the trend again by touching around 27.329.
-
Thank you for reading to the end.
I hope you have a successful trade.
--------------------------------------------------
- This is an explanation of the big picture.
I used TradingView's INDEX chart to check the entire range of BTC.
I rewrote it to update the previous chart while touching the Fibonacci ratio range of 1.902 (101875.70) ~ 2 (106275.10).
(Previous BTCUSD 12M chart)
Looking at the big picture, it seems to have been following a pattern since 2015.
In other words, it is a pattern that maintains a 3-year bull market and faces a 1-year bear market.
Accordingly, the bull market is expected to continue until 2025.
-
(Current BTCUSD 12M chart)
Based on the currently written Fibonacci ratio, it is displayed up to 3.618 (178910.15).
It is expected that it will not fall again below the Fibonacci ratio of 0.618 (44234.54).
(BTCUSDT 12M chart)
I think it is around 42283.58 when looking at the BTCUSDT chart.
-
I will explain it again with the BTCUSD chart.
The Fibonacci ratio ranges marked in the light green boxes, 1.902 (101875.70) ~ 2 (106275.10) and 3 (151166.97) ~ 3.14 (157451.83), are expected to be important support and resistance ranges.
In other words, it seems likely to act as a volume profile range.
Therefore, in order to break through this section upward, I think the point to watch is whether it can rise with support near the Fibonacci ratios of 1.618 (89126.41) and 2.618 (134018.28).
Therefore, the maximum rising section in 2025 is expected to be the 3 (151166.97) ~ 3.14 (157451.83) section.
To do that, we need to look at whether it can rise with support near 2.618 (134018.28).
If it falls after the bull market in 2025, we don't know how far it will fall, but considering the previous decline, we expect it to fall by about -60% to -70%.
So, if the decline starts near the Fibonacci ratio 3.14 (157451.83), it seems likely that it will fall to around Fibonacci 0.618 (44234.54).
I will explain more details when the downtrend starts.
------------------------------------------------------

Importance of HA-Low, HA-High indicators
Hello, traders.
If you "Follow", you can always get new information quickly.
Please click "Boost" as well.
Have a nice day today.
-------------------------------------
(BTCUSDT 1D chart)
I wonder if you think that BTC has turned into an uptrend as I mentioned before, as it has risen above 89294.25.
The previous idea is titled "Breakthrough trading starts with finding support and resistance points."
It is ideal to buy at the lowest price possible and sell at the highest price possible, but in order to do that, you need to constantly check the chart in real time.
Therefore, I think it is better to focus on finding the most ideal trading time.
Therefore, you should try to trade according to your own trading rules, that is, your trading strategy.
-
In that sense, my trading criteria are the HA-Low and HA-High indicators.
As you can see from the published formula, when the Heikin-Ashi chart shows an upward trend, the HA-Low indicator is created, and when it shows a downward trend, the HA-High indicator is created.
Therefore, if possible, you can think of a trading strategy to buy when it shows support near the HA-Low indicator, and sell when it shows resistance near the HA-High indicator.
If it falls below the HA-Low indicator, a stepwise downtrend may begin, and if it rises above the HA-HIgh indicator, a stepwise uptrend may begin.
Therefore, it is necessary to look at how long the HA-Low and HA-High indicators make a horizontal line.
Looking at the current chart, we can see that the HA-Low indicator was created at the 89294.25 point and the price fell, but the HA-Low indicator remained the same.
Therefore, even if it fell below the HA-Low indicator, it did not lead to a stepwise downtrend.
In order for a stepwise downtrend to lead, the HA-Low indicator must show a new shape as it falls.
-
The HA-High indicator on the 1D chart is formed at the 101947.24 point.
Therefore, the section that determines the trend again is expected to be around 101947.24.
However, since the HA-High indicator on the 1W chart is formed at the 97224.92 point, we must first check whether it can rise above this area.
-
OBV has broken through the upper line.
However, since there is a difference from the previous high, the point to watch is whether it can rise above the previous high.
Section A is the section where the lower point of the HA-High indicator box and the upper point of the HA-Low indicator box overlap.
Therefore, the key is whether it can receive support and rise in this section.
This is because it can be considered a volume profile section because it is a section where the influence of the HA-Low indicator and the HA-High indicator are simultaneously applied.
-
This volatility period is expected to be around April 25-29 (up to April 24-30).
If the StochRSI indicator falls from the overbought zone after this volatility period, then the support around 89294.25 is expected to be an important issue.
The movement of the StochRSI indicator and the price movement do not necessarily appear in the same direction.
Therefore, we recommend that you focus on finding a selling time when the StochRSI indicator is above the 50 point and on finding a buying time when it is below the 50 point.
-
The biggest disadvantage of the breakout trading mentioned earlier is that when it shows a downward trend, it is a split selling period.
In other words, when it rises from the point where the breakout trading was made and then shows a downward trend, it is the first selling period.
If you ignore this, you may suffer a loss or increase psychological anxiety, so you need to be careful.
Since the current HA-Low indicator is the standard for breakout trading, you will feel less psychological anxiety.
The reason is that the HA-Low indicator is created, which means that it has broken out of the low range.
When the price rises and breaks through the HA-High indicator, it feels different from when it breaks through the HA-Low indicator.
When the HA-High indicator breaks upward, it makes you think that it will rise more.
No matter how much you try to calm your mind and look at the chart with a third-party's eyes, it is not easy to stop thinking like that.
The HA-High indicator is created, which means that it has fallen from the high range.
Therefore, since rising above the HA-High indicator means that it has risen to the high range, it is not strange if it falls at any time.
However, as I mentioned earlier, the idea that it will rise more will be dominant, so there is a high possibility that FOMO will take effect.
In order to escape this psychological state, support and resistance points drawn on the 1M, 1W, and 1D charts are absolutely necessary.
It is necessary to make an effort to stabilize your psychological state by conducting a split transaction depending on whether there is support near the drawn support and resistance points.
-
Thank you for reading to the end.
I hope you have a successful transaction.
--------------------------------------------------
- This is an explanation of the big picture.
I used TradingView's INDEX chart to check the entire BTC section.
I rewrote it to update the previous chart while touching the Fibonacci ratio section of 1.902 (101875.70) ~ 2 (106275.10).
(Previous BTCUSD 12M chart)
Looking at the big picture, it seems to have maintained an upward trend following a pattern since 2015.
In other words, it is a pattern that maintains a 3-year upward trend and faces a 1-year downward trend.
Accordingly, the upward trend is expected to continue until 2025.
-
(Current BTCUSD 12M chart)
Based on the currently written Fibonacci ratio, it is displayed up to 3.618 (178910.15).
It is expected that it will not fall again below the Fibonacci ratio of 0.618 (44234.54).
(BTCUSDT 12M chart)
Based on the BTCUSDT chart, I think it is around 42283.58.
-
I will explain it again with the BTCUSD chart.
The Fibonacci ratio ranges marked in the green boxes, 1.902 (101875.70) ~ 2 (106275.10) and 3 (151166.97) ~ 3.14 (157451.83), are expected to be important support and resistance ranges.
In other words, it seems likely that they will act as volume profile ranges.
Therefore, in order to break through these ranges upward, I think the point to watch is whether they can receive support and rise near the Fibonacci ratios of 1.618 (89126.41) and 2.618 (134018.28).
Therefore, the maximum rising range in 2025 is expected to be the 3 (151166.97) ~ 3.14 (157451.83) range.
In order to do that, we need to see if it is supported and rises near 2.618 (134018.28).
If it falls after the bull market in 2025, we don't know how far it will fall, but based on the previous decline, we expect it to fall by about -60% to -70%.
Therefore, if it starts to fall near the Fibonacci ratio 3.14 (157451.83), it seems likely that it will fall to around Fibonacci 0.618 (44234.54).
I will explain more details when the bear market starts.
------------------------------------------------------