Important Support and Resistance Areas: 16.72-19.52
Hello, traders.
Please "Follow" to get the latest information quickly.
Have a nice day today.
-------------------------------------
(LINKUSDT 1D chart)
The important support and resistance range is 16.72-19.52.
It is expected that a full-scale uptrend will begin only when it rises above this range.
To do so, we need to see if the price can be maintained above the M-Signal indicator on the 1M chart.
In other words, the key is whether it can receive support and rise around 15.14.
-
If it fails to rise,
1st: 12.49
2nd: 6.70
We need to check whether there is support around the 1st and 2nd ranges above.
-
If it rises above the important support and resistance range, the first resistance range is expected to be around 23.98.
-
Thank you for reading to the end.
I hope you have a successful trade.
--------------------------------------------------
- Here is a description of the big picture.
(3-year bull market, 1-year bear market pattern)
I will explain more details when the bear market starts.
------------------------------------------------------
HA

Check if it can hold the price above 26.37
Hello, traders.
If you "Follow", you can always get new information quickly.
Have a nice day today.
-------------------------------------
Hyperliquid token is a decentralized exchange token.
It forms the Hyperliquid Ecosystem.
To see if Hyperliquid can survive in the coin market in the future, we will have to see if the ecosystem expands.
---------------------------------------------
(HYPEUSDT 1D chart)
We need to see if the price can be maintained by rising above the Fibonacci ratio 1 (35.51).
If so, the next target range is expected to be around the Fibonacci ratio 1.618 (51.70).
-
The HA-High indicator on the 1D chart is formed at the 26.37 point.
Therefore, if it falls, we need to check if it is supported near the HA-High indicator on the 1D chart.
The current volume profile section is formed over the 19.59-23.19 section.
Therefore, if it falls to the maximum, it is expected that the 19.59-23.19 section will act as a strong support.
-
(30m chart)
Since the chart was created not long ago, it is difficult to analyze the chart over a long period of time.
Therefore, when trading these coins (tokens), it is recommended to trade mainly in short-term trading (day trading) or increase the number of coins (tokens) corresponding to the profit by increasing the number of coins (tokens).
-
The basic trading strategy is to buy when it receives support near the HA-Low indicator and sell when it meets the HA-High indicator.
However, if it is supported and rises near the HA-High indicator, there is a possibility of a stepwise upward trend, so you should think about how to proceed with a split transaction.
If it is resisted and falls near the HA-Low indicator, there is a possibility of a stepwise downward trend, so you should also think about a response plan for this.
-
In any case, you can see that it must rise above 33.89 to continue the upward trend.
Therefore, the key is whether it can rise with support near 33.17-33.89.
Currently, OBV > OBV EMA, so when it rises above the High Line, you should check whether it can maintain the price by rising above the 33.17-33.89 range.
-
Thank you for reading to the end.
I hope you have a successful transaction.
--------------------------------------------------
- This is an explanation of the big picture.
(3-year bull market, 1-year bear market pattern)
(3-year bull market, 1-year bear market pattern)
I will explain more details when the bear market starts.
------------------------------------------------------

The key is whether it can rise above 691.77
Hello, traders.
If you "Follow", you can always get the latest information quickly.
Have a nice day today.
-------------------------------------
(BNBUSDT 1D chart)
The key is whether it can rise above the previous ATH point of 691.77 and maintain the price.
Currently, I think the OBV indicator is showing an increase with trading volume as it rises above the High Line.
-
If it fails to rise, we should check whether the price can be maintained above the M-Signal indicator on the 1D chart.
If it falls below the HA-High indicator point of 654.90, it will eventually fall below the M-Signal indicator on the 1D chart, so it is likely to turn into a short-term decline, so caution is required when trading.
If it continues to fall further, it is expected to determine the trend again when it meets the M-Signal indicator on the 1W chart.
-
If it rises above 691.77 and maintains the price, it seems likely to renew the ATH.
-
The basic trading strategy is to buy near the HA-Low indicator and sell near the HA-High indicator.
However, if it is supported and rises on the HA-High indicator, it is likely to show a stepwise rise, and if it is resisted and falls on the HA-Low indicator, it is likely to show a stepwise fall.
Therefore, the basic trading method should be a split trading method.
You should establish a basic trading strategy that suits your investment style.
Otherwise, you may trade in the wrong direction due to subjective thoughts caused by price volatility.
-
Thank you for reading to the end.
I hope you have a successful trade.
--------------------------------------------------
- This is an explanation of the big picture.
(3-year bull market, 1-year bear market pattern)
I will explain more details when the bear market starts.
------------------------------------------------------

Next Volatility Period: Around June 6
Hello, traders.
Please "Follow" to get the latest information quickly.
Have a nice day today.
-------------------------------------
(BTCUSDT 1D chart)
This is the last day of this volatility period.
To continue the uptrend, the price needs to rise above at least 109403.63 and hold.
If it fails to rise, we need to check if it is supported near 106843.58.
And we need to see if it can touch the M-Signal indicator on the 1D chart and rise.
If the price is maintained above the HA-High indicator, it is also important to see if the price can be maintained above 106843.58, as there is a possibility of a stepwise rise.
The next volatility period is expected to be around June 6.
-
(30m chart)
It seems that the basic trading strategy is being followed faithfully.
That is, it is showing a pattern of buying near the HA-Low indicator and selling near the HA-High indicator.
Therefore, we need to focus on finding a trading point when the HA-Low or HA-High indicator is touched.
However, if it is supported by the HA-High indicator and rises, it is likely to show a stepwise upward trend, and if it is resisted by the HA-Low indicator and falls, it is likely to show a stepwise downward trend.
Even so, we must not forget that the end of a stepwise upward trend is a decline, and the end of a stepwise downward trend is an increase.
At the current price position, the important points on the 1D chart are 111696.21, 109403.63, and 106843.58.
Therefore, when looking at the 30m chart, if the HA-Low and HA-High indicators are generated near the important points above, it is necessary to interpret that point as forming a more important section.
In other words, the HA-Low indicator was generated at the 107096.41 point near the current 106843.58 point, and it eventually showed an upward trend.
Therefore, if the HA-Low indicator is newly generated as the price falls, you should check if there is an important point near it.
Otherwise, if it touches the existing HA-Low indicator point of 107094.41 again, it is more likely to fall because it touches the second time, so you need to be careful when trading.
This means that the HA-Low indicator is likely to rise when it is first generated, and is likely to fall when it touches the second time.
Conversely, the HA-High indicator is likely to fall when it is first generated, and is likely to rise when it touches the second time.
Since the interpretation of the indicator is not 100% applicable, you should check the support and find the trading point.
-
Thank you for reading to the end.
I hope you have a successful trade.
--------------------------------------------------
- This is an explanation of the big picture.
(3-year bull market, 1-year bear market pattern)
I will explain more details when the bear market starts.
------------------------------------------------------

The key is whether it can find support near 0.846 and rise
Hello, traders.
If you "Follow", you can always get new information quickly.
Have a nice day today.
-------------------------------------
(FETUSDT 1D chart)
The M-Signal indicator on the 1M chart is abnormal, so the key is whether it can hold the price.
If the price is maintained above the M-Signal indicator on the 1M chart, it is highly likely that the upward trend will continue in the medium to long term.
Accordingly, we should check whether it can be supported and rise around 0.846.
If it fails to rise, the support range is expected to be around 0.424-0.534.
-
When the rise begins,
1st: 1.194
2nd: 1.556
Responses are required depending on whether there is support around the 1st and 2nd above.
The 1.194 point corresponds to the support and resistance range in the candle arrangement.
-
Thank you for reading to the end.
I hope you have a successful transaction.
--------------------------------------------------
- This is an explanation of the big picture.
(3-year bull market, 1-year bear market pattern)
I will explain more details when the bear market starts.
------------------------------------------------------

Volatility Period: Up to May 29
Hello, traders.
If you "Follow", you can always get the latest information quickly.
Have a nice day today.
-------------------------------------
(BTCUSDT 1D chart)
It is showing a downward trend below the previous ATH range.
Accordingly, we need to see if it can rise to around 109588.0 and receive support.
However, since it is currently going through a period of volatility, we need to be careful about trading until May 28th.
-
If it falls further, we need to check if it can receive support near the Fibonacci ratio range of 1.902 (101784.54) ~ 2 (106178.85).
In particular, whether it can receive support near the M-Signal indicator on the 1D chart is key.
If it falls below the M-Signal indicator on the 1D chart, there is a possibility that it will touch the M-Signal indicator on the 1W chart, so we need to think about a response plan for this.
Therefore, if it shows support near the M-Signal indicator on the 1D chart, there is a possibility that it will show a pull back pattern.
The HA-High indicator of the 1D chart is formed at 102302.08, so it is important to see if there is support around this point.
-
The OBV indicator shows that OBV is falling below the High Line, and the StochRSI indicator is also showing that it has switched to a state of K < D.
Therefore, it is necessary to check whether OBV can touch the previous High Line or OBV EMA and rise.
If it falls below that, it is highly likely to lead to further decline.
I compared the previous OBV movements, that is, A, B, C, and the current movement, and the difference can be distinguished by whether it fell below the previous candle or not.
You can see that there is a difference from the previous movement because it is highly likely to close below the previous candle.
Therefore, the point to watch is whether it falls below 102302.08 after the volatility period or rises above 109588.0-110787.38.
If it falls below 102302.08 and receives resistance, it will turn into a short-term downtrend, and if it rises above 109588.0-110797.38, it is likely that the uptrend will resume, so it is a meaningful section.
-
Thank you for reading to the end.
I hope you have a successful trade.
--------------------------------------------------
- This is an explanation of the big picture.
(3-year bull market, 1-year bear market pattern)
I will explain more details when the bear market starts.
------------------------------------------------------

See if it can find support near 2521.05 and go up
Hello, traders.
If you "Follow" me, you can always get the latest information quickly.
Have a nice day today.
-------------------------------------
(ETHUSDT 1D chart)
The two charts above are charts that use the HA-MS indicator to mark support and resistance points on the 1M, 1W, and 1D charts.
The chart below is just a chart with the HA-MS indicator hidden.
If you look closely at the drawn support and resistance points, you can see that the points drawn with the HA-Low and HA-High indicators are important support and resistance points.
The HA-Low indicator is marked in orange (#ff9800), and the HA-High indicator is marked in blue (#0000ff).
It is impossible to explain all the thoughts of a chart analyst in writing.
That is why it is necessary to provide objective information to the readers.
Then, it will be very helpful for you to look at the chart.
If you think that my idea has too many indicators, you can disable the indicators by clicking "Grab this chart" in the idea article.
If you look at the chart with the indicators disabled, you may think that something looks better, but since you don't know why these support and resistance points were drawn, you may not be able to properly utilize the support and resistance points drawn on the chart when actually trading.
Even the support and resistance points you drew yourself often become unreliable due to the movement of the chart over time, and you will be even less reliable when it comes to support and resistance points drawn by others.
In order to reduce this phenomenon, objective information is necessary.
For that objective information, I use the HA-MS indicator.
For the trend perspective, there is the M-Signal indicator, and for the trading perspective, there are the HA-Low and HA-High indicators.
To understand the detailed movement, we use the DOM(60), DOM(-60), StochRSI 50, StochRSI 80, and StochRSI 20 indicators.
Therefore, you can basically interpret the chart by activating only the HA-Low, HA-High, and M-Signal indicators.
-
Therefore, if we interpret the chart, if it rises from the current price position, the resistance zone is around 3265.0-3321.30, and if it falls, the support zone is around 1647.06-1861.57.
You can see that the HA-High indicator is newly created at the current price position, and the M-Signal indicator on the 1M, 1W, and 1D charts is passing, so we can see that it is at an important turning point.
Therefore, the key question is whether the price can be maintained above 2609.74 or whether it will fall below 2359.35.
However, since the HA-High indicator is newly created, it is more likely to fall.
Since the OBV indicator showed that the OBV fell below the High Line, we need to check whether it can touch the OBV EMA again and rise above the High Line.
If the StochRSI indicator falls below 50, we need to focus on finding a time to buy, and if it rises above 50, we need to focus on finding a time to sell.
Since the OBV is currently on an upward trend, if this trend continues, the price is expected to eventually rise.
-
Thank you for reading to the end.
I hope you have a successful transaction.
--------------------------------------------------
- This is an explanation of the big picture.
(3-year bull market, 1-year bear market pattern)
I will explain more details when the bear market starts.
------------------------------------------------------

The key is whether it can rise above 3.211
Hello, traders.
If you "Follow", you can always get new information quickly.
Have a nice day today.
-------------------------------------
(TIAUSDT 1D chart)
The basic trading strategy is to buy near the HA-Low indicator and sell near the HA-High indicator.
However, if the HA-Low indicator falls, there is a possibility of a stepwise downtrend, and if the HA-High indicator rises, there is a possibility of a stepwise uptrend.
Therefore, when the HA-Low indicator is first created, the probability of rising is higher than the probability of falling, and when the HA-High indicator is first created, the probability of falling is higher than the probability of rising.
If the HA-Low indicator rises and then meets the previously formed HA-Low indicator again, the probability of falling is higher.
On the contrary, the HA-High indicator has a higher probability of rising.
You should check the movement of the chart with these characteristics in mind.
However, you should comprehensively judge the correlation between the OBV indicator and the StochRSI indicator.
-
From a trend perspective, since the M-Signal of the current 1D chart is < M-Signal of the 1W chart, you can see that it is in a reverse arrangement.
Therefore, when trading in a reverse arrangement, it is recommended to trade for a short period of time using day trading.
Therefore, if it shows a price that rises above the M-Signal indicator of the 1W chart and maintains the price, it is highly likely that a trend will be formed that can be traded.
In other words, when looking at the current price position, it can be seen that it can be traded for a short period of time or longer only when it rises above 3.211 and shows support.
-
Since the HA-Low indicator is formed at the 2.490 point, the price must be maintained above this point.
If not, there is a possibility of an additional stepwise downtrend, so you should think about a countermeasure for this.
-
If the average purchase price is significantly higher than the current price, you should not buy too much and increase your investment ratio.
In this case, it is better to trade with a relaxed mind and faithfully follow the basic trading strategy.
However, it is better to trade by increasing the number of coins (tokens) corresponding to the profit realization method and increasing the number of coins (tokens).
In other words, trade by purchase price.
If you bought 100 USDT at the current price of 2.840, you should sell 100 USDT when the price rises and shows resistance at 3.211.
In this case, only the number of coins (tokens) corresponding to the profit will remain.
At this time, you should be careful about the transaction fee.
Since you have to sell the purchase amount including the transaction fee, the actual selling amount when you place an order is not 100 USDT.
The transaction fee rate varies depending on the exchange.
For example, if the trading fee is 0.1%, you can trade 100USDT - (100USDT x 0.2%) = 99.8USDT.
-
Thank you for reading to the end.
I hope you have a successful trade.
--------------------------------------------------
- Here is an explanation of the big picture.
(3-year bull market, 1-year bear market pattern)
(3-year bull market, 1-year bear market pattern)
I will explain the details again when the bear market starts.
------------------------------------------------------

The key is whether it can find support at 24.59 and rise
Hello, traders.
If you "Follow", you can always get new information quickly.
Have a nice day today.
-------------------------------------
(AVAXUSDT 1M chart)
The key is whether the price can be maintained by rising above the M-Signal indicator on the 1M chart.
Accordingly, we need to see whether the price can be maintained by rising above 27.47.
-
(1W chart)
The important support and resistance range is the 38.93-51.54 range.
Therefore, even if the price is maintained by rising above the M-Signal indicator on the 1M chart, the uptrend can begin only if it rises above the 38.93-51.54 range.
If it falls, we need to see whether it can be supported near the volume profile range of 6.54-13.47.
-
(1D chart)
When it breaks upward around 28.67, it is expected that a breakout trade will be possible.
However, since an important support and resistance section is formed over the 38.93-51.54 section, a response is needed depending on whether there is support in this section.
Therefore, the key is whether it can be supported and rise around 24.59.
If not, it is necessary to check whether it is supported around 17.54-19.79.
-
The basic trading strategy is to buy when supported by the HA-Low indicator and sell when it meets the HA-High indicator.
However, if it is supported and rises near the HA-High indicator, it is likely to show a stepwise upward trend.
On the other hand, if it is resisted and falls near the HA-Low indicator, it is likely to show a stepwise downward trend.
Therefore, since it is currently located near the HA-High indicator, it can be seen that trading is possible depending on whether there is support.
However, since the probability of falling is higher than the probability of rising in the HA-High indicator, you should be careful about the investment ratio.
Otherwise, you may end up buying at the high point.
-
Thank you for reading to the end.
I hope you have a successful trade.
--------------------------------------------------
- Here is an explanation of the big picture.
(3-year bull market, 1-year bear market pattern)
(3-year bull market, 1-year bear market pattern)
I will explain the details again when the bear market starts.
------------------------------------------------------

Next Breakout Trading Zone: 0.26850
Hello, traders.
If you "Follow", you can always get new information quickly.
Have a nice day today.
-------------------------------------
(DOGEUSDT 1D chart)
It is expected that a breakout trade will be possible when the B zone breaks upward.
Conditions for a breakout trade:
1. OBV must show an upward trend. If possible, it is good to see an upward breakout of the High Line.
2. It should show that the StochRSI indicator maintains the K > D status. If possible, it is good if K does not enter the overbought zone.
If it rises above 0.24651, you should check if the OBV and StochRSI indicators meet the breakout trading conditions.
If it fails to rise, you should check if it is supported around 0.21409-0.22958.
If the price maintains above the M-Signal indicator on the 1M chart, it is likely to continue the upward trend.
-
Thank you for reading to the end.
I wish you successful trading.
--------------------------------------------------
- This is an explanation of the big picture.
(3-year bull market, 1-year bear market pattern)
(3-year bull market, 1-year bear market pattern)
I will explain more details when the bear market starts.
------------------------------------------------------

Next Target: Right Fibonacci Ratio 2.24 (116940.43)
Hello, traders.
If you "Follow" me, you will always get the latest information quickly.
Have a nice day today.
-------------------------------------
(BTCUSDT 1D chart)
It was supported near the Fibonacci ratio 2 (106178.85) and rose to renew the new high (ATH).
If this upward trend continues, it is expected to rise near the Fibonacci ratio 2.24 (116940.43).
-
If it falls,
1st: 102302.08
2nd: 97226.92
3rd: 89294.25
You need to check which of the 1st and 3rd areas above is supported.
Since the M-Signal indicator on the 1D chart is passing near the 1st area, if it falls below this, there is a possibility that it will turn into a short-term downtrend.
The M-Signal indicator on the 1W chart is still rising around 94K, but since the 97226.92 point is the HA-High indicator point on the 1W chart, I think it is likely to continue the upward trend if it receives support around this area.
The 89294.25 point is the HA-Low indicator point on the 1D chart, so if it receives support around this area, it is a good time to buy.
-
(30M chart)
If the price continues to rise by renewing the ATH, it is difficult to set support and resistance points.
Therefore, you need to be careful when trading coins (tokens) that are renewing the ATH.
Therefore, I think it is better to trade in a short-term trading (day trading) method, but to leave the number of coins (tokens) corresponding to the profit for the profit realization method.
In other words, when the price rises and then falls by the purchase price, the method is to sell only the purchase amount (+ transaction fee) to leave the coin (token) corresponding to the profit.
When selling, you should not sell the number of coins (tokens), but you should sell only the purchase amount.
You do not necessarily have to sell all of the purchase amount, but if possible, it is better to sell close to the purchase amount.
The reason is that when the price plummets or turns downward, there is a possibility of psychological pressure.
In my chart, the trading strategy is when the HA-Low and HA-High indicators are touched.
If it is supported near the HA-Low indicator, it is the time to buy, and when it meets the HA-High indicator, it is the time to sell.
However, if it is supported near the HA-High indicator, there is a possibility that a stepwise upward trend will continue, so a split selling strategy is necessary.
On the other hand, if it falls after receiving resistance from the HA-Low indicator, it is likely to show a stepwise downtrend, so a split buying strategy is needed.
-
When you meet the HA-Low and HA-High indicators, if you check the movement of the OBV indicator, it can help you create a trading strategy.
That is, when the OBV indicator breaks upwards through the Low Line, High Line, and OBV EMA, the price is likely to rise, and if the opposite happens, the price is likely to fall.
-
Thank you for reading to the end.
I hope you have a successful trade.
--------------------------------------------------
- This is an explanation of the big picture.
(3-year bull market, 1-year bear market pattern)
I will explain more details when the bear market starts.
------------------------------------------------------

Check if the price can hold above 2627.18
Hello, traders.
If you "Follow", you can always get the latest information quickly.
Have a nice day today.
-------------------------------------
(ETHUSDT 1D chart)
The M-Signal indicator on the 1M chart has risen above.
Accordingly, the key is whether it can find support near 2677.18 and rise.
If OBV rises above the A line, the price is expected to rise significantly once more.
Then, it is expected to rise to around 3265.0-3321.30.
-
If it falls without being supported near 2627.18, it is necessary to check whether it is supported near the right Fibonacci ratio 0.5 (2295.84).
Since the M-Signal indicator on the 1W and 1D charts is passing near that point, it is expected to play an important role.
-
Since the StochRSI indicator is in the overbought zone, it will eventually show a downward trend.
It is not known how much this decline will occur, but since the StochRSI 50 indicator is currently formed near 2359.35, it is important to check whether there is support near that area.
Therefore, in order to proceed with a new transaction, I think it is better to check the support point when the StochRSI indicator shows a downward and then upward trend in the overbought zone.
-
Thank you for reading to the end.
I hope you have a successful transaction.
--------------------------------------------------
- Here is an explanation of the big picture.
I used TradingView's INDEX chart to check the entire range of BTC.
I rewrote the previous chart to update it while touching the Fibonacci ratio range of 1.902 (101875.70) ~ 2 (106275.10).
(Previous BTCUSD 12M chart)
Looking at the big picture, it seems to have been maintaining an upward trend following a pattern since 2015.
In other words, it is a pattern that maintains a 3-year bull market and faces a 1-year bear market.
Accordingly, the upward trend is expected to continue until 2025.
-
(Current BTCUSD 12M chart)
Based on the currently written Fibonacci ratio, it is displayed up to 3.618 (178910.15).
It is expected that it will not fall again below the Fibonacci ratio of 0.618 (44234.54).
(BTCUSDT 12M chart)
Based on the BTCUSDT chart, I think it is around 42283.58.
-
I will explain it again with the BTCUSD chart.
The Fibonacci ratio ranges marked in the green boxes, 1.902 (101875.70) ~ 2 (106275.10) and 3 (151166.97) ~ 3.14 (157451.83), are expected to be important support and resistance ranges.
In other words, it seems likely that they will act as volume profile ranges.
Therefore, in order to break through these ranges upward, I think the point to watch is whether they can receive support and rise near the Fibonacci ratios of 1.618 (89126.41) and 2.618 (134018.28).
Therefore, the maximum rising range in 2025 is expected to be the 3 (151166.97) ~ 3.14 (157451.83) range.
In order to do that, we need to see if it is supported and rises near 2.618 (134018.28).
If it falls after the bull market in 2025, we don't know how far it will fall, but based on the previous decline, we expect it to fall by about -60% to -70%.
Therefore, if it starts to fall near the Fibonacci ratio 3.14 (157451.83), it seems likely that it will fall to around Fibonacci 0.618 (44234.54).
I will explain more details when the bear market starts.
------------------------------------------------------

Check support near 104984.57
Hello, traders.
If you "Follow", you can always get new information quickly.
Have a nice day today.
-------------------------------------
(BTCUSDT 1D chart)
OBV indicator is showing signs of rising above High Line.
Therefore, the candle body color has changed to dark green (#00332a).
Therefore, the key is whether it can be supported near StochRSI 80 (104984.57) and rise above 10613.74.
If it falls,
1st: 104463.99
2nd: 102302.08
You should check whether it is supported near the 1st and 2nd above.
-
If it is supported near 104984.57, it is likely to rise, but since the volatility period continues until May 20 (up to May 28), it is recommended to check whether it is supported.
Therefore, the point of observation is whether the price can be maintained above 102302.08 even after the volatility period.
-
Thank you for reading to the end.
I hope you have a successful trade.
--------------------------------------------------
- Explanation of the big picture.
I used TradingView's INDEX chart to check the entire range of BTC.
I rewrote it to update the previous chart by touching the Fibonacci ratio range of 1.902 (101875.70) ~ 2 (106275.10).
(Previous BTCUSD 12M chart)
Looking at the big picture, it seems to have been maintaining an upward trend following a pattern since 2015.
In other words, it is a pattern that maintains a 3-year upward trend and faces a 1-year downward trend.
Accordingly, the upward trend is expected to continue until 2025.
-
(Current BTCUSD 12M chart)
Based on the currently written Fibonacci ratio, it is displayed up to 3.618 (178910.15).
It is expected that it will not fall again below the Fibonacci ratio of 0.618 (44234.54).
(BTCUSDT 12M chart)
Based on the BTCUSDT chart, I think it is around 42283.58.
-
I will explain it again with the BTCUSD chart.
The Fibonacci ratio ranges marked in the green boxes, 1.902 (101875.70) ~ 2 (106275.10) and 3 (151166.97) ~ 3.14 (157451.83), are expected to be important support and resistance ranges.
In other words, it seems likely that they will act as volume profile ranges.
Therefore, in order to break through these ranges upward, I think the point to watch is whether they can receive support and rise near the Fibonacci ratios of 1.618 (89126.41) and 2.618 (134018.28).
Therefore, the maximum rising range in 2025 is expected to be the 3 (151166.97) ~ 3.14 (157451.83) range.
In order to do that, we need to see if it is supported and rises near 2.618 (134018.28).
If it falls after the bull market in 2025, we don't know how far it will fall, but based on the previous decline, we expect it to fall by about -60% to -70%.
Therefore, if it starts to fall near the Fibonacci ratio 3.14 (157451.83), it seems likely that it will fall to around Fibonacci 0.618 (44234.54).
I will explain more details when the bear market starts.
------------------------------------------------------

The point to watch is whether it can rise above 106133.74
Hello, traders.
If you "Follow", you can always get new information quickly.
Have a nice day today.
-------------------------------------
In order to distinguish which time frame chart the line was drawn on, it is divided into 3 types of lines.
You can create a trading strategy by responding to the support and resistance points or sections drawn on the chart depending on whether there is support or not.
-
The left is an example of when the support and resistance points were first created, and the right is an example of what it looked like after that.
To draw support and resistance points, you need to understand the arrangement of candles.
By checking how the candles are arranged, you can draw support and resistance points or sections like the example chart.
To draw support and resistance points or sections on a time frame chart like this, you need to check the arrangement of candles while minimizing the chart as much as possible.
-
Indicators are used to draw this work using more objective information.
That is, lines are drawn at the DOM(60), DOM(-60), HA-High, and HA-Low indicator points.
In this way, you will be able to reduce your subjective thoughts as much as possible.
Reducing your subjective thoughts will ensure the reliability of the drawn support and resistance points or sections.
-
Going back and drawing support and resistance points or sections with the arrangement of candles means that there must have been movement of candles in the past.
Therefore, if the candle moves to a point where there is no trace of the past, you can no longer draw support and resistance points or sections.
In terms of compensating for this shortcoming, it may be more useful to use indicators to display support and resistance points or sections.
-
The DOM indicator is an indicator that comprehensively evaluates the DMI + OBV + MOMENTUM indicators.
If the DOM indicator is 60 or higher, it means that all indicators have risen above their highest value.
If the DOM indicator is -60 or lower, it means that all indicators have fallen below their lowest value.
The fact that the DOM(60) indicator was created means that it is likely to enter the high point range.
The fact that the DOM(-60) indicator was created means that it is likely to enter the low point range.
Therefore, the DOM(60) indicator is likely to correspond to the resistance point, and the DOM(-60) indicator is likely to correspond to the support point.
Since the DOM indicator is displayed on the Close value, it has the disadvantage of being difficult to respond immediately when the actual DOM indicator is created.
However, once it is created, it will faithfully perform the role of support and resistance.
-
The HA-Low and HA-High indicators are indicators created to determine the trading point from the Heikin-Ashi candle.
Accordingly, the plotted point corresponds to the average value.
Therefore, the HA-Low and HA-High indicator points have the disadvantage of being expressed differently from the candle's value.
As you can see from the formulas of the HA-Low and HA-High indicators, the RSI value is included in the conditions of the formula.
The fact that the HA-Low indicator was created means that the price rose from the low point range.
Therefore, the HA-Low indicator corresponds to the support point.
The fact that the HA-High indicator was created means that the price fell from the high point range.
Therefore, the HA-High indicator corresponds to the resistance point.
Therefore, we basically have a trading strategy of buying when the HA-Low indicator is created and selling when the HA-High indicator is created.
-
It is not clear whether the actual support and resistance points or sections are supported or resisted.
However, as time passes, we can see whether it is supported or resisted.
To help determine whether it is supported or resisted, we use the StochRSI indicator and OBV indicator as auxiliary indicators.
-----------------------------------------
(BTCUSDT 1D chart)
It is showing an upward trend above the DOM (60) indicator displayed at the current candle position.
And, if StochRSI rises above 80 and maintains the price, the possibility of an upward trend will increase.
If the auxiliary indicator StochRSI indicator rises in the oversold zone and OBV rises above the High Line, the upward trend will be guaranteed.
The previous DOM (60) indicator is formed near the Fibonacci ratio 2 (106178.85).
Therefore, the point of observation is whether it can rise above that.
If it rises and maintains the price, it is expected to renew the ATH.
If not, and it falls below the HA-High indicator or the M-Signal indicator on the 1D chart,
1st: 97226.92
2nd: M-Signal on the 1W chart
You should check for support near the 1st and 2nd above.
-
This volatility period is expected to continue until May 20.
However, volatility may also occur around May 23 (May 22-24) and around May 27 (May 26-28), so you should be careful of volatility until May 28.
-
Thank you for reading to the end.
I hope you have a successful trade.
--------------------------------------------------
- This is an explanation of the big picture.
I used TradingView's INDEX chart to check the entire range of BTC.
I rewrote the previous chart to update it by touching the Fibonacci ratio range of 1.902 (101875.70) ~ 2 (106275.10).
(Previous BTCUSD 12M chart)
Looking at the big picture, it seems to have been following a pattern since 2015 and has been rising.
In other words, it is a pattern that maintains a 3-year uptrend and faces a 1-year downtrend.
Accordingly, the uptrend is expected to continue until 2025.
-
(Current BTCUSD 12M chart)
Based on the currently written Fibonacci ratio, it shows up to 3.618 (178910.15).
Fibonacci ratio 0.618 (44234.54) is not expected to fall again.
(BTCUSDT 12M chart)
I think it is around 42283.58 when looking at the BTCUSDT chart.
-
I will explain it again with the BTCUSD chart.
The Fibonacci ratio ranges marked in the light green boxes, 1.902 (101875.70) ~ 2 (106275.10) and 3 (151166.97) ~ 3.14 (157451.83), are expected to be important support and resistance ranges.
In other words, it seems likely to act as a volume profile range.
Therefore, in order to break through this section upward, I think the point to watch is whether it can rise with support near the Fibonacci ratios of 1.618 (89126.41) and 2.618 (134018.28).
Therefore, the maximum rising section in 2025 is expected to be the 3 (151166.97) ~ 3.14 (157451.83) section.
To do that, we need to look at whether it can rise with support near 2.618 (134018.28).
If it falls after the bull market in 2025, we don't know how far it will fall, but considering the previous decline, we expect it to fall by about -60% to -70%.
So, if the decline starts near the Fibonacci ratio 3.14 (157451.83), it seems likely that it will fall to around Fibonacci 0.618 (44234.54).
I will explain more details when the downtrend starts.
------------------------------------------------------

Important section: 101947.24-106133.74
Hello, traders.
If you "Follow", you can always get new information quickly.
Have a nice day today.
-------------------------------------
(BTCUSDT 1D chart)
It has touched the Fibonacci ratio 1.902 (101784.54) and is rising.
The key is whether it can receive support near the StochRSI 50 indicator (102971.99) and rise.
If not, it can fall to the 94915.18-97226.92 area.
Since the HA-Low indicator is formed at the 89294.25 point, it is important whether the price can be maintained above that point.
If the StochRSI indicator falls below the overbought range and then rises while moving sideways around the Fibonacci ratio range of 1.902 (101784.54) ~ 2 (106178.85), it is expected to renew the ATH.
Even if it falls more than expected, if it rises along the M-Signal indicator on the 1D chart, it is highly likely to renew the ATH.
----------------------------------------------------------
I will explain the newly added indicators, StochRSI 50, StochRSI 80, and StochRSI 20.
The disadvantage of interpreting the StochRSI indicator added as an auxiliary indicator is that it cannot determine the price movement.
Because of this, when interpreting the StochRSI indicator so far,
- Whether it is in the overbought or oversold zone,
- Whether StochRSI is above or below the 50 point,
we interpreted it as above.
Therefore, we added the price movement to the StochRSI indicator to check the movement more accurately.
-
The StochRSI 50 indicator is literally created when the StochRSI indicator passes the 50 point.
Therefore, we need to think about a response plan based on the price StochRSI 50 indicator.
-
The fact that StochRSI 80 is created means that the StochRSI indicator has risen above 80.
Therefore, in order to continue the upward trend, StochRSI must rise above 80.
If StochRSI 80 is not created and only StochRSI 20 is created, the upward trend will occur when the price is maintained above the StochRSI 50 indicator.
-
The fact that StochRSI 20 was created means that the StochRSI indicator has fallen below 20.
Therefore, in order to continue the downtrend, it must fall below StochRSI 20.
If StochRSI 20 is not created and only StochRSI 80 is created, the downtrend will occur when the price is maintained below the StochRSI 50 indicator.
-
Thank you for reading to the end.
I hope you have a successful trade.
--------------------------------------------------
- This is an explanation of the big picture.
I used TradingView's INDEX chart to check the entire range of BTC.
I rewrote the previous chart to update it by touching the Fibonacci ratio range of 1.902 (101875.70) ~ 2 (106275.10).
(Previous BTCUSD 12M chart)
Looking at the big picture, it seems to have been following a pattern since 2015.
In other words, it is a pattern that maintains a 3-year bull market and faces a 1-year bear market.
Accordingly, the bull market is expected to continue until 2025.
-
(Current BTCUSD 12M chart)
Based on the currently written Fibonacci ratio, it is displayed up to 3.618 (178910.15).
It is expected that it will not fall again below the Fibonacci ratio of 0.618 (44234.54).
(BTCUSDT 12M chart)
I think it is around 42283.58 when looking at the BTCUSDT chart.
-
I will explain it again with the BTCUSD chart.
The Fibonacci ratio ranges marked in the light green boxes, 1.902 (101875.70) ~ 2 (106275.10) and 3 (151166.97) ~ 3.14 (157451.83), are expected to be important support and resistance ranges.
In other words, it seems likely to act as a volume profile range.
Therefore, in order to break through this section upward, I think the point to watch is whether it can rise with support near the Fibonacci ratios of 1.618 (89126.41) and 2.618 (134018.28).
Therefore, the maximum rising section in 2025 is expected to be the 3 (151166.97) ~ 3.14 (157451.83) section.
To do that, we need to look at whether it can rise with support near 2.618 (134018.28).
If it falls after the bull market in 2025, we don't know how far it will fall, but considering the previous decline, we expect it to fall by about -60% to -70%.
So, if the decline starts near the Fibonacci ratio 3.14 (157451.83), it seems likely that it will fall to around Fibonacci 0.618 (44234.54).
I will explain more details when the downtrend starts.
------------------------------------------------------
Breakout trading possible range: 0.4140-0.4424
Hello, traders.
If you "Follow", you can always get new information quickly.
Have a nice day today.
-------------------------------------
(ENAUSDT 1D chart)
The key is whether it can break through the 0.4140-0.4424 range and rise.
It is expected that breakout trading will be possible if the 0.4140-0.4424 range breaks through.
However, it is judged that it is possible to lead to additional rise only if it rises above 0.5082 at once and maintains the price.
Therefore, if breakout trading was not possible, trading is possible if support is confirmed near 0.4140-0.4424.
-
If it rises above 0.5082 and is supported, there is a possibility that it will rise significantly as there is no special resistance zone.
In other words, it seems possible that it will break through 0.7907 and 1.0382.
-
Thank you for reading to the end.
I hope you have a successful trade.
--------------------------------------------------
- Here is an explanation of the big picture.
I used TradingView's INDEX chart to check the entire range of BTC.
I rewrote it to update the previous chart while touching the Fibonacci ratio range of 1.902 (101875.70) ~ 2 (106275.10).
(Previous BTCUSD 12M chart)
Looking at the big picture, it seems that it has been maintaining an upward trend following a pattern since 2015.
That is, it is a pattern that maintains a 3-year uptrend and faces a 1-year downtrend.
Accordingly, the uptrend is expected to continue until 2025.
-
(Current BTCUSD 12M chart)
Based on the currently written Fibonacci ratio, it is displayed up to 3.618 (178910.15).
It is expected that it will not fall again below the Fibonacci ratio of 0.618 (44234.54).
(BTCUSDT 12M chart)
Based on the BTCUSDT chart, I think it is around 42283.58.
-
I will explain it again with the BTCUSD chart.
The Fibonacci ratio ranges marked in the green boxes, 1.902 (101875.70) ~ 2 (106275.10) and 3 (151166.97) ~ 3.14 (157451.83), are expected to be important support and resistance ranges.
In other words, it seems likely that they will act as volume profile ranges.
Therefore, in order to break through these ranges upward, I think the point to watch is whether they can receive support and rise near the Fibonacci ratios of 1.618 (89126.41) and 2.618 (134018.28).
Therefore, the maximum rising range in 2025 is expected to be the 3 (151166.97) ~ 3.14 (157451.83) range.
In order to do that, we need to see if it is supported and rises near 2.618 (134018.28).
If it falls after the bull market in 2025, we don't know how far it will fall, but based on the previous decline, we expect it to fall by about -60% to -70%.
Therefore, if it starts to fall near the Fibonacci ratio 3.14 (157451.83), it seems likely that it will fall to around Fibonacci 0.618 (44234.54).
I will explain more details when the bear market starts.
------------------------------------------------------

Check if it can break through 0.03779-0.04757 at once
Hello, traders.
If you "Follow", you can always get new information quickly.
Have a nice day today.
-------------------------------------
(VETUSDT 1W chart)
Support zone: 0.00440-0.101741
Resistance zone: 0.03779-0.04757
If it breaks through the resistance zone upward and maintains the price, it is expected that a step-by-step uptrend will begin.
Therefore, it is important to check whether there is support around 0.03779-0.04757.
-
(1D chart)
The key is whether it can maintain the price by receiving support near the M-Signal indicator on the 1M chart and rising to around 0.03779.
If it fails to rise, you should check for support near 0.02778.
If it falls below the 0.01741-0.2135 range, you should stop trading and watch the situation.
Therefore, the 0.01741-0.2135 range is an important support range from a short-term perspective.
-
The 0.03779, 0.04757, and 0.06603 points are important points as HA-High indicator points on the 1W, 1M, and 1D charts.
It is expected that a breakout trade will be possible when it breaks through the 0.03779 point, but since an important point is located before it rises much, the point to watch is whether it can maintain the price by rising above 0.04757 at once.
Therefore, when making a breakout trade, check if it rises above 0.04757, and if not, respond.
-
Thank you for reading to the end.
I hope you have a successful trade.
--------------------------------------------------
- This is an explanation of the big picture.
I used TradingView's INDEX chart to check the entire range of BTC.
I rewrote the previous chart to update it by touching the Fibonacci ratio range of 1.902 (101875.70) ~ 2 (106275.10).
(Previous BTCUSD 12M chart)
Looking at the big picture, it seems to have been following a pattern since 2015.
In other words, it is a pattern that maintains a 3-year bull market and faces a 1-year bear market.
Accordingly, the bull market is expected to continue until 2025.
-
(Current BTCUSD 12M chart)
Based on the currently written Fibonacci ratio, it is displayed up to 3.618 (178910.15).
It is expected that it will not fall again below the Fibonacci ratio of 0.618 (44234.54).
(BTCUSDT 12M chart)
I think it is around 42283.58 when looking at the BTCUSDT chart.
-
I will explain it again with the BTCUSD chart.
The Fibonacci ratio ranges marked in the light green boxes, 1.902 (101875.70) ~ 2 (106275.10) and 3 (151166.97) ~ 3.14 (157451.83), are expected to be important support and resistance ranges.
In other words, it seems likely to act as a volume profile range.
Therefore, in order to break through this section upward, I think the point to watch is whether it can rise with support near the Fibonacci ratios of 1.618 (89126.41) and 2.618 (134018.28).
Therefore, the maximum rising section in 2025 is expected to be the 3 (151166.97) ~ 3.14 (157451.83) section.
To do that, we need to look at whether it can rise with support near 2.618 (134018.28).
If it falls after the bull market in 2025, we don't know how far it will fall, but considering the previous decline, we expect it to fall by about -60% to -70%.
So, if the decline starts near the Fibonacci ratio 3.14 (157451.83), it seems likely that it will fall to around Fibonacci 0.618 (44234.54).
I will explain more details when the downtrend starts.
------------------------------------------------------

Support and resistance zone: 0.016987-0.017858
Hello, traders.
If you "Follow", you can always get new information quickly.
Have a nice day today.
-------------------------------------
(1000SHIBUSDT.P 1W chart)
The key is whether the M-Signal indicator on the 1M chart can rise above and maintain the price.
If the price rises above the important zone of 0.021175-0.026744 and maintains, the uptrend is likely to begin.
If it fails to rise, you should check for support near 0.008763.
-
(1D chart)
In order to maintain the price above the M-Signal indicator of the 1M chart, it is important to see if it can rise to the vicinity of 0.016987-0.017858 and receive support.
Since the volume profile section is formed at the point of 0.021175, it is important to see if it can receive support in this section.
If it fails to rise, it is necessary to check for support in the vicinity of 0.012618-0.013489.
-
Since the StochRSI indicator has entered the overbought section, it is expected that the rise will be limited even if it continues to rise further.
Therefore, it is recommended to first check for support in the vicinity of 0.016987-0.017858.
-
Thank you for reading to the end.
I wish you successful trading.
--------------------------------------------------
- Explanation of the big picture.
I used TradingView's INDEX chart to check the entire range of BTC.
I rewrote it to update the previous chart by touching the Fibonacci ratio range of 1.902 (101875.70) ~ 2 (106275.10).
(Previous BTCUSD 12M chart)
Looking at the big picture, it seems to have been maintaining an upward trend following a pattern since 2015.
In other words, it is a pattern that maintains a 3-year upward trend and faces a 1-year downward trend.
Accordingly, the upward trend is expected to continue until 2025.
-
(Current BTCUSD 12M chart)
Based on the currently written Fibonacci ratio, it is displayed up to 3.618 (178910.15).
It is expected that it will not fall again below the Fibonacci ratio of 0.618 (44234.54).
(BTCUSDT 12M chart)
Based on the BTCUSDT chart, I think it is around 42283.58.
-
I will explain it again with the BTCUSD chart.
The Fibonacci ratio ranges marked in the green boxes, 1.902 (101875.70) ~ 2 (106275.10) and 3 (151166.97) ~ 3.14 (157451.83), are expected to be important support and resistance ranges.
In other words, it seems likely that they will act as volume profile ranges.
Therefore, in order to break through these ranges upward, I think the point to watch is whether they can receive support and rise near the Fibonacci ratios of 1.618 (89126.41) and 2.618 (134018.28).
Therefore, the maximum rising range in 2025 is expected to be the 3 (151166.97) ~ 3.14 (157451.83) range.
In order to do that, we need to see if it is supported and rises near 2.618 (134018.28).
If it falls after the bull market in 2025, we don't know how far it will fall, but based on the previous decline, we expect it to fall by about -60% to -70%.
Therefore, if it starts to fall near the Fibonacci ratio 3.14 (157451.83), it seems likely that it will fall to around Fibonacci 0.618 (44234.54).
I will explain more details when the bear market starts.
------------------------------------------------------

Support and Resistance Zone: 2273.58-2359.35
Hello, traders.
If you "Follow", you can always get new information quickly.
Please click "Boost" as well.
Have a nice day today.
-------------------------------------
(ETHUSDT 1M chart)
In order to turn upward on the 1M chart, the price must rise to the Fibonacci ratio range of 0.382 (2674.80) ~ 0.382 (2723.46) and maintain it.
Before that, the key is whether it can rise above the M-Signal indicator on the 1M chart.
-
(1W chart)
The key is whether the price can be maintained and rise above the M-Signal indicator of the 1W chart.
To do so, we need to check whether the price is maintained by rising near the right Fibonacci ratio 0.5 (2295.84).
In order to continue the uptrend in the medium to long term, the price must be maintained above the M-Signal indicator of the 1M chart.
Accordingly, the key is whether the price can rise above the M-Signal indicator of the 1M chart when the price is maintained by rising near the right Fibonacci ratio 0.5 (2295.84).
Therefore, it is expected that a breakout trade will be possible when the right Fibonacci ratio 0.5 (2295.84) is broken upward.
However, since the StochRSI indicator is showing signs of entering the overbought zone, the increase may be limited.
-
(1D chart)
It showed a big rise as it broke through the A section, that is, the 1861.57 point.
In any case, since it is currently below the M-Signal indicator of the 1M chart, we can see that there is still time to buy.
Therefore, as I mentioned earlier, we should focus on finding a buying point when the price rises above the M-Signal indicator of the 1M chart and maintains the price, or when it rises to the Fibonacci ratio range of 0.382 (2674.80) ~ 0.382 (2723.46) and maintains the price.
ETH is in a typical reverse arrangement (M-Signal of the 1M chart > M-Signal of the 1W chart > M-Signal of the 1D chart).
Therefore, we should focus on finding a buying point while watching the situation with a relaxed mind.
If it continues to rise like this,
1st: 2273.58-2359.35
2nd: 2627.18
3rd: 2921.73
We need to check if it can rise with support near the 1st-3rd above.
If not, if it falls, we need to check if it can support near 1861.57.
-
Thank you for reading to the end.
I hope you have a successful trade.
--------------------------------------------------
- This is an explanation of the big picture.
I used TradingView's INDEX chart to check the entire range of BTC.
I rewrote it to update the previous chart while touching the Fibonacci ratio range of 1.902(101875.70) ~ 2(106275.10).
(Previous BTCUSD 12M chart)
Looking at the big picture, it seems to have been following a pattern since 2015.
In other words, it is a pattern that maintains a 3-year bull market and faces a 1-year bear market.
Accordingly, the bull market is expected to continue until 2025.
-
(Current BTCUSD 12M chart)
Based on the currently written Fibonacci ratio, it is displayed up to 3.618 (178910.15).
It is expected that it will not fall again below the Fibonacci ratio of 0.618 (44234.54).
(BTCUSDT 12M chart)
I think it is around 42283.58 when looking at the BTCUSDT chart.
-
I will explain it again with the BTCUSD chart.
The Fibonacci ratio ranges marked in the light green boxes, 1.902 (101875.70) ~ 2 (106275.10) and 3 (151166.97) ~ 3.14 (157451.83), are expected to be important support and resistance ranges.
In other words, it seems likely to act as a volume profile range.
Therefore, in order to break through this section upward, I think the point to watch is whether it can rise with support near the Fibonacci ratios of 1.618 (89126.41) and 2.618 (134018.28).
Therefore, the maximum rising section in 2025 is expected to be the 3 (151166.97) ~ 3.14 (157451.83) section.
To do that, we need to look at whether it can rise with support near 2.618 (134018.28).
If it falls after the bull market in 2025, we don't know how far it will fall, but considering the previous decline, we expect it to fall by about -60% to -70%.
So, if the decline starts near the Fibonacci ratio 3.14 (157451.83), it seems likely that it will fall to around Fibonacci 0.618 (44234.54).
I will explain more details when the downtrend starts.
------------------------------------------------------

3-year bull market, 1-year bear market pattern
Hello, traders.
If you "Follow", you can always get new information quickly.
Please click "Boost" as well.
Have a nice day today.
-------------------------------------
(BTCUSDT 12M chart)
It has been showing a pattern of 3-year bull market and 1-year bear market since 2015.
If this pattern continues, it is expected that 2025 will be the last bull market.
2015-2017: Up about 12124%
2019-2021: Up about 1971%
In the uptrend that started in 2023, the maximum uptrend point is expected to be around the Fibonacci ratio 3.618 (178910.15).
Before that, we need to see if the price can be maintained by rising above the Fibonacci ratio 2.168 (134018.28).
Since the increase is showing a sharp decrease in the increase as the price rises, I think the increase in 2025 is likely to be not that great.
-
(BTCUSDT 12M chart)
If we look at this on the BTCUSDT chart, it is the same as the chart above.
We will have to see the movement when the downtrend starts, but the current expected range is expected to be around 69K.
It is expected that the price range below 42K will never be seen again.
-
Thank you for reading to the end.
I hope you have a successful trade.
--------------------------------------------------
- Here is an explanation of the big picture.
I used TradingView's INDEX chart to check the entire range of BTC.
I rewrote it to update the previous chart while touching the Fibonacci ratio range of 1.902 (101875.70) ~ 2 (106275.10).
(Previous BTCUSD 12M chart)
Looking at the big picture, it seems to have been maintaining an upward trend following a pattern since 2015.
In other words, it is a pattern that maintains a 3-year uptrend and faces a 1-year downtrend.
Accordingly, the upward trend is expected to continue until 2025.
-
(Current BTCUSD 12M chart)
Based on the currently written Fibonacci ratio, it is displayed up to 3.618 (178910.15).
It is expected that it will not fall again below the Fibonacci ratio of 0.618 (44234.54).
(BTCUSDT 12M chart)
Based on the BTCUSDT chart, I think it is around 42283.58.
-
I will explain it again with the BTCUSD chart.
The Fibonacci ratio ranges marked in the green boxes, 1.902 (101875.70) ~ 2 (106275.10) and 3 (151166.97) ~ 3.14 (157451.83), are expected to be important support and resistance ranges.
In other words, it seems likely that they will act as volume profile ranges.
Therefore, in order to break through these ranges upward, I think the point to watch is whether they can receive support and rise near the Fibonacci ratios of 1.618 (89126.41) and 2.618 (134018.28).
Therefore, the maximum rising range in 2025 is expected to be the 3 (151166.97) ~ 3.14 (157451.83) range.
In order to do that, we need to see if it is supported and rises near 2.618 (134018.28).
If it falls after the bull market in 2025, we don't know how far it will fall, but based on the previous decline, we expect it to fall by about -60% to -70%.
Therefore, if it starts to fall near the Fibonacci ratio 3.14 (157451.83), it seems likely that it will fall to around Fibonacci 0.618 (44234.54).
I will explain more details when the bear market starts.
------------------------------------------------------

Important Point: 1.0113
Hello, traders.
If you "Follow", you can always get new information quickly.
Have a nice day today.
-------------------------------------
(ONDOUSDT.P 1D chart)
The 1.0113 point is the HA-Low indicator point on the 1D chart.
Therefore, if it is supported near 1.0113, it is a time to buy.
If it is supported at the 1.0113 point and rises,
1st: 1.2715
2nd: 1.8588
You need to respond depending on whether there is support near the 1st and 2nd above.
-
If it fails to receive support at the 1.0113 point, you need to check whether there is support near 0.8292.
The support zone is around 0.5911.
-
The location of the 1.0113 point is a point where a breakout trade is possible.
However, caution is required because the StochRSI indicator is showing signs of entering the overbought zone.
Therefore, it is recommended to check the support near 1.0113 and then decide on the trading point.
-
(30m chart)
As seen in the 30m chart, it is currently located near the HA-High indicator.
In other words, it is showing a stepwise upward trend.
The indicators that play an important role in finding trading strategies and trading points are the HA-Low and HA-High indicators.
Therefore, when it is supported by the HA-High indicator and rises, it is necessary to aggressively buy and respond quickly with the thought that it can fall at any time.
-
Thank you for reading to the end.
I hope you have a successful trade.
--------------------------------------------------
- Explanation of the big picture.
I used TradingView's INDEX chart to check the entire range of BTC.
I rewrote it to update the previous chart by touching the Fibonacci ratio range of 1.902(101875.70) ~ 2(106275.10).
(Previous BTCUSD 12M chart)
Looking at the big picture, it seems to have been maintaining an upward trend following a pattern since 2015.
In other words, it is a pattern that maintains a 3-year uptrend and faces a 1-year downtrend.
Accordingly, the uptrend is expected to continue until 2025.
-
(Current BTCUSD 12M chart)
Based on the currently written Fibonacci ratio, it is displayed up to 3.618 (178910.15).
It is expected that it will not fall again below the Fibonacci ratio of 0.618 (44234.54).
(BTCUSDT 12M chart)
Based on the BTCUSDT chart, I think it is around 42283.58.
-
I will explain it again with the BTCUSD chart.
The Fibonacci ratio ranges marked in the green boxes, 1.902 (101875.70) ~ 2 (106275.10) and 3 (151166.97) ~ 3.14 (157451.83), are expected to be important support and resistance ranges.
In other words, it seems likely that they will act as volume profile ranges.
Therefore, in order to break through these ranges upward, I think the point to watch is whether they can receive support and rise near the Fibonacci ratios of 1.618 (89126.41) and 2.618 (134018.28).
Therefore, the maximum rising range in 2025 is expected to be the 3 (151166.97) ~ 3.14 (157451.83) range.
In order to do that, we need to see if it is supported and rises near 2.618 (134018.28).
If it falls after the bull market in 2025, we don't know how far it will fall, but based on the previous decline, we expect it to fall by about -60% to -70%.
Therefore, if it starts to fall near the Fibonacci ratio 3.14 (157451.83), it seems likely that it will fall to around Fibonacci 0.618 (44234.54).
I will explain more details when the bear market starts.
------------------------------------------------------

Important Point: 0.00001271
Hello, traders.
If you "Follow", you can always get new information quickly.
Have a nice day today.
-------------------------------------
(PEPEUSDT 1D chart)
The 0.00001271 point is the HA-High indicator point on the 1M chart.
Accordingly, the key is whether it can receive support near 0.00001271 and rise.
If it fails to rise, it is possible to re-determine the trend by touching the M-Signal indicator on the 1W chart.
The support area is near 0.00000723.
-
If it is supported and rises near 0.00001271, it is necessary to respond depending on whether there is support near 0.00001898-0.00002244.
-
I think the 0.00001271 point is a point where a breakout trade is possible.
However, caution is required because the StochRSI indicator is showing signs of entering the overbought zone.
Therefore, I think it is better to check for support rather than a breakout trade.
-
Thank you for reading to the end.
I hope you have a successful trade.
--------------------------------------------------
- This is an explanation of the big picture.
I used TradingView's INDEX chart to check the entire range of BTC.
I rewrote the previous chart to update it while touching the Fibonacci ratio range of 1.902 (101875.70) ~ 2 (106275.10).
(Previous BTCUSD 12M chart)
Looking at the big picture, it seems to have been following a pattern since 2015.
In other words, it is a pattern that maintains a 3-year bull market and faces a 1-year bear market.
Accordingly, the bull market is expected to continue until 2025.
-
(Current BTCUSD 12M chart)
Based on the currently written Fibonacci ratio, it is displayed up to 3.618 (178910.15).
It is expected that it will not fall again below the Fibonacci ratio of 0.618 (44234.54).
(BTCUSDT 12M chart)
I think it is around 42283.58 when looking at the BTCUSDT chart.
-
I will explain it again with the BTCUSD chart.
The Fibonacci ratio ranges marked in the light green boxes, 1.902 (101875.70) ~ 2 (106275.10) and 3 (151166.97) ~ 3.14 (157451.83), are expected to be important support and resistance ranges.
In other words, it seems likely to act as a volume profile range.
Therefore, in order to break through this section upward, I think the point to watch is whether it can rise with support near the Fibonacci ratios of 1.618 (89126.41) and 2.618 (134018.28).
Therefore, the maximum rising section in 2025 is expected to be the 3 (151166.97) ~ 3.14 (157451.83) section.
To do that, we need to look at whether it can rise with support near 2.618 (134018.28).
If it falls after the bull market in 2025, we don't know how far it will fall, but considering the previous decline, we expect it to fall by about -60% to -70%.
So, if the decline starts near the Fibonacci ratio 3.14 (157451.83), it seems likely that it will fall to around Fibonacci 0.618 (44234.54).
I will explain more details when the downtrend starts.
------------------------------------------------------

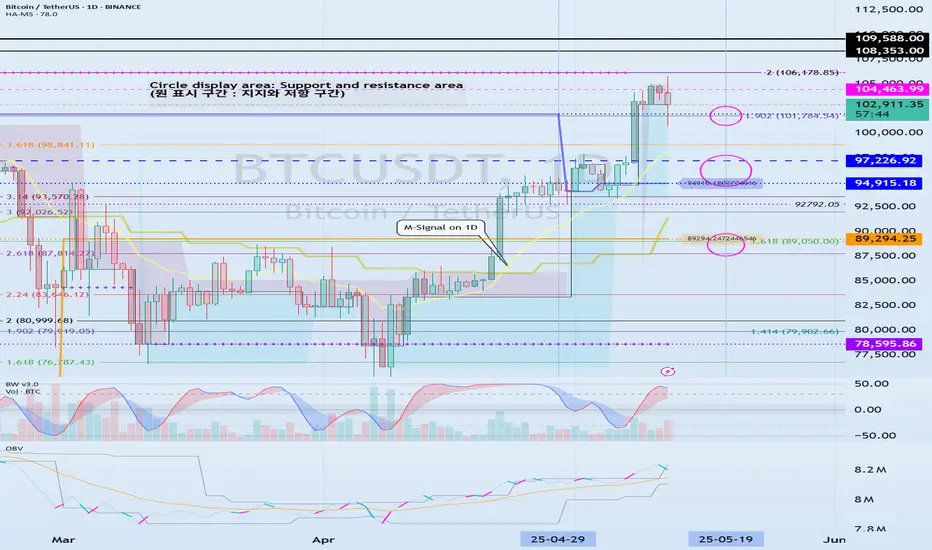
Whether it can be supported and rise at 102429.56 is the key
Hello, traders.
If you "Follow", you can always get new information quickly.
Please also click "Boost".
Have a nice day today.
-------------------------------------
(USDT.D 1M chart)
If USDT dominance is maintained below 4.97 or continues to decline, the coin market is likely to enter an upward trend.
(BTC.D 1M chart)
However, I think that for the altcoin bull market to begin, BTC dominance must be maintained below 55.01 or continue to decline.
If USDT dominance falls and BTC dominance rises, most altcoins are likely to gradually move sideways or show a downward trend.
In other words, it is highly likely that only BTC will continue to rise.
-----------------------------------------
(BTCUSDT 1M chart)
Based on the current position, in order to continue the uptrend, the price must be maintained above the Fibonacci ratio of 1.902 (101784.54).
If not, it is likely to fall to around the Fibonacci ratio of 1.618 (89050.0).
If the uptrend continues, the point to watch is whether it can renew the new high (ATH) this time.
-
(1W chart)
It is rising after touching the 73499.86 area.
It is showing a large increase as it breaks through the HA-High indicator point of 97226.92 on the 1W chart.
Since the StochRSI indicator is expected to enter the overbought zone, it is highly likely that the future rise will be limited.
Therefore, the key is whether the price can be maintained above the left Fibonacci ratio of 1.902 (101784.54).
If it falls, you should check whether it is supported near 97226.92.
If it falls below 97226.92, you should check whether it is supported in the 1st and 2nd sections marked on the chart.
You should check where the StochRSI 80 indicator is formed when the next candle is created.
The StochRSI 80 indicator on the 1M chart is formed at the 102429.56 point.
Therefore, we need to check whether the StochRSI 80 indicator point on the 1W chart is formed around the 102429.56 point.
-
(1D chart)
Since the StochRSI indicator on the 1D chart is located below the midpoint, we need to focus on finding a buying point.
With this rise, the StochRSI indicator is expected to rise above the midpoint.
If the StochRSI indicator is located above the midpoint, we need to focus on finding a selling point.
Therefore, the point of interest is whether the price can be maintained around the right Fibonacci ratio 1.902 (101784.54) as we pass through the next volatility period around May 19.
-
Among the interpretation methods of the OBV indicator, there is an interpretation method that there is a possibility of an increase or decrease when the previous high or low is broken.
This time, it showed an upward break through the upper line of the OBV and broke through the lower line of the previous OBV.
In other words, it showed an upward break through the A section.
If this upward break through the B section is continued, it is expected to renew the ATH.
-
Thank you for reading to the end.
I hope you have a successful transaction.
--------------------------------------------------
- This is an explanation of the big picture.
I used TradingView's INDEX chart to check the entire section of BTC.
I rewrote the previous chart to update it by touching the Fibonacci ratio section of 1.902 (101875.70) ~ 2 (106275.10).
(Previous BTCUSD 12M chart)
Looking at the big picture, it seems to have been following a pattern since 2015.
In other words, it is a pattern that maintains a 3-year bull market and faces a 1-year bear market.
Accordingly, the bull market is expected to continue until 2025.
-
(Current BTCUSD 12M chart)
Based on the currently written Fibonacci ratio, it is displayed up to 3.618 (178910.15).
It is expected that it will not fall again below the Fibonacci ratio of 0.618 (44234.54).
(BTCUSDT 12M chart)
I think it is around 42283.58 when looking at the BTCUSDT chart.
-
I will explain it again with the BTCUSD chart.
The Fibonacci ratio ranges marked in the light green boxes, 1.902 (101875.70) ~ 2 (106275.10) and 3 (151166.97) ~ 3.14 (157451.83), are expected to be important support and resistance ranges.
In other words, it seems likely to act as a volume profile range.
Therefore, in order to break through this section upward, I think the point to watch is whether it can rise with support near the Fibonacci ratios of 1.618 (89126.41) and 2.618 (134018.28).
Therefore, the maximum rising section in 2025 is expected to be the 3 (151166.97) ~ 3.14 (157451.83) section.
To do that, we need to look at whether it can rise with support near 2.618 (134018.28).
If it falls after the bull market in 2025, we don't know how far it will fall, but considering the previous decline, we expect it to fall by about -60% to -70%.
So, if the decline starts near the Fibonacci ratio 3.14 (157451.83), it seems likely that it will fall to around Fibonacci 0.618 (44234.54).
I will explain more details when the downtrend starts.
------------------------------------------------------
