BTC Target price TP1:75487 ,TP2:82282 BINANCE:BTCUSDT duration Halving2024
entry level(Pitchfork Trigger line):71949
Target price Daily Chart
TP1:75487(5% profit) (entry level:71949 )
TP2:82282(14.5% profit) (entry level:71949 )
Halving2024

KNC Target price weekly tp1:1.2513 ,tp2 1.5110 ,tp3 1.6903KNC decentral exchange duration Halving
Token with strong fundamental base
entry level1(Pitchfork Trigger line):0.9310
entry level2(Triple bottom): 0.9700
Target price weekly
tp1:0.9800 (entry level1:5% profit ,entry level2: 1.4% profit )
tp2:1.2513(34% profit) ,tp3 1.5110(55% profit) ,tp4 1.6903(73%)

BTCUSDBitcoin is sceduled to be halved April 20th, 2024 which will continue to soar. For now, these levels provide the next bullish wave.

When will bullish trend of Solana end ?(Price and time analysis)Hello everyone, I hope you're all doing well.
It seems that SOL has completed five waves and is now likely to undergo a corrective wave of three. Negative divergence between waves 4 and 5 in RSI or MACD is often a sign of the end of wave 5.
Keep in mind that both FVGs have filled out the weekly important points.
I don't recommend taking positions, but if you intend to, remember to manage your capital and risk properly without forgetting about rewards.
(Because Solana is very Savage.)
Time analysis:
In the Solana dominance chart, two days are significant:
- Today, which we witnessed the decline, and the next day, Thursday, March 28th, where there's a possibility of significant media news within this time frame, such as the sale of assets by the FTX exchange.
- The last day is April 13th.
In summary, be cautious with your positions over these 25 days.
P.S : The SOL.D chart is for yesterday.
I suggest you thoroughly read the analyses linked below:
USDT.D
BTC.D
BTCUSDT
I'd be happy to share your opinion with me. Your likes, follows, and comments give me energy.
The RSI indicator also suggests a complete cycle.
After starting from a small uptrend channel, it's currently completing an Elliott Wave cycle.
....

Complete analysis of Bitcoin (time and price analysis)Hello dear friends
I hope you have used Bitcoin and Tether Dominance analysis (I informed the exact date of the previous 2 corrections)
We are at a stage of the market where it is very difficult to overcome greed, be sure that if the market was going to make more profit than this, I would have opened a long leverage position of 3 or 5 right now, but it is not the case.
Some friends say that Tether has minted 9 billion dollars during this period, this is a bullish sign, well, in the history of crypto, Tether has minted almost another 90 billion dollars, but it has never been able to break its long-term support line (Tether Dominance Analysis).
So from the psychological point of view, it has a strong impact on the price.
2 simple technical tips to prove the weakening of the Bitcoin trend:
1- After breaking the resistance of 53,000 to 54,000, in the 4-hour or daily time frame, the price moved without a pullback, and as you can see, a FOMO wave was formed.
2- This Fomo wave has formed 3 FVG (price gap) in a row, which technically closes sooner or later when the price reaches this area.
Taking into account Bitcoin charts, Bitcoin Dominance, Tether, and proximity to halving, the probability of price correction is higher than increase, so I open a short position with leverage of 3-5% and place stop loss 2-3% higher than time limit, in order to manage capital and risk. I will place it from the historical ceiling (target range of 53-54 thousand)
Friends, pay attention, maybe a pattern will form in the lower time frame (1 hour or 30 minutes) and its ceiling will break, but this movement is nothing but a bullish trap.
Time analysis: I think the time range from March 11th to 25th, is the golden 14 days of the market to enter the corrective phase, note that the market maker is in control of the media and will do anything to make people excited.
I suggest you read the previous 2 analyzes.
I would be happy if you share your opinion with me.
Give me energy by liking and following me.

BTCUSDHi guys
Bitcoin halving is 32 days away. If we look at the previous patterns, about 500 days after the halving we had an uptrend. Compared to the past 500 days after this 32 days before halving, which price zone do you think will be seen!?
Remember that all price corrections are the right time to buy. As soon as the rally starts, we probably won't stop.

Bitcoin up 377.59% since November 2021Bitcoin up 377.59% since November 2021
As the next halving approaches (April 19 2024), it is time for a retracement before the big pump.
It always happened in all previous pre-hanvings.
If the GETTEX:64K support is broken the next one will be in the $58k/$57 zone.
Next week will be very important for us to really see the extent of the retracement.

SOONI have been following the weekly time charts forever now and focusing on the halving schedule as a base line for pretty much every chart I watch. I haven't been publishing which is a shame because on socials I have been spot on for several months leading up to this bull-run. Feels good. Anyway, I personally think the parabolic moves start next week.

Bitcoin Halving: What you should know about this halvingThe Bitcoin halving is set to happen in April 2024. Here's what to expect👇
First, let's reflect on the Previous Halving:
➖ In 2020, after the last halving, the block reward dropped to 6.25 BTC
➖ Bitcoin's hash rate dropped by 30% within two weeks.
➖ Bitcoin's miner difficulty was also automatically reduced shortly after that, leading to new all-time highs in the hash rate just seven weeks after the halving.
➖Following the previous halving in May 2020, the price moved to a new all-time high within 8 months.
Implications of the Upcoming Halving:
➖The rewards issued to miners per block will be reduced from 6.25 BTC to 3.125 BTC. This decreases Bitcoin's inflation rate from 1.7% to just 0.85% per year.
➖We can expect Bitcoin's hashrate to drop shortly after the halving.
➖The reduction in issuance also translates to potentially less Bitcoin being sold by miners.
➖While the direct impact of lower issuance is small, historically miners' volume share decreases after the halving. This strongly decreases the market impact of miners selling.
There is one important way in which this halving is very different. Price has already reached a new ATH ahead of the halving, with investors aiming to frontrun the 'halving effect'.
So while long-term selling pressure will diminish after the halving, short-term investors who acquired Bitcoin ahead of the halving may be looking to break-even

So you want some Lady? Here is the opportunity (a short thread)Disclaimer for anyone reading this: This analysis here is done with a sprinkle of TA, but a majority of market psychology and institutional strategy. Right now Lady is on a RIP. I know that feeling, waiting for a correction only to wake up to your watch list continuing to sky rocket. How the hell are you supposed to enter a coin with the candle looking like this. Well, here we go
1.) if you believe in Wyckoff, this coin is done with accumulation. It currently is in its "spring" stage. Now in every "spring" there is a retest of the levels. I am very confident that we will retrace at least to the low .20s or if we are lucky the 16-18s, these meme coins move up like GOD, but they also move down like your crazy ex gf that gave you the best experience of your life. This coin is on the brink of getting listed on binance futures. Right now, a lot of big money is buying this up only to short it in due time. Our moment to build a bigger long position is close.
a 20% draw down is in the cards, question is will you have enough capital to capture it to give you the gains you are looking for. This coin is hovering around 100M as I am writing this. Pepe is over 1B and so is Doge, so we have a frog coin and we have a dog coin. All we are missing is a lady ;)
Prepare for a nice sell off in April right before the halving. This is CERTAIN. You do not think that insitutions are praying on retail for this sell the news event? Yeah who cares, btc supply gets cut 50% but when you have hundred of millions of dollars you can care less entering at 72K or 85K btc price. They are okay with the halving event, they will get their coins.
But my friends, so will you.
Happy trading
April is the moment. I will write the next article when my thesis comes true. AS it always has on this coin.
Thanks for taking the time to read this
Go females

Bitcoin CyclesEach Bitcoin boom has ended in about 85% draw down in 2014 and in 2017. Right now the drawdown is at 75% for the 2021 cycle. If we see a similar drawdown of 85% it will be at around ~10000. My guess is that will not happen and that our current 75% draw down is what we will get this cycle but if we get a drawdown to the low teens I'll be backing up the money truck.
Each Bitcoin ATH to cycle low has been 89 weeks and 52 weeks respectively. If this is the current cycle's low then that puts it at 61 weeks as marked on the chart, which is between 89 and 52. If the boom and bust cycles continue due to the halvings I'm betting this is the bottom.
Each Bitcoin previous ATH to breaking that ATH is marked on the chart. They are 168 weeks and 154 weeks respectively. If we take the average of that we can expect this cycle to take 161 weeks to work out. This puts it around May of 2024 right around the current predicted halving date.
RSI is slated for a breakout around the end of the year - we could see a mini cycle like we did in the summer of 2019 after this break.
My current prediction is that this is the time to be aggressively dollar cost averaging. I will be buying each week until my powder is dry and if we complete an 85% drawdown I will be going all in.

Bitcoin's Next Halving - A Technical Analysis PerspectiveAs we approach the much-anticipated Bitcoin halving scheduled for April 19, 2024, it's essential for traders and investors to assess the potential price movements based on technical analysis. In this analysis, Bitcoin reached its previous all-time high (ATH) of November 8, 2021, while considering the formation of a Cup & Handle pattern and a retracement to the Fibonacci 0.618 level before the halving event.
Previous ATH Resistance:
Bitcoin's journey to its previous ATH on November 8, 2021, marked a significant milestone. The price action during this period resulted in a strong resistance level that traders should closely monitor. Psychological factors may come into play as Bitcoin attempts to breach this resistance, potentially leading to increased volatility.
Cup & Handle Formation:
A Cup & Handle pattern is a bullish continuation pattern often seen as a signal of a potential upward trend. In the context of Bitcoin's price chart leading up to the next halving, the market may exhibit a Cup & Handle formation. Traders should be vigilant for the cup formation, followed by a brief consolidation forming the handle. The breakout from the handle could signal a strong bullish momentum.
Fibonacci Retracement to 0.618 Level:
Technical analysts commonly use Fibonacci retracement levels to identify potential support or resistance zones. In this scenario, a retracement to the 0.618 Fibonacci level, approximately around the $50,000 mark or potentially lower, could serve as a critical support level. This retracement could provide a buying opportunity for traders looking to enter the market before the halving event.
Halving Impact:
Historically, Bitcoin halving events have been associated with significant price movements. The reduction in block rewards tends to create scarcity, potentially driving up demand and prices. As we approach the April 19, 2024, halving, it's crucial to factor in this fundamental aspect when making trading decisions.
Conclusion:
In summary, the technical analysis suggests a potential scenario where Bitcoin retraces to the Fibonacci 0.618 level, forming a Cup & Handle pattern before the April 19, 2024, halving. Traders should remain vigilant at the previous ATH resistance level and be prepared for increased volatility. The halving event itself may act as a catalyst for a bullish trend, but market participants should carefully monitor key technical levels and consider risk management strategies in their trading decisions. As always, it's essential to adapt to changing market conditions and reassess the analysis based on real-time price action.
Note: Not Financial Advice

Market Update - March 7, 2024
BTC ATH breaks historical four-year halving cycle trend: Bitcoin (BTC) broke above the $69,000 mark this week, setting a new all time high of $69,324 on Tuesday morning. Despite common consensus of a post-halving bull run in the cards, like others that occurred in past four-year cycles, the market appears to be responding positively to the upcoming BTC halving and moving earlier than anticipated.
ETH holds firm despite sell off and ETH ETF delays: A sell-off following the BTC price run, as well as the SEC’s announcement to delay the decision deadlines on the spot Ethereum (ETH) ETF applications from Blackrock and Fidelity, had little impact on the price of ETH, with the market focusing on the anticipated launch of the network's Dencun upgrade, which is set to go live in the coming days.
Michael Saylor's MicroStrategy is looking to raise $600M to buy more BTC: MicroStrategy (MSTR) has announced plans to raise $600M by selling convertible debt in a private offering, for the alleged purpose of acquiring more bitcoin, taking advantage of the recent price run, and adding to its 193,000 BTC stack.
Meme coin mania is back: Momentum gathered for the six meme coins currently populating the top 100 list of cryptos by market cap, with multiple triple-digit percentage gains across the board, made up of DOGE, SHIB, PEPE, BONK, WIF, and FLOKI. Coinmarketcap data currently show the aggregate market cap of all meme coins standing at approximately $60B, with $30B in trading volume over the past 24 hours. The flurry of activity particularly across meme coins may suggest retail investors are beginning to return to the market or new retail participants are entering the market..
Soon, but not too soon for US interest rate cuts: Federal Reserve Chair Jerome Powell told House lawmakers on Wednesday that interest rate cuts are likely "at some point" in 2024, but not in the near future.
⏳ Topic of the Week: What is the Bitcoin halving?
👉Read more here

Bitcoin On The Way To 150K!!!Hi.
BINANCE:BTCUSDT
✅ Chart Is Speaking It Self.
➡️BTC continues to follow my scenario on the weekly timeframe😉
Keep growing.
Looking for a breakout and rally📈
✅ Due to the Ascending structure of the chart...
- High potential areas are clear in the chart.
- AB=CD
Stay awesome my friends.
_ _ _ _ _ _ _ _ _ _ _ _ _ _ _ _ _ _ _ _ _ _ _ _ _ _ _ _ _ _ _ _ _
✅Thank you, and for more ideas, hit ❤️Like❤️ and 🌟Follow🌟!
⚠️Things can change...
The markets are always changing and even with all these signals, the market changes tend to be strong and fast!!

When will the growth of Bitcoin end?Now the issue of time is more important than the price, we have less than 2 months from the halving and the price of Bitcoin is 60 thousand dollars. This strange bull run that eats all the resistances one after another looks like a bull trap before hawing.
Now we are witnessing a strong FOMO wave (in the 4-hour time frame, the important resistance of 53,000 to 54,000 is broken and the chart does not pull back, then Bitcoin grows by 11%), this is a sign of the swallowing of newcomers to the market.
The most important thing to think about is this
Is 60,000 bitcoins suitable for buying by big capitalists (other than micro strategy)? How about 50 thousand?
If your answer is yes, then you don't respect the risk to reward, as a result, this market loves your excitement and will drown you soon.
For some time now, the intense greed of the buyers has paid off (thanks God). I am not talking about taking a short position in Bolran, saving profit and enjoying the correction of the market.
In terms of time analysis, we are witnessing the last bullish day of bitcoin and we are approaching the correction phase on the general bullish wave.
In addition, TOTAL3 (the value of altcoins without Ethereum) has also reached a critical level, we probably have 1 blood month.

When will the growth of Bitcoin end?Now the issue of time is more important than the price, we have less than 2 months from the halving and the price of Bitcoin is 60 thousand dollars. This strange bull run that eats all the resistances one after another looks like a bull trap before hawing.
Now we are witnessing a strong FOMO wave (in the 4-hour time frame, the important resistance of 53,000 to 54,000 is broken and the chart does not pull back, then Bitcoin grows by 11%), this is a sign of the swallowing of newcomers to the market.
The most important thing to think about is this
Is 60,000 bitcoins suitable for buying by big capitalists (other than micro strategy)? How about 50 thousand?
If your answer is yes, then you don't respect the risk to reward, as a result, this market loves your excitement and will drown you soon.
For some time now, the intense greed of the buyers has paid off (thank God). I am not talking about taking a short position in Bolran, saving profit and enjoying the correction of the market.
In terms of time analysis, we are witnessing the last bullish day of bitcoin and we are approaching the correction phase on the general bullish wave.
In addition, TOTAL3 (the value of altcoins without Ethereum) has also reached a critical level, we probably have 1 blood month.

Bitcoin is Finishing bullish wave In my opinion ATH is not available before halving and before massive correction , Maximum Price would be 58200 and Final destination for my expected correction wave could be 29k-32k, Im not sure how much could be fast or slow but most probably before halving we will not see ATH.Do not get caught up in fomo. now is not good time for long position and buy. The market will provide us with better opportunities

BTC - Follow THIS Path to the HALVING📉Hi Traders, Investors and Speculators of Charts📈
If you have been following me for a while, you'll know I've been saying we are trading in the opening moments of a new bullish cycle. I've also referred to this as Elliot Wave Theory Wave 1.
According to my plan, this is the first impulse wave towards the upside. But the upwards wave are always followed by correction waves; a natural part of any cycle. I expected the second impulse wave (2-3) to happen very close to or just before the BTC halving, which is set to happen in April. This is based on a previous analysis that I did where we made a conclusion based on the price action of the previous BTC halvings before, during and after.
👉 Macro Analysis
Bitcoin is due for that 30% correction / pullback. Even dropping to lower 30K zone would still be a lower high, classic Elliot Wave Theory before the next upwards impulse wave, which is the biggest ( wave 2). This will fall exactly on the white diagonal trendline, which is our support zone.
👉 Technical Indicator Analysis
Our technical indicator is still bullish, but showing "Overbought". In a higher timeframe, this usually means it can carry n for some time - but a pullback is imminent before another impulse upwards.
NOTE that I am BULLISH on BTC. We're in the opening moments of a new bullish cycle, but there are pullbacks and corrections in upward cycles - and I'm expecting that we're currently trading in impulse wave 0-1.
If you found this content helpful, please remember to hit like and subscribe and never miss a moment in the markets.
_______________________
📢Follow us here on TradingView for daily updates📢
👍Hit like & Follow 👍
CryptoCheck
BITSTAMP:BTCUSD COINBASE:BTCUSD INDEX:BTCUSD INDEX:BTCUSD BYBIT:BTCUSDT.P

Ladycoin doing exactly what Ladycoin needs to be doingStrong support around .000498 levels. Safe place to long or enter the market. With the BTC halving approaching in April, be prepared for a nice market correction around the 50-52K BTC levels. Keep in mind the top two holders of Ladycoin is Bybit and Crypto.com. Crypto.com captured 13M out of the 40M market cap that Ladycoin has at the date I am writing this 2/12/24. Bybit is holding about 9.03M of that total mkt cap.
Be prepared for profit taking at the 0.0017ish levels. where that big candle came in on 12/10/23.
ETA on skyrocket for Ladycoin should be July-Oct 2024. That analysis is based on the time it takes for BTC to make new ATHs after the halving which is usually 6-12 months but I believe we will be fast tracked this cycle around due to the ETF that has been launched.
Addresses listed below for confirmation
0xf3B0073E3a7F74C7A38B36B805247B222C302A3 = Crypto.com
0xf89d7b9c864f589bb-F53a82105107622B35EaA40 = Bybit

BTC - Expected Price Up Until HALVING📉Hi Traders, Investors and Speculators of Charts📈
With the ETF approval priced in, next thing is the upcoming BTC halving expected in April - but wat does this mean for the price of BTC?
When there's an unprecedented event that will affect the markets, it's helpful to return to the basics:
👉 Buy the rumor, sell the news
👉 Macro Analysis
👉 Candlestick analysis
👉 Buy the rumor, sell the news
The ETF was again, a perfect example of this. Although it's possible for the price to increase days leading up to the halving, from a previous analysis we determined that BTC usually drops before halving.
👉 Macro Analysis
Bitcoin is due for a correction / pullback. Even dropping to lower 30K zone would still be a lower high, classic Elliot Wave Theory before the next upwards impulse wave, which is the biggest ( wave 2).
👉 Candlestick analysis
BTC has made 8 consecutive green candles in the two week timeframe. A few red ones are definitely overdue. This will support as a "fundamental reason" for the halving drop.
NOTE that I am still BULLISH on BTC. We're in the opening moments of a new bullish cycle, but there are pullbacks and corrections in upward cycles - and I'm expecting that we're currently trading in correction wave 1-2.
If you found this content helpful, please remember to hit like and subscribe and never miss a moment in the markets.
_______________________
📢Follow us here on TradingView for daily updates📢
👍Hit like & Follow 👍
CryptoCheck
BINANCE:BTCUSDT BITSTAMP:BTCUSD COINBASE:BTCUSD BINANCE:BTCUSDT.P

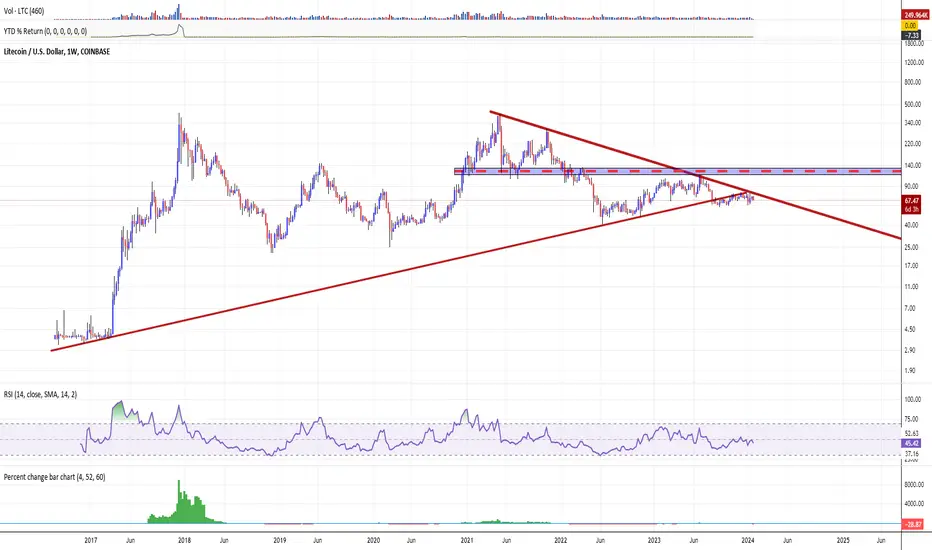
🏃♀️🏃♂ LTC. The spring has compressed. XxX's are inevitableOne of the most anticipated online events in the digital currency ecosystem in H2'23 was the Litecoin (LTC) halving, that took place in early August, 2023.
As the cryptocurrency market prepares for one of the network's major events, the Litecoin (LTC) halving, investors and analysts were peering into the crystal ball of market trends in an attempt to predict the outcome.
However, based on the hype that has accompanied the halving event over the past few months, there is good reason to believe that the online event may produce a different result than expected.
Historical backtest analysis says that every time the number of new addresses COINBASE:LTCUSD exceeded 350,000 over the past five years, a significant price correction followed.
More than 690,000 LTC addresses have recently been created, suggesting that the upcoming halving could be a “news selling” event.
On the other hand, the upcoming Litecoin halving, in theory, provides the opportunity for a significant price increase. This thesis stems from the deflationary effect that halving will cause, reducing the rate of creation of new Litecoins.
Combined with the growing demand for the coin, this again, in theory, could create an ideal scenario for price growth in the medium to long term.
The aftermath of the Litecoin halving should provide the cryptocurrency community with valuable information, especially as investors prepare for the subsequent Bitcoin halving
BITSTAMP:BTCUSD , scheduled for April, 2024.
Technical picture in Litecoin COINBASE:LTCUSD at the same time indicates a continuing deflationary price compression, with possible prospects for a further price decline within the boundaries of a downward channel to multi-year/ historical lows.
Bitcoin Halving Analysis & Historical ComparisonI’ve just created an interesting chart comparing this current cycle to the previous halving.
While it may not follow exactly, I believe we might observe significant similarities. My conclusion is that leading up to the halving, Bitcoin tends to (on average, excluding the COVID wick) drop by 17-18%. This leads me to believe that a $34,000 BTC is definitely feasible by the end of January, or during February.
And (again, on average) approximately 200 days after the halving, BTC tends to break the ATH.
The only stage on the chart above that I personally believe will not follow is the target. For months, my personal bull market top expectation has been between $90,000-$95,000, and it still remains the same. If we enter a super-cycle, then the figure would be much higher - too early to predict at this stage.

Bitcoin Is On Track With Last CycleDoing some cycle analysis today and looking at the bigger trends. One thing I have been noticing is the correlation that Bitcoin has with last cycle's action. To me, Bitcoin is on track with last cycle, sometimes you just have to zoom out to see it.
Too many times in crypto, people focus too heavily on the lower term time frames, trying to catch profit swings, or looking for the next memecoin to bounce, that we forget to zoom out and see the bigger picture.
Today, I had to do just that to get a better perspective of where we are in the markets before I get to trading this week. There has been a ton of activity and 'sell the news' action after the Bitcoin ETF, which I actually sat out trading, but observed the price action. It actually went the way I thought it would. Pump before the news, dump after. We will see it rise in the longer term simply due to the fact that Wall Street is now a major player, but for now, we have to wait it out and see.
What I am seeing when I zoom out to the weekly time frame, is that Bitcoin's price action resembles last cycle in very eerie ways. They say history doesn't repeat, but it rhymes, well, this is certainly true for this cycle. If you look at the chart you will see the similarities. We are in that same after bottom pump that we had in 2018-2019 where the price rose up after the market bottom and then settled back down through the block reward halving event before we went to this recent cycle highs.
I am not seeing much different, and especially after the way the price has risen over the last few months without a significant pull back, me may be seeing that form at this time. I thought is that we see a potential decline back to 36K-38K because that is the closes major level of support where Bitcoin found some consolidation for a while. This creates a shelf for it to revisit. But it's not a bad thing if you want to stack some cheap sats. Just saying. We might be ranging for the next few months until the block rewards are cut in half, then through the summer into the fall, we may need to be watching for some fireworks! Until then, it's going to be some ranging so I am going to be looking to take some short range swings and accumulate for the bigger cycle push!
Just got to sit back, be patient, and trade logically! Just my dudely advice, haha.
