We will see new bottom for BTC in November 2022In this monthly log chart, we can see halving dates, previous bottom values of BTC. If history repeat again, we might see a bottom for BTC on November first week in 2022.
Halving2024

$BTC - will this rally continue to 69k ? Hello my Fellow TraderZ,
Here, I have brought up with some unique observation.
You see { 1 } when in 2015, price marked its bottom. S.Rsi on Monthly from the moment it gave Bullish C.O. until it crosses the mark of 80 on S.Rsi. The price surged upto 233% from the bottom while it takes around 10 Monthly candles(303 Days).
{ 2 }, In 2019, from JAN 2019 to JULY 2019, S.Rsi showed similar movement while the price of #BITCOIN surged up to 350% from it bottom in 181 Days.
{ 3 }, The present scenario is the 3rd one. S.Rsi has finally give its Bullish C.O. and if we take the rising percentage similar to 2019 , we may see a test of the previous All Time High to 69K, which is ~ 300% from the recent BOTTOM. I am assuming this to take place somewhere between 6-10 months citing previous Trends which comes around the Pre-Halving Period(#2024) supporting Halving Theory satisfies #BTC Bull Cycle.
If such happens, welcome to the party of Blasts in #CRYPTO.
*Note : this is completely my speculation and #NFA.
CHEERS!!!

Fourth HalvingSometime in early Q2 of 2024 the Bitcoin network will experience it's fourth supply cut,
Economically I am seeing rapid cooldown of inflation with month over month inflation currently sitting at -0.10 month over month
5 year forward expectation rate of inflation as of today is currently sitting at 2.16 only 16 basis points away from 2% target
in my opinion inflation should level off in about 1 and a half months from now maybe around end of Q1
but in the immediate term we are also facing a debt ceiling crisis where the debt ceiling will need to be raised or suspended by the end of next week.
additionally short term government bonds are yielding higher than the long term government bonds
specifically the 2 month is yielding higher than the 2 year bond
the situation is an inverted yield curve during a liquidity crunch
therefore in my opinion this places Bitcoin in a 2015 situation and I expect long term logarithmic growth
and the occasional aggressive parabola
***Not financial advice always do your own research educational purposes only under the right of fair use***

The Birth of a new Bitcoin CycleHello Folks,
it's been 2,5 years since I predicted in May 2020 that Bitcoin will reach 70-150K when the price of Bitcoin was below 10K.
I now believe that Bitcoin Circle 4 has started.
Let me explain why!
I did this using historic data of Bitcoin and it's halving dates of its 4 cycles. Bitcoin halvings used to have an extreme influence on the price as it made it harder for miners to acquire BTC rewards for mining which they subsequently released on the market, causing the price to drop when BTC supply was relatively thin. Now with most of BTC's maximum supply already circulating, miners releasing their BTC rewards into the market is just like a drop in the ocean. That means, that halvings are mostly psychological events for the BTC price which fundamentally don't influence Bitcoin much other than dropping its hashrate for a short amount of time and making the business of miners less profitable, causing many of them to stop operations and increasing market share for the more established miners.
Nevertheless, Bitcoin halvings do have a psychological effect on the market that is sticking: A couple weeks after every halving BTC started its halving run, catapulting the BTC price to new highs in the timespan of roughly a year before collapsing 80-90% again to start a new cycle.
Due to trades trading accordingly and the severe psychological effects of these swings I excpect those 4 year cycles to continue.
For comparison, here is how the halving runs (HR) and their aftermath of every cycle looked like:
HR Cycle 1
HR Cycle 2
HR Cycle 3
At the end of Cycle 3 I overlayed the performances of Cycle 1 - Cycle 2 (purple) and Cycle 2 - Cycle 3 (blue) to the top of our HR circle top 3 (green).
HR 1 top -> low occured after 411 days from top.
HR 2 top -> low occured after 363 days from top.
Our current top (9th of November 2022) -> low occured 364 days from top, pretty much matching HR2 top and also its timeframe from BTC halving date to top (HR2 was 556 days, HR3 was 548 days).
That HR3 low was slightly broken 1,5 weeks later on the 21st of November but can be considered a soft double bottom.
According to the paths of Cycle 1-2 and Cycle 2-3 we should be heading to 30-50K in the next 6-12 months before retracing to 20-30K. After that, it will be the run-up to the halving run.
The date of the next Bitcoin halving is still unknown. At the time of the making of this chart it was scheduled to be May 2 2024, right now it's scheduled to be on March 17 2024 due to hash rate increases. As I expect some miners to stop operations till then, the date might move back a couple weeks or months again.
In this chart I still use May 2 2024. as we get close to the halving date I will a djust my chart accordingly and publish an update.
Using history data and calculating possibilites I came up with a path for the next halving run:
I estimate for Bitcoin to top out around 120K. However, as we can't predict the future, the real number might rather be between 80K-170K.
Disclaimer: As always, nothing is guaranteed. Bitcoin might change its behavior completely somewhen. This is a calculation on how things went in the past - past performances can never guarantee future performances.

Bitcoin Outlook: 2023 - 2025My outlook for the Bitcoin price for the next 2+ years in detail:
- End of 2022 - Q1 2023: I think this will be the time where we see Bitcoin make a last low around $10,000 - $14,000.
((Accumulation))
- Mid 2023: I think we will see some volatility (50-80%) with possible prices of $25,000 - $28,000. Bear Market rally as 2019, nothing sustainable.
((Taking some of the table))
- Summer 2023: Due to the announcement of a recession I guess we will revisit our previous low, or even make a new low ($10,000 - $14,000). This will be our last flush before the next Bitcoin halving and the bull market.
((Accumulate again))
- Q4 2023 - Q1 2024: This will be our grind to the 2023 high (around $25,000 - $28,000 as previously mentioned)
((Enjoy your filled bags))
- Q2 2024 - Q4 2024: Full on Bull Market where we will see a 6 figure Bitcoin and prices as high as $140,000 - $160,000. (A 10x move from the lows)
((Start taking profits))
- 2025: The next Bear Market will start.
------------------------------------------------
*Not Financial Advice, just my 2 cents*

Are the bad days of crypto coming to an end? List good cryptos Almost 11 months ago, I suggested that if you haven't left the market yet, it's time to sell your cryptos. Some of my colleagues thought I was crazy, but some who were more experienced had realized the reality even earlier than me. "WE WERE IN EUPHORIA STAGE" As if crypto traders were drunk.
With sincere thanks to @LewisGlasgow
According to the idea I've published on tradingview.com I've sold my holding gradually and start to take more short positions than long ones!
Now I believe we are around dip of the market! We have seen effect of halving before, I think it is going to work well for crypto holders in around 2 years.
The only bad news is war! China threatens Taiwan! Islamic republic may attack Persian Gulf neighboring nations and the most important one is Putin invasion of Ukraine. I wish peace for the world and I also wish people stop crazy dictators soon but unfortunately this war seems to be continued.
The other good sign is last super bearish week of BTC! Yeah you may be surprised but it's almost a good sign! Of course, this phenomenon is so rare that it cannot be a decision reference for the market, but it can help us to be more confident if we have the stronger reason to buy (Halving) .
Just before 2019 and in early weeks of 2020 two super bearish weekly candles was observed under moving averages of 20 and 100! in those candles we see a net bearish move that was bigger than 1.5 times of AHL (20). by AHL (20) I meant average high-low of the last 20 weeks.
We see a great bullish move after that!
Those weeks were definitely dip of the market and traders never see the price like that till now!
Right now! there are again a super bearish candle! It seems BTC like to take the last steps bigger.
If market is going to be bullish, which cryptocurrencies do you recommend for hold? please comment.
What do you think about these 6 ones!
LEO
XCN
TWT
OKB
BNX
GMX
My suggestion is to start buying slowly, even if this scenario is true, the process of starting to climb may take up to a year.
Also, don't forget that this is not a trading proposal and don't forget capital management and risk management. Only amateurs speak with 100 percent confidence in the market and there is always a possibility of failure of an idea.

BITCOIN overview March 25, 2024Hello traders! The new halving event is being closer and closer, and as we previously saw at this events, we can expect the price creating an all time high, again. Until then, the price is retesting once again a strong zone of support, which was acting as resistance at the all time high back in 2017 and 2019, and we can expect some accumulation in this zone, after which the price to move horizontally until March 2024, when an all time high is expected.
What's your opinion? Let's discuss!

BTC Next Halving ?Hello everyone, today I would like to share an idea about bitcoin next halving.
Can we predict the next halving of bitcoin with the help of previous cycles?
A bitcoin halving is scheduled to take place every 210,000 blocks. Three bitcoin halvings have already taken place, one in 2012, 2016, and the last halving in 2020.
The bitcoin halving prediction shown above is for the next halving set to occur in 2024.
The next bitcoin halving is scheduled to take place at block 840,000 which is predicted to be on Jun 30, 2024.
At the bitcoin halving 2024, the bitcoin block reward is scheduled to drop from 6.25 bitcoin per block to 3.125 bitcoin per block.
From a technical analysis point of view we could roughly estimate the next halving in August 2024. It is still a bit early to have a precise estimate, at the time of writing this idea we are on November 27, 2022, date at which the market has not yet reached its lowest point.
We can see from past data that over the last twelve years August has been more often in the negative than in the positive. In the ten months preceding it, especially April 2024 and May 2024 could be conducive to a potential halving of 2024.
The financial markets are cyclical, so there is a good chance that bitcoin will go up at some point, but since it is highly correlated to the S&P500 it could be in 1 month or 10 years.
To guarantee that bitcoin could exceed its high would be completely absurd, given the short history we have of bitcoin, the very notion of halving is to be taken with a pinch of salt. Indeed it has only happened three times. The market is very young (less than 20 years) so it is very complicated to predict these cycles.
In my opinion, in order to predict the next halving (and although according to me this notion of halving should be taken with a pinch of salt), we should wait to see where our next low will be. Depending on this, we could then observe whether the macroeconomic environment is evolving in a direction favourable to a next bull run. If the low point seems logical (around $12,000), that the environment is favourable to a new bull run and finally that a range break occurs from above $34,000 then it could seem interesting to invest in BTC to aim for $65,000 or even why not a new ATH.
I would like to remind you that crypto-currencies are very risky and highly volatile investments. Therefore, for the majority of investors, they should represent less than 5% of their capital.
THIS IS NOT INVESTMENT ADVICE.
Written by @maxencechachuat on 27 November 2022.

Bitcoin dominance vs price of Bitcoin Halving of Bitcoin is 1,5 year away, and Bitcoin dominance are at lows of 2018.
Before the halving, investors tend to load up - and they load at lowest level possible and ad up during the up waves.
Lower levels may be around 8-10K before the reversal and consolidation period starts, accumulation increase towards the halving in May 2024.

Bottom is in! Bitcoin hitting 50k in April 2023If we look in the previous bull run, there are few main points:
After the breakout of the falling price and weekly RSI resistance, it took BTC approximately 160 days to make a second peak at 0.618 fibo level
Such a movement would take us to about 50k at around April 2023
There are actually many similarities - mainly the big channel that the btc stays in the whole time, breaking out only around halving
Also, in the previous run, breakout of the falling price and RSI weekly resistance accured at the same time, same as now


Data on BitcoinNoticing a lot of similarities in market cycles when it comes to time. the first thing that popped out to me was the days till halving from the bottoms. then I noticed the time from bottom to bottom and top to top and to bottom in each cycle. market top to top is about 1420 days. Low to low is about 1435 days. Hi to low is about 365 days. Market bottom about 500 days before halving.

Bitcoin Less than 500 Days out from Halving The previous two Bear Markets bottomed about 500 days before the halving.

BTC analyses form now to 2026 Scenario of 2018 repeats in 6/11/2018 btc start to fall down 50% in same day in 2022 6/11/2022 btc start to fall down and still more to go to real support at 10/12 k and i copy the chart form this day to 69 k of btc it match perfectly with trend line

Bitcoin crashing to 11k next month?What if Bitcoin´s fractal from Summer of 2018 is playing out?
Bitcoin price action on this *bottom* is looking identical from the past 2018 summer-fall trading period before crashing to its 3.2k level, if this fractal plays out, it would lead to a weakening in price the rest of October to finally capitulate to reach the real bottom around 11k, this could leading to the next bull run after a consolidation on those levels.
Of course this is just a speculation but a possible scenario for Bitcoin if 20k is not rejected again this month.

BITCOIN 150.000$ 2030 ?Waiting for halving pump in the next 2 year.
.
bitcoin doing the great crater consolidiation in years.
.
maybe people can doing accumulation like whales too.
.
NFA if you gambling on this price area.
.
Better buy on DIP area.
Make your 1000$ to 1 M$
Don't make your 1M$ to 1000$
"Greed when people fear"
-Tepan

Alternative perspective - Bitcoin Between $11,000 - $12,000?There are many rabbit holes, fractals & patterns to play around with, but one thing is certain - there are beautiful architectures woven throughout the Bitcoin chart if one has a mind to pick away at it.. It's whispering things to us. It's actually the collective consciousness of all the human brains painting on a canvas..spliced in sections according to the halving cycle and world economics.
Sorry, I can't explain the chart much more than to say that non-log fibs applied over log chart in a very creative way has shown me some strange synchronicities that seam to point to a fractally/vertically shrinking and squeezing pattern as larger price thresholds lower the ceiling.. paired with SMAs at 100,200,300,400,500 + VWAP from previous cycle bottom low close and wick low..and Phoenix ascending + some bottom signal dots set based on a 21 day look back..also a the Kaufman moving average seams to cup the balls of the price right as the next halving occurs which is something that could help locate the median resting price of BTC..Playing with charts is as fun as making music to me..
Maybe it's completely wrong..but it's about narrowing down the possible outcomes based on some derived evidence. DYOR

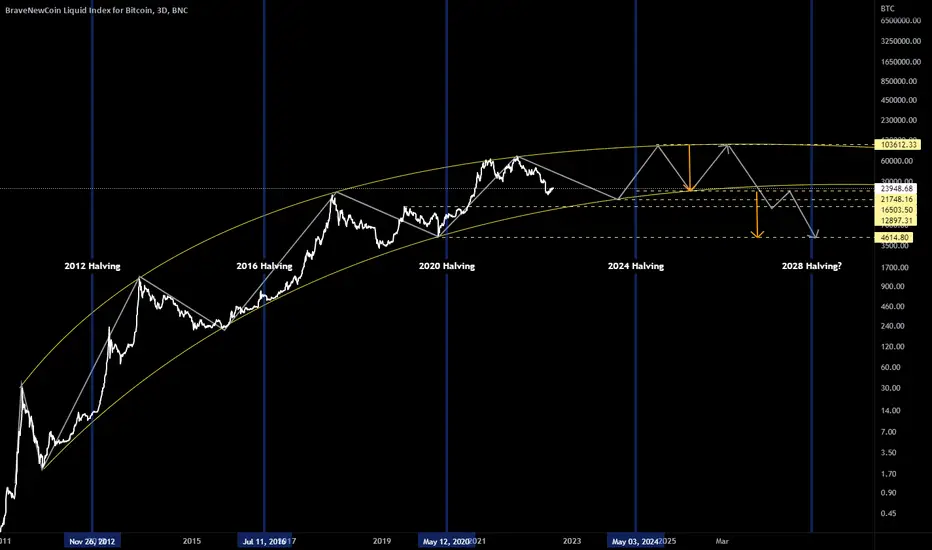
Bitcoin Heads towards ~100k Double Top - After 2024 HalvingThis idea is just for fun, so what if...
-- we do reach or almost reach 100k, but not until after the next halving
--we stop there, quickly head back down to around where we are now (24k)
-- and then right back to at or near 100k again
-- double-top then an extended downtrend until 2028 halving (we don't actually have a date for this yet, just speculating)
-- this stops at where we stopped during March 2020's black swan event (maybe this becomes a double-bottom)
Then, resume bullishness as we head towards future halvings from now through 2140.
Meanwhile, between now and 2024, we do see some correction up into the 35-45k area (give or take), but remain in a long-term downtrend that finally bottoms out around the 16.5k area (wicks could go down to 12-14k-ish).
TA 2022-08-06: BTC Halving Analysis
A. What is the Bitcoin halving?
1. The Bitcoin halving is an event where mining rewards are cut in half.
2. The event takes place every four years, according to pre-set rules in Bitcoin's code.
B. A brief history
1. 2009 – Bitcoin mining rewards start at 50 BTC per block.
2. 2012 – The first Bitcoin halving reduces mining rewards to 25 BTC.
3. 2016 – In the second halving, mining rewards go down to 12.5 BTC.
4. 2020 – In the third halving, mining rewards drop to 6.25 BTC.
5. 2140 – The 64th and last halving occurs and no new Bitcoin are created.

BTC Elliott Wave Long Term View As far as I know, the Brave New Coin Liquid Index (BLX) has the most complete chart of BTC. Looking at the 1M chart, we can observe that BTC halving events appear to always kick off wave 3 impulses. In the first halving, we can see a blow off top in the minor 5 of intermediate (3). The second halving, takes in minor 1 of intermediate (3) and the third halving also takes place during minor 1 of an intermediate (3). Most counts, regardless of the Elliott Wave pattern interpreted by the Elliotician puts us in a wave (4) either in an expanding flat or a WXY. Both the triangle in (4) and running flat with a leading diagonal in (1) of ((5)) ideas have been invalidated. There are arguments for cycle I being complete but looking at the duration in time of each wave it feels unlikely that this would be the case. Right now, the WXY in intermediate (4) of primary ((5)) is my main count with either the expanding flat or the cycle 1 complete counts being my alternates. As such, I think we have a strong chance of dropping down to around the $17,000-$18,000 before the bull run towards $100,000 begins (123.6-161.8 of the inverse of intermediate (3) and (4)).

Bitcoin Super CycleHere we can see the PI cycle top flashed early much like 2013
In 2013 it was April fools day when BTC started its correction
BTC reached the Center point of logarithmic regression around July 1
This correction was only 3 months in length
I do see a similar pattern here, If this plays out like the super cycle in 2013
then my personal targets are:
Center of regression July 2021
second PI cycle top will be around oct-nov of 2021
followed by a bear market which takes BTC to 20k as the floor again
shaking out most retail and making it less affordable to accumulate
From there BTC will be on the journey of 1 million roughly a year after the 4th halving
It's important to note 4th halving will put rewards close to PI at 3.125

Bitcoin monthly channel heading to the 2024 halvingThe channel is drawn to what provides the best fit. In this case, it is the candle close. This is the best fit because the candle wick in Dec 2017 was relatively short-lived; it lasted about 2.5 days.
However, the dotted arrow is drawn, considering the possibility that the price might overshoot out of the channel again. Even if it happens for a single day.
Based on the analysis above we are looking to possibly hit these price targets:
$200,000
$300,000
After the top, we would see an 80% as in the previous cycles taking us down to $60,000.
In the past, it has taken us about a year to bottom out and an extra four to six months to begin the rally. However, it is challenging to imagine recovery times as prolonged for the next bear market. The reason is we've seen a considerable uptick in US regulation and institutions interest. Ex:
The SEC is expected to make a decision on spot based ETFs by the end of October
U.S. Banking regulators are exploring a 'roadmap' to engage with cryptocurrency (FDIC chairman)
5 US senators publicly support bitcoin
BlackRock is invested in crypto companies and holds MicroStrategy shares
Bitcoin is legal tender in El Salvador
For those reasons, I've estimated the next bear market to last for significantly less time. Six months, half of its predecessors seems a reasonable approximation, plus-minus a couple of months.
Something to observe is that in the previous two cycles, the price has gone down somewhere below the channel equilibrium line right as we approach the next halving. The blue circles and pink vertical line. That is an area to keep in mind for now. I would consider it irrelevant if the spot ETFs are approved in combination with other positive news.

Bitcoin Halving 2024 | Is Possible $110-$120K Within 6-9 Months?This is the question that I will answer for your today.
Can Bitcoin hit $110,000 to $120,000 in the next 6-9 months?
It is a fair question, many people are bound to ask if prices can recover higher now that a strong correction has taken place...
Please allow me to entertain you for a few minutes!
Bitcoin peaked April 2021
The bullish wave that took place from July to November 2021 was the famous "dead cat-bounce".
The drop from $64/$69K to $17.5K is not only a correction but a bear market.
For BTCUSD to grow straight up to new highs, $100K and beyond, we would need to be just in a correction and not a bear market.
Since we are in a bear market, this price bounce that we are seeing now cannot go straight to 100K and beyond, instead, support levels turned resistance will be tested one by one.
Levels such as $30,000, $34,000 and $37,000 needs to be challenged first.
$40,000 and $50,000 for sure as well as the ATH.
We are likely to see very strong price swings in the months to come.
We will also experience a prolonged consolidation phase, boring market, after the next low.
The Bitcoin Halving ~March 2024
We say Bitcoin can go beyond $100,000USD only after 2024, around mid- to late 2025.
The next halving event for Bitcoin is happening around March 2024 (projected date).
This is a cyclical event and Bitcoin cannot have two bull-runs within the same halving cycle.
Bitcoin will now bounce, then move probably to a lower low or just pretty near the recent June low and then start a long consolidation phase...
Only after the Halving, which happens around March 2024, we can see a new phase of sustained long-term growth.
Try to avoid being distracted by these types of articles as this can mess up your trading.
If you think Bitcoin will go higher than where it can go, you might miss the selling opportunity coming next month.
Summary
Bear markets do not lead to new ATHs.
Before the next bullish cycle a consolidation phase is due.
The Bitcoin Halving determines the cycle.
Answer
Nope. Bitcoin cannot hit $110-$120K within 6-9 months.
It will take around 2.5-3 years... Based on my calculations and experience of course, I can be wrong.
Your turn now
What's your idea?
How long will it take before Bitcoin goes to $100K and beyond?
Share in the comments section below!
Namaste.
