6 Reliable Bullish Candlestick PatternHello dear traders,
Here are some educational chart patterns that you must know in 2022 and 2023.
I hope you find this information educational and informative.
We are new here so we ask you to support our views with your likes and comments,
Feel free to ask any questions in the comments, and we'll try to answer them all, folks.
6 Reliable Bullish Candlestick Pattern
1) The Hammer
2) Bullish Engulfing Crack
3) Bearish Engulfing Sandwich
4) Morning Star
5) Tweezer Bottom
6) Piercing Line
1. The Hammer:-
Hammer is a bullish candlestick reversal candle.
Which is formed within the next few candles. As the price declines sharply, we anticipate a final bounce.
But how can we estimate without falling into overselling?
That's where Hammer comes into play. This gives us evidence that the selling pressure is subsiding or being absorbed. Furthermore, if the volume signature associated with the hammer candle is significant, it adds even more confidence to our thesis.
We are looking to cash in on shorts who are taking profits and covering, as well as dip buyers who are taking chances here on oversold positions. Expectation? an assembly.
Ideally, you identify a hammer candle, take a long position on a break on the upside of the candle, and set risk on the low or in the body of the hammer.
Bullish Hammer Example;-
Let’s look at a real-life example with BTC. Right off the open, BTC retests the lows from the pre-market. Once it reaches those levels, volume increases slightly as it reverses on the 5-minute chart seen here.
Visibly, there is a “shelf” forming near the low of the hammer candle’s body. The bar to the left and right is also closed and open in that price “shelf” area.
The second 5-minute chart opens with a bit of weakness, then rallies strongly above the Hammer candle.
This is your signal to go long. The break of the Hammer candle body.
Set the stop below the close of this bullish 5-minute candle.
2. Bullish Engulfing Crack:-
You can imagine that shorts will start covering given the rising price of the stock. This adds fuel to the already existing buying pressure.
The result is a bullish candlestick pattern that swallows up the bears' efforts. For the long-biased trader, the opportunity is perfect.
As is the case with any setup, we are looking for evidence to sway our confidence in either direction. The fact that the bears completely got away in this single bar is proof enough for us.
You go long on the break of the previous bar and set the stop on the low.
Bullish Engulfing Examples:-
Here's a snapshot of BTC, which provided us with a beautiful opening range breakout (ORB) opportunity right out of the gate on this particular day:
After the selloff, buyers come in and remove the selling pressure from the pre-market, engulfing the bears before moving up.
To be safe, you enter long when the red candle breaks, setting your risk at the low level or body of the first green candle.
There are some advanced traders who are more aggressive and may take their positions early if they feel a reversal is imminent.
3. Bearish Engulfing Sandwich:-
do not be confused. Just because the name says "bearish" doesn't mean it's a bearish pattern. Far from it, actually. It is often referred to as a stick sandwich.
The name is derived from the sandwiching of a "bearish engulfing" candle by two bullish candles. Thus, it is a bullish candlestick pattern in this context.
Similar to the above example of a Bullish Engulfing Crack, this pattern takes a bit longer to "move through" so to speak. Essentially an extra bar.
The perception is that the trend has reversed and we are now going down. After all, the bearish engulfing candle gives us that confidence,
If you're on the smaller side, there's hope. However, stocks don't always do what we want them to. We have to react to what the market gives us, not what we think should happen.
In this case, the Bearish Engulfing Crack is used by two bullish candles that move upwards. If you are short, hopefully, you have respected your stop loss. If you are a long-time bias, here is a good opportunity for you.
Bearish Engulfing Sandwich Example:-
After opening with a 5-minute candle chart, BTC gives a great view of it in real-time.
In this case, the right side of the sandwich acts similarly to the Bullish Engulfing Crack candlestick pattern. For all intents and purposes, you should treat your entries and risk according to the same pattern.
4. The Morning Star:-
Morning Star should gap down. It's difficult to find on an intraday basis. For this reason, we are good enough for a solid Doji candle reversal pattern.
The opening candle should be long-bodied and bearish. The middle candle is the one with the smaller body. A reversal candle is another bullish candle with a long body (usually gaping up). The close of this bullish long-bodied candle should be above the midpoint of the first candle.
Without much selling pressure, the candlestick climbs to higher prices as sellers cover and buyers take advantage of discounted stock pricing.
Morning stars can also appear as morning Doji stars. They look almost identical except for the body of the middle candle. The story of buyers and sellers remains the same.
Bullish Morning Star Example:-
You can see this in action with the BTC example below. A long-body bearish candle, followed by a narrow-body indecision candle. The bulls take control of the next candle and the rest is history.
It is worthwhile to note the volume of the first candle. We cannot assume that this is a complete recession. As you can see, there is buying pressure at lower levels. When a Doji candle is formed, it gives us confidence.
As a result, as soon as the price moves away from the lower level of the green candle; It does this in small amounts.
How can we explain that?
It took less effort to increase the price. Therefore, we can assume that the reverse is "ease of movement". This should give us confidence in our long position.
5. Tweezer Bottom:-
The Tweezer Bottom Bullish candlestick pattern consists of two candles – usually with small bodies. The first should be a red/bearish candle, and the second a green/bullish candle.
Theoretically, the Tweezer Bottom alerts the chart reader to the fact that an attempt is being made to push the price down, but to no avail. Two smaller-sized candles represent the presence of demand in the market.
Supply is being absorbed keeping candles short in the presence of selling pressure, so the volume sign will appear higher.
Entry should be taken as soon as the price breaks through the second candle. Stops can be set on the lows.
Bullish Tweezer Bottom Example:-
BTC is displaying a beautiful tweezer bottom candlestick pattern for us on the 5-minute chart. Note the narrow bodies of the two candlesticks, their symmetry, and the close range from red to green.
The volume of this first red Doji is particularly interesting. Note how high it is here. Given the context, we can interpret this as an absorption of supply.
The second candlestick (green) then rapidly decreases in volume. Thus, our thesis is confirmed that sales are absorbed and eliminated.
6. Piercing Line:-
The piercing line may look similar to a bullish engulfing pattern. The exception is that the piercing line does not completely encircle the previous candle.
It is still considered a bullish candlestick pattern as it overcame the downward momentum to close at least midway in the body of the previous candle.
It pierces the bottom line but inevitably retraces.
Bullish Piercing Line Example:-
Piercing lines may present a greater risk to reward at lower levels of support. They can also act as a spring in the trading range.
This 5-minute chart of BTC shows the combination of an opening range breakout (ORB) with a piercing line. Together, it's a combination that can really add confidence to our entryways.
As with any setup, the more evidence we have to confirm our bias and plan, the better. For this reason, it is always good to ask yourself:
Are the trends in my favor?
Is it time for a change?
Does the volume confirm my thesis?
Is the stock in an area of support or resistance?
Are the multiple timeframes in line with my view?
Trade with care.
If you like our content, please feel free to support our page with a like, comment
Hit the like button if you like it and share your charts in the comments section.
Thank you
Hammer

AAPL: Bullish REVERSAL ahead? KEY POINTS to watch this week! 🤓• AAPL is reacting above a key support level;
• In the weekly chart, we see a Hammer candlestick pattern, which was triggered this week. This points to a possible bounce on AAPL;
• The technical target for a Hammer is the projection of the candlestick’s height in the direction of the breakout, this means, something around $138;
• In the daily chart, there’s no clear bullish reversal structure on AAPL yet, but we can use Fibonacci to set the next key resistance levels;
• The 50% retracement is around $137, which is quite close to the Hammer’s target in the weekly chart. Therefore the area around $137 - $138 is a key dual-resistance area;
• To not frustrate this thesis, it is important for AAPL to remain above the $128. If it loses it again, it might be problematic. I’ll keep you updated on this, as usual.
Remember to follow me to keep in touch with my daily analyses!

NVDA: BULLSEYE! 🎯 What to expect from here?• Yes, we nailed the 61.8% Fibonacci’s Retracement in the weekly chart. We set this target on my previous public analysis on NVDA (the link is below this post, as usual);
• Now, it seems NVDA is trying to react above the retracement. In addition, it just filled a gap around $142 (daily chart), which did work as a support level on Dec 29 – 30;
• So far, there’s a bottom sign, but not a reversal structure yet. The trend would technically reverse if NVDA breaks the 21 ema in the daily chart – so far, the 21 ema is above the price, pointing downwards;
• On the bright side, there’s a Hammer candlestick pattern in the weekly chart. As Bulkowski’s studies reveal, Hammers have 60% chances of reversing the trend, therefore, this might be a catalyst for NVDA;
• On the other hand, what could trigger a bearish continuation for NVDA? If it loses the 61.8% again. In this case, the next technical support level is the $129 (daily chart);
• I’ll keep you guys updated on this.
Remember to follow me to keep in touch with my daily analyses!

Trading Series – The ManagementMost of us will spend about 90% of our time thinking of what to buy and at what price we should get in. In fact, that is only 10% of work done.
Focus on this scenario instead - “After getting into a position, how are we going to manage it with either a calculated loss when market go against us or how should we take profits when market perform better than our expectation?
As usual we will do a few case studies on how I manage my positions for this year.
Today’s content:
1. 90% of us – Spending too much time on “Getting in”
2. Steps to manage our trades after an entry?
If you have been following, today’s is the 7th tutorial in our Trading Series:
1. “The buy strategy”
2. “The sell strategy”
3. “Developing long & short-term view”
4. “Choosing between the time frame”
5. “The entry”
6. “The exit”
7. “The management”
Example 1
Micro E-Mini Nasdaq Futures
Minimum fluctuation
0.25 point = $0.50
1 point = $2
10 points = $20
100 points = $200
1,000 points = $2,000
Example 2
E-Mini Nasdaq Futures
Minimum fluctuation
0.25 point = $5
1 point = $20
10 points = $200
100 points = $2,000
Disclaimer:
• What presented here is not a recommendation, please consult your licensed broker.
• Our mission is to create lateral thinking skills for every investor and trader, knowing when to take a calculated risk with market uncertainty and a bolder risk when opportunity arises.
CME Real-time Market Data help identify trading set-ups in real-time and express my market views. If you have futures in your trading portfolio, you can check out on CME Group data plans available that suit your trading needs www.tradingview.com

"Biting Point" Signal in Every Turn for 2022Stay-tune for the video version shortly, we will do more in-depth study.
Micro E-Mini Nasdaq Futures
Minimum fluctuation
0.25 point = $0.5
1 point = $2
10 points = $20
100 points = $200
Disclaimer:
• What presented here is not a recommendation, please consult your licensed broker.
• Our mission is to create lateral thinking skills for every investor and trader, knowing when to take a calculated risk with market uncertainty and a bolder risk when opportunity arises.
CME Real-time Market Data help identify trading set-ups in real-time and express my market views. If you have futures in your trading portfolio, you can check out on CME Group data plans available that suit your trading needs www.tradingview.com
I hope this tutorial will be helpful, in enabling you to read into the market with greater clarity.

SPX: Could it REVERSE? Pay attention to these KEY POINTS!• The index is on “bear mode” again, as it is doing lower highs/lows in the 1h/D charts, and it is trading below the 21 ema;
• It did a technical bullish candlestick yesterday, a Hammer, closing above the 3,818 (gap support). This is a sign of strength;
• Despite the bullish reaction, this Hammer wasn’t triggered, and the SPX has to break other key points in order to reverse the bearish sentiment;
• First, there’s the 21 ema in the 1h chart. Second, it has to fill the previous gap at 3,868 (1h chart), making it an Exhaustion Gap. Only if SPX reacts in this specific way I would be convinced that the “bear mode” might end;
• For now, I’ll stick with my original view: Since it is losing the support at 3,818 and it lacks bullish reaction, the next support to aim is the 3,744. So far, there’s no technical reaction that could convince me otherwise;
• I’ll keep you updated on this.
Remember to follow me to keep in touch with my daily analyses!

Calling bottom fpr pbhPotential double bottom, hammer candle to give some reassurance. Will be interesting to see what happens here, history shows it can run good when they take the brakes off.

QQQ: Breaking some Key Resistances. Could it recover from here?• QQQ is in a key resistance area, under the 61.8% retracement (previous support, now resistance);
• Since QQQ is trying to break this key point, it seems it will trigger the Hammer candlestick pattern from last Friday;
• This bullish reversal sign could take QQQ to higher levels, at least to its 21 ema again, in the short-term;
• If this will turn out to be a mid-term reversal structure, it is too soon to tell, as we must pay attention on how it’ll react near its next resistances;
• The 38.2% retracement along with the 21 ema is a key resistance to pay attention in the next few days, if QQQ gets there;
Remember to follow me to keep in touch with my analyses!

NIO daily bullish end of wave 5 C bottom of MRC Order BUY NIO NYSE Stop 10.19 LMT 10.19 will be automatically canceled at 20230401 01:00:00 EST
NIO daily bullish end of wave 5 C bottom of MRC. That may be it for NIO.

SPX: Hit our TARGET! What's next?• We nailed another target on SPX, as it did exactly what it had to do, and it hit its 21 ema yesterday, just after I posted my daily analysis;
• Today, it is under the 21 ema, indicating that the sell-off was intense, but we see some reaction;
• While I’m writing this, SPX is trying to do a Hammer/Doji candlestick pattern in the daily chart. The pattern is still forming, and there’s a good chance it won’t close like this, but if it confirms a bullish reaction, it might bounce to its 21 ema again (daily chart);
• The index is trying to stabilize just above the 50% retracement, as seen in the daily chart, and this point might work as a support level for us;
• However, SPX has yet to show more bullish signs in order to truly reverse. For now, I won't set any public target on it, but I’ll keep you guys posted, as usual. Soon we'll have more definition.
Remember to follow me to keep in touch with my analyses!

Tug of War Among Central BanksThere is a tug of war situation among the central banks to hike interest rates. What is the bad and the good that will come out from this?
i. Last week of October, European Central Bank officials announced another massive 75 basis point hike, increasing interest rates at the fastest pace in the history of the euro currency.
ii. This week, the Federal Reserve is expected to increase rates by 75 basis points for the fourth time in a row.
iii. The Bank of England could join the club on Thursday.
Content:
. The Interest Rate race has just started, why?
. The impact on different currencies
. It may not be all bad news, why?
With higher interest rates, it attracts investors to buy its currency, in this case the USD.
Currency is always a pair, when USD strengthens, the other side weakens.
When a currency gets weaker, it is very bad news for inflation because they will have to pay more on their imports.
Therefore in order to counter inflation, one of the best measures is to hike rate
Expect more volatility in the currencies market, meaning currencies will take its turn to move.
And if you are a trader, you should welcome volatility. Because with volatility, there are opportunities.
GBP Futures
0.0001 = $6.25
0.001 = $62.50
0.01 = $625
0.1 = $6,250
1.1000 to 1.2000 = $6,250
Disclaimer:
• What presented here is not a recommendation, please consult your licensed broker.
• Our mission is to create lateral thinking skills for every investor and trader, knowing when to take a calculated risk with market uncertainty and a bolder risk when opportunity arises.
CME Real-time Market Data help identify trading set-ups in real-time and express my market views. If you have futures in your trading portfolio, you can check out on CME Group data plans available that suit your trading needs www.tradingview.com

UPS daily bearish engulfing hammers wave 5 of wave COrder SELL UPS NYSE Stop 165.76 LMT 165.76 will be automatically canceled at 20230401 01:00:00 EST
UPS daily bearish engulfing hammers wave 5 of wave C take profit to MA 200 weekly and that's may be it for UPS correction.

LULU daily bullish hammer at long time supportOrder BUY LULU NASDAQ.NMS Stop 300.60 LMT 300.60 will be automatically canceled at 20230401 01:00:00 EST
LULU daily bullish hammer at long time support conservative stop, quick 1.2R countertrend

NIO weekly bearish hammer wave 5 bulls trappedNIO weekly bearish hammer wave 5 bulls trapped. Stop loss above the hammer. Love the volume of bearish candle trapping all the sellers.

UTHR daily bearish hammer in selling resistance zoneOrder SELL UTHR NASDAQ.NMS Stop 209.45 LMT 209.45 will be automatically canceled at 20230401 01:00:00 EST
UTHR daily bearish hammer in selling resistance zone


DNOW daily bearish hammerOrder SELL DNOW NYSE Stop 11.19 LMT 11.19 will be automatically canceled at 20230401 01:00:00 EST
DNOW daily bearish hammer at buying zone, stop loss above it, take profit to ceiling of selling zone.

DIS weekly bullish hammer at a monthly buying zoneOrder BUY DIS NYSE Stop 99.30 LMT 99.30 will be automatically canceled at 20230401 01:00:00 EST
DIS bullish hammer at a monthly support buying zone maybe that's it for the downtrend except for we didn't have exhaustion volume / capitulation / panic event.
Quick countertrend 1.2R

SQM daily bearish hammer SQM daily bearish hammer. First bullish candle closed below MA 10. I like how every bullish volume lower than preceding bearish ever since the pivot. Why don't we go all the way to support. Should watch carefully around MA 100.

BG weekly bearish hammerOrder SELL BG NYSE Stop 82.57 LMT 82.57 will be automatically canceled at 20230401 01:00:00 EST
BG weekly bearish hammer if we break lower will run into next support.

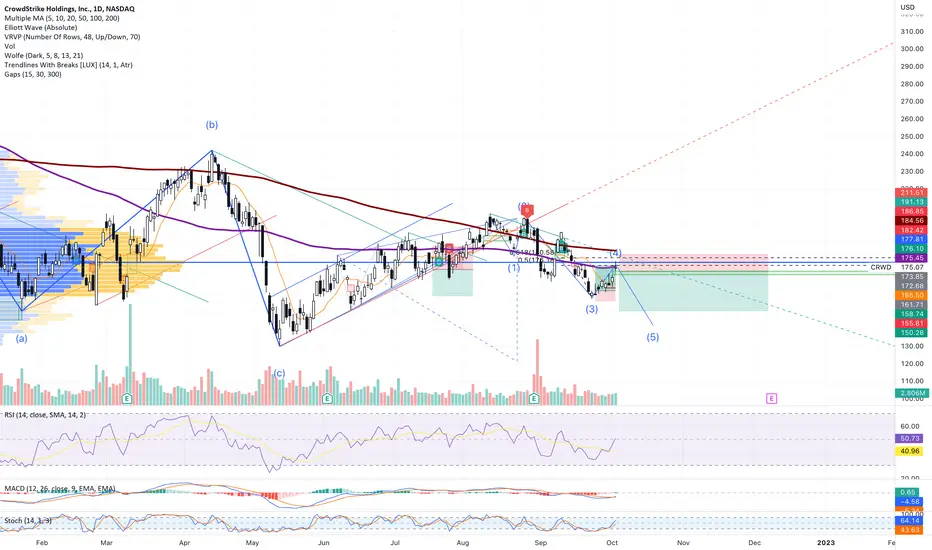
CRWD daily bearish hammer at 50% Fibonacci retracementOrder SELL CRWD NASDAQ.NMS Stop 172.68 LMT 172.68 will be automatically canceled at 20230401 01:00:00 EST
CRWD daily bearish hammer at 50% Fibonacci retracement beginning of wave 5 downtrend.
JPM weekly bearish hammer continuation of downtrendSell Stop 102.38 LMT 102.38 GTC
Buy Limit 89.54 GTC
Buy Stop 113.00 GTC
JPM weekly bearish hammer continuation of downtrend. Take profit at next support.

V daily bullish hammerOrder BUY V NYSE Stop 180.58 LMT 180.58 will be automatically canceled at 20230101 00:00:00 EST
V daily bullish hammer in oversold area if hold within a channel will move up.
