HFT - 100m gem primed for launch?I've been watching HFT for the last week. It's been getting solid bounces off the white descending support following a recent run.
It faked out the support during the recent dip but was able to form a channel below and has now made the first new high on the 12h as the MACD turns positive.
A test of the recent high at 0.163 would be a 100% move from here, but we could see a move much higher.
If we zoom out to the 2D chart we can see we've just formed a bullish hammer (close enough to one I think?) Supporting a shortterm move to the upside, where we would meet the descending resistance of a humongous descending wedge which will be tested for a 4th time if we get to that level. If we get a proper altszn and a break of the resistance we could see this thing quickly to around $1, 12-15X.
We can see bullish divergence in the 12h and 2d that may support that hypothesis.
Of course, if is a volatile coin. Hard dumps cannot be ruled out. Hold on to your buts.
DYOR
Hammercandle

ETHUSD 1 hour time frame
EHT USD Long Call Buy Setup
Bulllish Hammer Trigger the trade
Mange your risk reward as per your capital and book partial profits

Could BOJ's "HOLD" on Rates Turn AUDJPY "On Its Head"?Here I have a Multi-Timeframe analysis on OANDA:AUDJPY which is giving multiple signs of Higher Prices potentially to come!!
First on the Daily we can see that Price formed a Hammer Candle after testing the March 11th Support Zone and as the next Daily candle forms (Today), we are already seeing a Bullish Confirmation candle begin!
*Bullish Engulfing would be a textbook Confirmation Candle!
Now zooming into the 4Hr / 1 Hr Charts, this Hammer is formed by what looks to be a very Strong Reversal Pattern, the Inverted Head and Shoulders!
Now we are still waiting for the Confirmation of the Pattern where Price needs to rise to the "Neckline" or Resistance Level.
Once Confirmed, we will look for a Breakout of the Pattern and if Validated, could deliver great Long Opportunities as a Breakout and Retest of the Inverted Head and Shoulders Pattern!
If the Pattern is Successful, we could expect the Price Target to be at the next level of Resistance being the 95.3 - 95.6 Area!
Fundamentally, the BOJ begins the week with Policy Rate decision Monday evening where they forecast a HOLD on Interest Rates, staying at .5%. This could have drastic implications on the JPY, potentially weakening it.

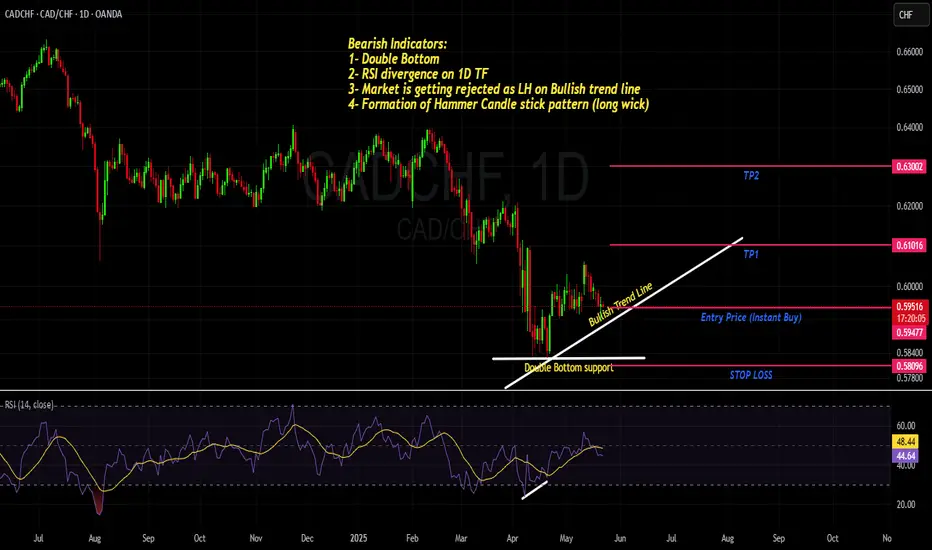
CADCHF- Another way to Look at BULLISH BIAS - 5 Strong Reasons Strong confluences on 1D time frame for the Bullish BIAS on this pair.
1- RSI divergence
2- Formation of HH and HL
3- Bullish Trend Line
4- Hammer Candle stick pattern formation
5- Double Bottom
we anticipate the market to remain in Bull phase.
Entry point is market with TP1 and TP2 as R:R of 1:1 and 1:2 respectively. Keep you Stop loss slightly below the Double Bottom (Support line)
Hammer Candlestick: Meaning and SignalsHammer Candlestick: Meaning and Signals
Technical analysis is a commonly used approach in the financial markets. It involves studying historical price data to make informed trading decisions. Among the various tools and formations employed in technical analysis, the hammer candlestick pattern stands out as a powerful tool. This article will delve into the meaning of the hammer candlestick pattern and explain how traders can interpret it on a forex, stock, and crypto* price chart.
What Is a Hammer Candle?
A hammer is a candlestick that is found on trading charts. It occurs at the end of a downtrend and acts as a bullish reversal signal.
To identify a bullish hammer candle on a price chart, traders do the following:
- Look for a significant downward movement: They begin by searching for a notable decline in an asset’s price.
- Observe the candle shape: The setup is characterised by a small body near the top of the candle and a long lower shadow. The lower shadow must be at least two times the length of the body. The colour of the candle doesn’t matter, but if it’s a green hammer candlestick, meaning it closed higher than it opened, the signal may be stronger.
- Analyse the context: Traders usually look for areas of support nearby as they may increase the setup's reliability.
Bullish Hammer Pattern: Trading Rules
Here are the common steps traders take when trading with a hammer:
- Confirm validity: Traders ensure that the hammer meets the criteria discussed earlier, such as a significant market decline followed by a candle with a small real body near the top and a large lower wick.
- Determine the entry point: Once the bullish hammer candlestick is confirmed, traders identify an appropriate entry point. Candlesticks don’t provide specific entry points. However, traders usually wait for the subsequent bar to close above and enter the trade if the market moves higher.
- Set stop-loss and take-profit levels: Traders place a stop-loss order below the low of the hammer to potentially limit risks. Traders determine a suitable take-profit level based on their trading approach, such as at the nearest resistance level or in accordance with the risk/reward ratio.
Trading Example
A trader spots a hammer on the hourly chart of the EURUSD pair. They wait for the candle to close above the hammer to enter the market. Their stop loss is below the hammer’s lower shadow, with the take profit calculated in accordance with the 1:2 risk/reward ratio.
How Can You Confirm the Hammer Candlestick?
Confirming the hammer candlestick pattern enhances the reliability of trading decisions. Beyond its basic identification, several techniques and indicators help validate its potential bullish reversal signal.
- Volume Analysis: A significant increase in trading volume during the formation of the hammer candlestick suggests stronger confirmation. Higher buying volume indicates heightened interest and participation, reinforcing the potential reversal.
- Support Levels: The presence of a strong support level near the hammer adds credibility to the pattern. Support levels act as psychological barriers where buying interest may increase, boosting the likelihood of a reversal.
- Subsequent Candlesticks: Observing the price action of the next few candlesticks after the hammer can provide further confirmation. A bullish candle closing above the high of the hammer enhances its validity.
-Double Hammer Pattern: While rare, a double hammer candlestick pattern where two candles appear consecutively can offer strong confirmation of a bullish movement.
- Trend Indicators: Utilising trend indicators like moving averages can help confirm the hammer. A rising moving average confirming the upward trend or a hammer forming in line with a broader trend adds weight to the potential reversal.
- Divergence: Identifying divergence between the price and momentum indicators, such as the Relative Strength Index (RSI) or Moving Average Convergence Divergence (MACD), can strengthen the pattern's reliability.
Hammer and Other Candlestick Patterns
Let’s compare the hammer to other candle formations you can spot on price charts.
Inverted Hammer
The inverted hammer is similar to the hammer but has a different appearance. It is characterised by a small body near the bottom of the candle and a long upper wick. The inverted hammer signals a potential bullish reversal as buyers start to gain strength and push the market up. The small body and small lower shadow reflect the rejection of lower prices, suggesting a shift in market sentiment from bearish to bullish.
Doji
In contrast to the red or green hammer candlestick pattern, the doji features a small real body with equal or close opening and closing prices and long upper and lower wicks. It represents market indecision, where neither buyers nor sellers have gained a clear advantage. While the hammer is potent during the downtrend, the doji can occur after both uptrends and downtrends, and it signals market consolidation or a potential trend reversal.
Shooting Star
The shooting star formation emerges at the top of an uptrend and suggests a potential bearish reversal. It is identified by a small real body near the bottom of the candle and a long upper wick, implying a rejection of higher prices and potential exhaustion of buying pressure.
Hanging Man
The hanging man emerges after an uptrend and suggests a potential bearish reversal. It resembles the hammer with a small real body near the top and a long lower wick, but the crucial difference is that it occurs in an uptrend. The hanging man implies that sellers are starting to exert influence, potentially leading to a reversal in the market.
Limitations of the Hammer Pattern
While the hammer is a valuable tool in technical analysis, it is not without its limitations.
- False Signals: It can sometimes produce false signals, leading to premature or incorrect trade entries. In certain market conditions, such as strong downtrends or highly volatile environments, the hammer may be less effective. Its success rate can vary across different assets and market scenarios.
- Dependence on Confirmation: The reliability of the hammer significantly depends on additional confirmation tools and indicators. Without these, alone it might not provide sufficient confidence for trading decisions.
- Short-Term Nature: The hammer primarily signals short-term price movements and typically can’t be used to anticipate medium or long-term price trends.
The Bottom Line
Successful implementation of the hammer formation requires experience, practice, and the use of additional technical analysis tools and indicators. Traders never rely solely on the hammer’s signals but integrate it into a comprehensive trading strategy.
FAQ
What Is a Hammer Candlestick?
A hammer is a specific setup found in charts that indicates a potential reversal to an uptrend. It is formed when a financial instrument opens at a certain price and experiences a significant decline during the trading period but eventually rallies back and closes near its opening price.
Is a Hammer Candlestick Pattern Bullish?
Yes, the hammer candlestick pattern is generally considered bullish. It signifies a potential trend reversal after a downtrend, as buyers enter the market and drive the price higher from its lows. The long lower shadow indicates that the buying pressure is strong and can potentially lead to further upward movement in the market.
Can a Hammer Candle Be Bearish?
A hammer candle is generally considered a bullish reversal signal, signalling a potential upward price movement after a downtrend. There is no bearish hammer. If the market continues to move lower after it forms, it just means that bearish market conditions were stronger and didn’t allow buyers to change market sentiment.
What Is the Hammer Candle Rule?
The hammer candle rule states that it must occur after a significant downtrend, have a small real body near the top of the candle, and feature a long lower shadow at least twice the length of the body. This pattern indicates a potential bullish reversal if confirmed by subsequent price action.
What Is the Hammer Strategy?
The hammer trading strategy involves identifying a candlestick at the end of a downtrend, confirming its validity with additional indicators or signals, and then entering a long position. Traders typically set stop-loss orders below the hammer's low and determine take-profit levels based on risk/reward ratios or nearby resistance levels.
*Important: At FXOpen UK, Cryptocurrency trading via CFDs is only available to our Professional clients. They are not available for trading by Retail clients. To find out more information about how this may affect you, please get in touch with our team.
This article represents the opinion of the Companies operating under the FXOpen brand only. It is not to be construed as an offer, solicitation, or recommendation with respect to products and services provided by the Companies operating under the FXOpen brand, nor is it to be considered financial advice.

$GRAB Long Term Trade IdeaTaxi and delivery service stocks all look bullish at the moment. Lyft and Grab are both a couple of my favorite longer term swing trade/investment plays just based off risk/reward and how beaten down both the stocks are.
If shown patience this trade could work wonders. I like it a lot because it gets me a little exposure to assets outside the U.S. and from a chart perspective its hard not to love a setup like this.
1. The buy side volume shown here is the highest its ever been for the stock by a long shot.
2. Price has been in a descending wedge type formation for several months now and is attempting to make a breakout, though this month's candle still has a lot of time left.
3. That hammer candle, especially considering it being printed on the 1M timeframe, is incredibly bullish in my eyes.
This chart reminds me a lot of NYSE:BABA but a bit earlier in its breakout stages. To me it is clear that accumulation has been taking place for over 2 years now and a big markup is upon us.
I have 3 take profit areas marked based off a few different Fibonacci levels I like that also have confluence with supply/demand dynamics present on the chart.
multiple daily/weekly candles below $4 could be a a good stop loss area as that would invalidate a lot of the bullish structure. Based off the current price this provides you with a minimum 2.75x RR trade and a maximum of 7x RR.
My average price is $4.25. Any pullbacks below $4.50 I will be looking at as great buying opportunities.
Will do my best to update this idea periodically over the next year or so.

How the Hammer Chart Pattern Signals a Market ComebackHello, Traders! 👋🏻
Let’s be honest — wouldn’t it be great if the market had clear signs that screamed, “Hey! The downtrend is over!”? Well, sometimes, it hints. One of those signals is the hammer candlestick pattern — a small but mighty formation that can indicate a shift in momentum.
But before you grab a hammer and start breaking things when the market dips, let’s talk about what this pattern really means. Is it a bullish hammer pattern, or is the market just playing games with your emotions? Let’s dive in.
What Is a Hammer Candlestick Pattern?
The hammer pattern is a single candlestick formation that typically appears after a downtrend. It has a small body and a long lower wick, showing that sellers tried to push the price lower but failed, as buyers stepped in and drove the price back up.
Imagine the market trying to take prices to new lows, but buyers show up and say, “Nope, not today!” That’s the essence of the hammer candle pattern — a potential sign of strength and reversal.
Key Features of the Hammer Pattern Candlestick:
✔ Small Candle Body at the Top.
✔ Long Lower Wick (at Least Twice the Size of the Body).
✔ Little to No Upper Wick.
✔ Appears After a Downtrend.
Sounds easy to spot, right? Well, not so fast. Sometimes, what looks like a hammer chart pattern might just be a random bounce. Context is everything.
The Inverted Hammer Pattern: A Bullish Twist
If the hammer candlestick pattern is the market’s way of pushing back against bears, its upside-down cousin—the inverted hammer candlestick pattern — is just as enjoyable.
The inverted hammer pattern looks like, well, a hammer flipped upside down. It has a small body at the bottom with a long upper wick, signaling that buyers attempted to push the price higher but didn’t fully succeed — yet.
While it still suggests a possible reversal, the inverted hammer pattern isn’t as strong as a regular hammer because it shows some hesitation from buyers. Think of it as the market raising its hand and saying, “I might be ready to reverse… but let’s wait and see.”
Why Do Traders Love the Hammer Trading Pattern?
Well, besides the fact that it looks kind of cool on a chart, it’s a psychological shift. It shows that buyers are fighting back, and if the momentum continues, a trend reversal could be on the horizon.
But here’s the catch — one hammer candle pattern doesn’t guarantee anything. Markets love to trick traders, and sometimes, a hammer pattern candlestick is just a temporary bounce before the trend continues downward.
So, next time you see a hammer chart pattern, ask yourself:
❓ Is This Really a Reversal, or Is the Market Just Messing With Me?
❓ Is There Enough Volume To Support a Strong Move?
❓ Are Other Indicators Confirming the Shift in Momentum?
Final Thoughts
The hammer trading pattern is one of those setups that traders love for its simplicity and reliability. But like any other pattern, it’s not a magic bullet — it’s a clue. And trading is all about putting the clues together to get the full picture.
So, the next time you see a hammer pattern candlestick, take a deep breath, check the context, and don’t rush into trades. After all, even the most substantial hammer won’t help if you’re trying to nail down the wrong trend.
What’s your experience with the hammer candlestick pattern? Let’s discuss it below!

Alvotech breaking out towards 16-18 levelAfter price broke out of the bearish line before and after making a hammer, it started a retracement.
My assumption is it will eventually retest the Weekly EMA 10 levels, which will serve as support.
Going long there (with the SL below the EMA 10) is a conservative way to enter the bullish trend.
We have measure the long wick/shadow of hammer to calculate the target price (12.57-9.15=3.42).
TP1 = 16 (3.42+12.6) handle and TP2 = 18 (old supply zone).
In terms of trade management, when TP1 is hit I would take profit on half of my position and roll my stop loss to breakeven, enjoying a risk free trade towards TP2.
There are 5.5 pips to be made (if this pair follows the script) and the trade has a reward – risk ratio of 9!

Job losses, Momentum, And The 3-Step SystemThe oil market prices have actually underperformed
Right now you should be looking into the equity markets
Instead of the crude oil prices.
You have this stock XOM NYSE:XOM as your opportunity to trade
Right now because the momentum on this
Stock is very low.
Right now yes the jobs numbers for this company
Are expected to drop in 2025
With the company planning to reduce its
Workforce but don’t focus on this negative sentiment
With this stock price, it’s a good time for you
To consider buying it, at the lowest momentum
It should be able to return you with at least 3%
In under a month depending of course
On the type of margin you decide to use
The process may feel like a burden but
You just need to be patient
As you undertake a risk management of at least
3 days to hold your position
Looking at this chart you can see the rocket
Booster strategy which has the following 3 steps
• The price has to be above the 50 EMA
• The price has to be above the 200 EMA
• The price should gap up in an uptrend
Now that you understand this strategy you
Can use it to understand the trend analysis of
Most equity stock prices
• Do you see that you don’t have to follow this negative sentiment?
• Have also noticed how the mainstream media is boosting this negative news?
• Have you seen that crude oil inventories have actually increased? As a result of the new policies or the latest economic news published by the US Government?
Rocket boost this content to learn more
Disclaimer: Trading is risky please learn risk management, and profit-taking strategies
Because you will lose money whether you like it or not.
Also, do not buy or sell anything I recommended to you. Please do your own research before you buy or sell anything.

QQQ shows a reversal is nearQQQ experienced a number of turning points showing increased weakness in the sell off we have been seeing over the past week.
False breakout to the upside
Strong growth in volume confirming the breakout direction
Hammer candle on close indicating reversal maybe coming after later day retracement
RSI breaks above SMA line for first time
This change in direction we have seen today with a new interest from the bulls shows that ever selling we experience going forward will likely be tested by the bulls again.
For trend traders I would recommend sitting on the side lines until we see a stronger trend form either to the up or down side. This current down trend is showing weakness.

SMH closes lower on Monday tradingSMH starts showing direction as to where it is going... down.
3 separate points paint a clear downward resistance trend line
rejected hammer candle gave way for more selling
RSI still continues to trend down on multiple timeframes
SMH is starting to show signs of downward trend forming
Putting on a small put position to close in mid October. May expand on position if trend continues.

Strong candle in tata motors Weekly chart of tata motors will gives as very good and strong movement . Hammer candle was made in support with heavy buying volumes .
Buy it on 1048-1070
Target 1120 1156 1180 1250
Sl 1020

Paramount (PARA) Flirting with Historical Support, Time to Buy?Hi Guys. As usual always on the lookout for Macro trend setups, signs and opportunities. PARA seems to be in a position of low risk trade setup.
We have made it to a Historical Support level, where interactions here normally leads to bounces upward.
Please note however that previous history does not mean it is 100% probable that it will repeat.
HOwever, being in a downtrend for some time now. It is likely that there maybe DEMAND in this area. Its important to watch for signs of confirmation of Support.
This weeks candle may show signs. It is a Hammer candle printing at the bottom of a downtrend since January. Lower wick indicates buy pressure or demand.
Notice ABOVE we have a resistance trendline. Note if we bounce from here, that will be our area to watch. This resistance trendline has been dragging us down since April 2022.
We could also be attempting to form a double bottom.
Recently there is also an uptick in VOLUME, which can indicate support of the demand currently seen at this support lvl.
Ive added 2 indicators.
MACD shows that we have not reached ABOVE the 0 lvl in quite sometime. Hinting to the idea that eventually we will.
Notice also the presence of Bullish Divergence with MACD and price action.
Watch for the change in color of the histobars to light red. This will suppport the idea of waning bearish momentum. The presence of a bullish cross is also vital to watch for.
Now notice RSI. Our current RSI as indicated by orange circle, shows flattening of the RSI. This shows buying is stalling the sell off.
However, notice the rectangles highlighting previous flattening of RSI. There is a possibility of RSI continuing downward. An important sign for the RSI in my opinion would be if RSI can move above the resistance trendline. This thinking ahead, can coincide with breaking the Major resistance in price action.
Regardless of what happens, right now we are in a critical area and pushes for observation.
__________________________________________________________________________________
Thank you for taking the time to read my analysis. Hope it helped keep you informed. Please do support my ideas by boosting, following me and commenting. Thanks again.
Stay tuned for more updates on PARA in the near future.
If you have any questions, do reach out. Thank you again.
DISCLAIMER: This is not financial advice, i am not a financial advisor. The thoughts expressed in the posts are my opinion and for educational purposes. Do not use my ideas for the basis of your trading strategy, make sure to work out your own strategy and when trading always spend majority of your time on risk management strategy.

GOLDEN STAR|GOLD, Price return to the previous high.2090$.The four-hour time demand area has done its job well, and despite the hammer candle and BOS formation, it has started to grow from this area.
-In its movement path, the only resistance area ahead is the price range of 2070 to 2075, which is now invalidated by the closing of the 1H candle above the previous high.
-In the continuation of the movement, the supply area is no longer visible and we can see the price reaching the levels of 2085 and 2090.

Bitcoin ($BTC) Safeguarding The UptrendBitcoin continues to trade above the $34,000 mark, with the overall trend remaining bullish. Formally speaking, BTC is currently experiencing a sideways movement between the buyer's level at $33,400 and the seller’s level at $35,100, indicative of a temporary equilibrium in force.
Considering the upward trend apparent in BTC’s chart, growth continuation is presently the main focus. Potential next targets for buyers could be the levels at $36,100 and $36,900.
Simultaneously, it is crucial to acknowledge that Bitcoin has been on an upward trajectory without undergoing any corrections for over two weeks now. A course correction before a continuation of the growth would be entirely reasonable and could even serve as a strategic advantage for accumulating long positions in BTC. In this scenario, the asset could retreat to the support levels of $30,700 and $29,900, which remain within the boundaries of the prevailing upward trend.
For buyers, any market corrections will remain safe as long as the long-term support level at $27,000, safeguarding the uptrend, remains unbreached.
However, the candlesticks are depicting the Hammer-like shape indicating signs of a Bullish trend incoming.

Hammer of Trend ChangeThe Hammer and Inverted Hammer candlestick patterns, two powerful tools adept traders employ for reversals.
If you appreciate our charts, give us a quick 💜💜
Here’s what you need to know:
1. Understanding the Essence:
Hammer: This pattern typically emerges at the culmination of a downtrend, indicating a potential bullish surge. Its small body and extended lower wick signify the bears' struggle to maintain lower prices.
Inverted Hammer: Contrarily, this pattern usually appears at the end of an uptrend, foreshadowing a possible bearish move down. Its small body and prolonged upper shadow denote the weakening grip of the bulls.
2. Decoding the Signals:
While Hammers don’t provide direct trading signals, they suggest a shift in momentum. Traders often see them as a sign of potential upward movement after a downtrend.
Inverted Hammers, appearing after an uptrend, hint at a potential reversal. The failed attempt by the bulls to sustain higher prices signifies a looming bearish sentiment.
3. Crafting Your Strategy:
When dealing with Hammers, traders might enter immediately after its formation or wait for confirmation with a bullish candle. Setting a stop-loss just below the recent low and targeting a significant resistance level is a common strategy.
For Inverted Hammers, a similar approach can be employed, focusing on prior support-turned-resistance levels. Vigilance and additional technical analysis are crucial for accurate predictions.
4. A Word of Caution:
While these patterns are robust, they should never be sole trading indicators. Combining them with other technical tools enhances accuracy and confidence in your trades.
5. Practice and Precision:
Prior to real trades, practice these strategies on demo accounts or paper trading. Platforms like TradingView, Vestinda and others like MetaTrader offer a conducive environment for refining your skills.
Incorporating Hammer and Inverted Hammer patterns into your trading toolkit empowers you to detect potential trend shifts. Remember, in trading, nuanced insights can translate into significant profits. Happy trading!

eur usd falling wedge pattern euro dollar is coming down since dollar has been strong
price is making lower low with lower high a perfect down trend until it ends
price action has also made falling wedge chart pattern now testing lower white trendline with hammer candle stick
today fed speech big news

HD swings look solid this week!AMEX:DIA looks solid, HD is one of there holdings. Closed last week with a hammer on the weekly. I like the 305-310C for 7/21. Let me know your analysis on HD this week!

PacWest - Bollinger Bands breakouton 5 min time frame, using indicator BB with RSI, entry taken as per Divergence, movement confirmation with Stoch RSI, Heikin-Ashi, Gap up opening confirmed reversal to the price calculated earlier on weekend for price to open @ $5.50 wherein pre market showed jump in price due to dividend cut decision by bank to -96%, total duration of trade is around 1 hr 30 min. Was able to achieve target defined with almost 14% gain. Closed the trade as per candle confirmation (hammer candle formed at the bottom - which gave upward confirmation to closed the trade.

pattern tradebearish reversal if double top formation completes, trading on nifty 50, with pattern and candles. 20-30 pts. target in every trades. scalping with small points

Aditya Birla Fashion & Retail Ltd - 13.04.2023Aditya Birla Fashion & Retail Ltd - 13.04.2023
The stock price is above EMA in Daily Chart.
There is a MACD Bullish Divergence in Weekly Chart.
There is a Stochastic Bullish Divergence in Weekly Chart.
The stock can be considered for further upside movement with SUPPORT @ 218
A probable trend reversal candidate.
Watch out for the price action.
DISCLAIMER: This is not a Stock Recommendation.

AAPL bullish hammer at the beginning of wave 3 uptrendAAPL bullish hammer at the beginning of wave 3 uptrend don't hold over earnings.

ABBV daily bullish hammer beginning of wave 3 wave 5 uptrendOrder BUY ABBV NYSE Stop 145.78 LMT 145.78 will be automatically canceled at 20230401 01:00:00 EST
ABBV daily bullish hammer beginning of wave 3 wave 5 uptrend that was ABC correction.
