Are we really see a reversal? this might be bulls only chance!!!We might see a reversal thanks to the hammer candle... good time to long, we might (only might) break the resistances, this might be the only bulls chance xd...
With a rising volume..
below 10057 will be bad for this.
I'm not entering new positions yet.
Hammercandle

TSLA hammer time.Lovely hammer on 200 MA support 15 minute chart
also Golden cross 50 MA over 200 MA

HMMJ - End of descending channel ?Looks like TSX:HMMJ is about to breakout of his descending channel but we still need more confirmation + daily close today looks really good (hammer).
Also, something I'm not familiar with enough, could this be an inverse H&S formation ?
Oh well, let's keep following this MARIJUANAAAAAA sector, a lot of promising stock at the moment.

Breakout **ON WATCH**2 consecutive daily hammers, and MACD positioned ready for strong breakout. ER Thursday. Watch for new candle to print above 1.47!

EOS Elliott Wave Theory (Revision)Looking back at my previous assumptions in regards to this Elliott Wave pattern and in combination with the Ichimoku indicator, I initially underestimated the depth of the correction and thought that we may have more support in the form of a Kijun bounce before making a move into the cloud and a potential edge to edge move once within the cloud.
While still learning many aspects of Elliott wave theory, I believe that the ABC corrective move could now be complete. In an ABC pattern, Wave C can typically be 123% – 161% of wave AB which looks to fit into the current fibonacci measurements well.
This week's candle is forming a bullish hammer reversal pattern. In the medium term, I think a move into the cloud and a subsequent edge to edge move within the cloud is still possible with a price target around $12.23. This price target is represented by the long, flat top of the kumo cloud which acts like a magnet. The longer the flatness of the Kumo, the more powerful it is as a support or resistance level and the more powerful this Kumo magnet becomes.

TPX could bounce Technicals
RSI(10) @62 reaching for higher highs - OBV confirming trend
ADX (directional index) on a continuing positive trend
We see a very bullish move, as a hammer candlestick is formed at the 61.8% retracement level.
-----------
This is happening as the market as a whole is on a rally.
I would wait to see if we can break $68 (heavy resistance) on Monday.

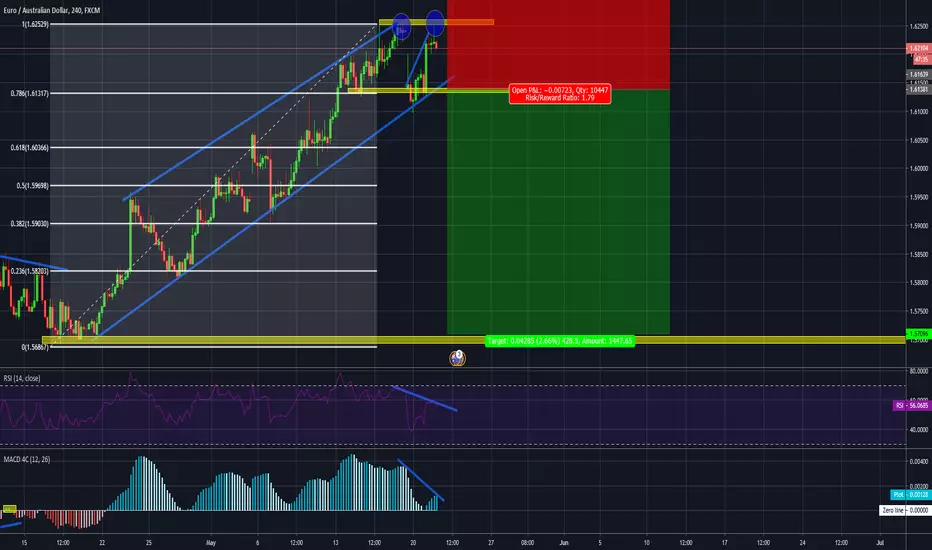
EURAUD for sell now or wait until priceThe Price has rejected the resistance zone twice, one with a reflective candle and the other one with a hammer candle.
The 2 scenarios rely on waiting for the Price to break the trend line or sell now given the ascending wedge.
RSI and MACD shows change of trend
hammer dailyGoes Ex-div on 17th, w/ .9 divi
Good probability of hitting 50-61.8% retrace off of daily hammer on support. Target profit of 6.37-7.5% w/in 2 weeks.
Just raised divi from .8 to .9

DKS - Hammer pattern reaching supportMay 2nd: DKS reached SMA(100) support line forming a Hammer candlestick.
Technical information:
RSI(14) @39
CCI(10) @-100
Support: 32.46
Resistance: 39.4

HKEX:1571 potential profit 21%HKEX:1571 is going to break through a strong resistance level at 3.07, which will also formed a double bottom. As it can stand on the high volume close price with a hammer candle pattern. MACD will also help for this break through as both fast and slow line are above 0. The first target will be the target of the double bottom and also the top of the last downward wave. ADX is also have a positive indication of ADX > 20 and +DI > -DI
Cut loss @2.78
Target @3.69
Buy in current price

Buy EURUSD (Daily Candle)in Daily chart :
Hammer candle stick pattern.
Regular Divergence
> Buy
Entry : 1.1202 (Now)
Stop : 1.1160 (42 pips)
TP1 : 1.1280 (78 pips)
TP2 : 1.1400 (200 pips)

Buy GBPJPY (Daily)in Daily chart :
Inverted hammer candle
Support level at 143.8
Hidden divergence
> Buy
Entry : 144.00
Stop : 143.70 (30 pips)
TP1 : 145.20 (120 pips)
TP2 : 146.00 (200 pips)
in 4H chart :
Hidden divergence

EURCHF BUY at 4H - RSI divergence at important levelwe are looking at a possible rise of price action because of the RSI divergence at an important monthly structure level.

Buy RWCDue to oversees market the ASX should be opening higher this morning form yesterday pull back. This is why i'm looking at consumer cyclical stocks, RWC gap down yesterday to its support level and formed a bear hammer I wish it was a Bull hammer but this is fine as well. It sitting outside its 2 deviation, looking to counter trade this stock to $4.40. It also at its C wave with Elliot wave theory.


Buy EHL Due to oversee market the ASX200 should be pointing higher this morning. This is why i'm looking to buy EHL, it has formed a bearish hammer on support and with the Elliot wave theory its on C wave. With EMA on the daily chart, the 13 and 50 EMA its on downward trend same with the MACD. Same goes with the weekly chart, therefore we go see a bounce off on this level.

TGT: Bullish Breakout on Seasonal Holiday EarningsTarget showed me all the ways to make money today. I took a small scale in a few days ago anticipating a good response to holiday earnings after they had a relatively lukewarm rebound from the late 2018 correction. Seeing the traffic at my own local Target, I was certain they would exceed expectations and they lived up to my hopes and more. After hours trading today was slightly down, but I expect this as some long term HODL'ers are finally realizing some profit, so there will be probably be more attention and buying for this household brand. I'll scale in and gradually ease my stops up to retain made profits at it rises. The profit taking found plenty of willing buyers, though, with the chart showing a black hammer doji that's a mild bullish signal with breakout confirmation needed in the coming days.
For technicals, a MACD has been positive but flat for some time with the histogram only now breaking out bullish. ADX is low but pulling upward suggesting a coming upward price trend with DI+ above DI- for a few weeks and diverging strongly with DI- crossing below ADX as a potential buy signal. RSI is breaking above 60 but still below 75 so there's still time to hop on board if this only going to be a short lived price trend, but this shows signs of a contrarian pull back upward from the trough of the recent market wide corrections.
This is likely to run up to 80 before really hitting it's first major resistance level and onward to 88 if it can sustain upward momentum long term. Expect a stair stepping pattern upward as well as watch close competitors like KSS and WMT and GPS and others to gauge sector and industry correlation.

HAMMER ON DAILY CHART AT RESISTANCEThere seems to be a hammer on the daily chart on resistance showing rejection from the upside, and could be a potential good opportunity to sell the CADJPY.

NDLS for the studentSpring semester is upon us... Could this be a strong bounce, or a slow and confusing moment? Hammer head forming today with a strong resistance level at 7.56, would ideally like a good reversal up to 8.40, I guess I'll sit and wait to see what happens now. uc.


Medium Term Buy on FirstSource Solutions Ltd.FirstSource Solutions Ltd. is Buy with a target of Rs. 66 and Stop Loss placed at Rs. 42.
On Technical Charts FSL has created double bottom at 46-47 levels with hammer and one white soldier pattern and follow up buying also confirmed its bullish reversal.
So one can buy FSL at current levels with stop loss suggested for a period of 3-4 months of positional call.
If anyone interested in more such fundamental and technical calls please visit our website wp.me

EUR/CAD LongHey traders,
Here on the EUR/CAD we have the following reasons to go LONG:
Daily Chart:
- Bullish Trend
- Near Daily Support Level (higher low of the trend)
4h Chart:
-Bullish Engulfing Candle/ Hammer Candle
GO GREEN!

Buying after the huge hammerGetting in after the strong down move and as the big hammer on H4 was formed.
1)The stop loss is under the hammer low.
2)Profit target is based on the technical structure.
