Long trade in Network 18Price is taking support on Rising 44 SMA which works as strong support and forming hammer. Also Rising 44 SMA shows bullishness in stock. We can make bullish trade Buy above the high of 92 Stoploss below the low of 85 and target near previous high of 111
Hammercandle

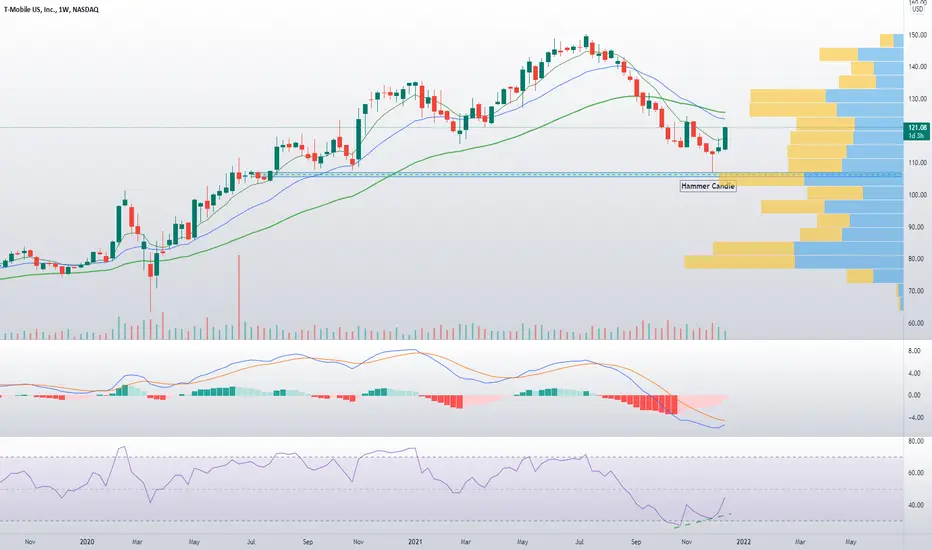
$TMUS Weekly updated T Mobile swing trade working, JAN 120calls up 18% now . Should have loaded more after hammer candle but had plenty of risk on already.
Momo turning with weekly MACD ready to cross (bullish confluence).
Want to see continuation and EMAs to cross, also need to chew through overhead $124 supply. If this holds will expect another leg up. Been anticipating a "NKE like" move since NOV.
Good ER and plenty of tutes buying thinking Q4 - Q1 2022 ripper.
$124 first PT then see how price action is at that level.
Trade remains valid so long as higher lows are put in.
NZDJPY LONGhammer pattern is forming on daily chart. Price have also rejected 50% daily Fib level. BB on the lower band.

$ZNGA Zynga Inc. LONG Trade SetupNice bullish divergence in the daily and a beautiful hammer candle with high volume.
You find the trade levels in the chart.

Learn To Trade Technical Analysis Hammer & Shooting StarHey Traders today I wanted to go over what I believe is one of the best ways to trade any market with Japanese Candlesticks using hammers and shooting stars. Normally you want the wick of the candle to be at least twice the size of the body of the candle. Alot of times they can lead to explosive moves in the markets. So lets dive in and see how to use this powerful technique in your trading arsenal.
Enjoy!
Trade Well,
Clifford

Observing Stock Market with Yearly CandlesThis is an Observation i am making of regardless of if i am right or wrong about it.
SPX printed a Beautiful Hammer candle :
As Very bullish Hammer Candle was printed by SPX so that means Should we really expect a huge pullback or drop/crash in near term future ? I think not. Highly unlikely.
One factor why This Supercycle Wave 5 of SPX is not finished or has plenty room to run is because of Duration of Wave 5 is nowhere near comparable to Wave 1 and Wave 3.
Wave 1 and Wave 3 have spend 52 Years in Wave 1 Bull cycle and 58 Years in Wave 3 Bull Cycle.
So at the very least Wave 5 should last as much as 30-40 Years or so.
Another factor is that Wave 5 can get really extended and we can for minimum expect Wave 5 to give Wave 1 equal gains or even more so.
Therefore, it can be said using this simple observation we shouldn't expect crash anytime soon. Pullbacks happen but overall Stock Market is very bullish for foreseeable future.
Any sort of feedback from TradingView Community would be appreciated.


Tatamotors LongTatamotors Long
Hammer pattern candlestick found at 200 day EMA
Buy at CMP- 288
SL- 268
Target- 305, 324
Disclaimer- We are not SEBI registered advisor.
Charts and views are only for educational purpose.

$BTCM WeeklyNotes in the chart. Barring any overly bearish market weakness, technically BTCM has one of the best setups going into the next few weeks.

$SPY Call Reversal LottoLotto time
Closed contracts this morning +30%
Reentering here with same hammer pattern as yesterday on 1 hour.
High Risk Lotto trade

$SPY updatedTaking profits at +60% on spy calls and setting trailing stops
452 target hit... hammer candle signaling reversal worked beautifully

$SPY weekly lottoSPY swing lotto 9/10 $450 call after this mornings' flush entered after confirmed green candle following hammer candle on 1 hour.
Break below 449 invalidates trade, target 452+

Silver Dec LongSilver Dec Long
2 Doji and Hammer Candle at medium term trend line
Buy at CMP- 63090
SL- 62820
Target- 63390, 63500, 63700
Disclaimer- We are not SEBI registered advisor.
Charts and views are only for educational purpose.

Hammer Time!BTC is still bullish, that was just a shake out. We have a nice hammer that should hopefully bring us back up! This is not financial advice.

NICKEL Sep LongNICKEL Sep Long
Buy at CMP- 1412
SL- 1405.5
Target- 1421
Disclaimer- We are not SEBI registered advisor.
Charts and views are only for educational purpose.

SILVER Long on the Day - Possible HigherHeres my level for today, Do proceed with caution as silver need to afloat above 23.5 in order to atttain bullishness
Remember we have a Hammer on Gold Weekly Chart Waiting for activation and DXY is shaky as Tappering Hope looking dimmer.

$TSLA hammer at 200day and 50daytoday was a big flush. However looking at the big picture this is a nice place to bounce. Some people's fib saying this is 50% level. Mine says 38.2% level. Whichever the case, if you are bullish this is not a bad place to add.

$QCOM filled gap and made a hammerbullish breakout and retest.
semis have also been breaking out and holding the retest $SMH $SOXL

2.29R USDZAR Entry Price 14.13530USDZAR Close Price 14.13530
USDZAR EMA 10 Close Price 14.08147
USDZAR EMA 20 Close Price 13.99052
USDZAR Fibonacci Retracement Level 23.6% Price 14.15898
Pin Bar (Rejection Candle) is at a higher low position.


