Nasdaq is going to hang it selfCircled area is called hanging man. Sometimes it means that market is changing direction.
Hanging Man

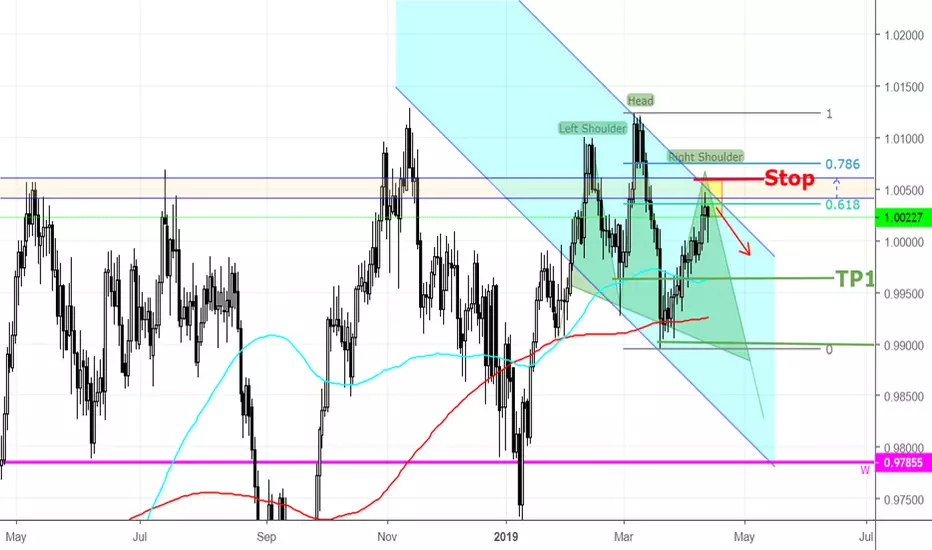
Sell USDCHF (Daily Candle)in Daily chart :
Handing Man candle stick pattern
Top of the bearish parallel channel
Head and shoulders pattern
61.8% fibo retracement
> Sell
Entry : 1.0022
-Stop : 1.0058 (36 pips)
-TP1- : 0.9960 (82 pips)
-TP2- : 0.9900 (122 pips)
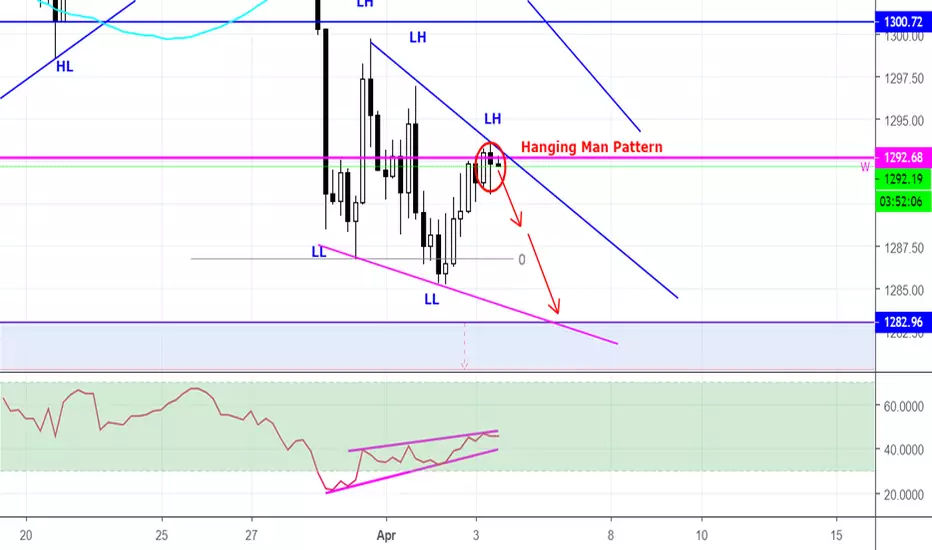
Sell XAUUSD (4H)in 4H chart:
Hanging Man Pattern
Downtrend line
Hidden divergence
> Sell
Entry : 1292.30 (now)
Stop : 1294.00 (7 pips)
TP1 : 1288.50 (40 pips)
TP2 : 1283.00 (95 pips)

GBPCAD Weekly Candle.. Hanging man??Gbpcad weekly candle.. Guys please comment.. Do u guys think this is a potential bearish hanging man pattern?

EurCad Double Top happy weekend friday tradelittle bit harder to see here, this is good example of using line chart to make market structure more clear
turn line chart on and clear double top happens, trade entered after hanging man signal during NY/London close push
great reaction in recent past from this supply zone, strong pushes away and comes back to fill more orders at end of week
overall trend is short from powerful move some days before


Potential Reversal Coming Soon but we might see some more upsideThis market rally has been insane!!! with several consecutive weeks going up nonstop (got to admit it is starting to hurt me a little), but we might see a reversal in the next few weeks. I would NOT say a reversal is imminent as there needs to be a catalyst to trigger a sell-off and the market only seems to be going up based on China-US trade hopes and the Federal Reserve 180 turn and completely ignoring all the bad data that has popped in the last few weeks.
With that said, we finished this week with a hanging man candle showing on the weekly chart which is indicating that there might be some sellers out there and that the buyers might not be willing to push the market much further. I still see some room to the upside to around 2811-2836, but there has to bee some sort of extraordinary event in the next weeks to push the market up to the 2870-3000 levels (I think odds highly favor a pullback).
On a daily timeframe there RSI is giving overbought signals and the MACD has already diverged and started to cross the signal line. We still have to see what happens next week but I feel the current state of the market is very fragile and when it breaks it will break hard.


Short DXSThis Aussie stock on the daily and the weekly have formed a bearish hanging man, my entry will be a sell stop at 11.52. Also its sector had massive rally up, we might see a pull back to the downside today.

Nifty Forms A Hanging man candlestick pattern!!Hanging Man Bearish Candlestick!!!
The higher the trading volume and the longer the lower wick relative to the body, the more bearish the hanging man.
When the high and the open are the same, a bearish Hanging Man candlestick is formed and it is considered a stronger bearish sign than when the high and close are the same, forming a bullish Hanging Man (the bullish Hanging Man is still bearish, just less so because the day closed with gains).
Game over for the bulls? lets wait and watch tommorow.

S&P Hanging manTypycal candlestick formation after a decline, yet if it is inside bundaries is not clear. Maybe it is testing resistence, who knows, only the future will tell.
$SPX $Hangingman

AAPL analysisHanging man spotted,
Expect it to go to 170 level,
If the price level falls below that, expect to go to 164-165 level.
This is not a financial/trading advice
cryptovan168

Bitcoin Daily Update (day 247)I believe that it is possible to beat the market through a consistent and unemotional approach. This is primarily achieved through preparing instead of reacting. Click here to learn more about how I use the indicators below and Click here to get my complete trading strategy! Please be advised that I swing trade and will often hold onto a position for > 1 month. What you do with your $ is your business, what I do with my $ is my business.
My recent Bitcoin Bubble Comparison - 3 Day Chart led to the following calls: < $5,750 by 11/15/2018 & my prediction for the bottom is $2,718 by 1/20/19 | My Bitcoin Bubble Comparison - Monthly Chart closely mirrored my price and time targets | Calling for $35 ETH before the end of 2018.
Previous analysis / position: “...everyone foaming at the mouth after the daily candle closed +1.5%. That was an unimpressive move and it came on low volume” / Short USDT:USD from 0.968 with order 0.97 to close
Patterns: Testing phase 2 of hyperwave
Horizontal support and resistance: S: $6,360 - $6,380 | R: $6,400 - $6,427
BTCUSDSHORTS: Still falling toward support | TD’ shows two days left to the downside
Funding Rates: Longs will pay shorts 0.05% | This is what I am waiting to see...longs get very expensive and btcusdshorts’ at support
Short term trend (3 day MA): Cross above 8 & 34 with price below = neutral
Medium term trend (8 day MA): Starting to turn up, crossing 34 would be very important for bulls
Long term trend ( 34 day MA): Still angled down, one of the main reasons I am a bear and look for shorts in this area
Overall trend: bearsih
Volume: If you thought yesterday’s volume was unimpressive then todays was even less so (below MA)
FIB’s: (Using Oct 15th candle) 0.5 = $6,483 | 0.618 = $6,405
Candlestick analysis: Daily hanging man | 12h hanging man both right on the trend resistance
Ichimoku Cloud: Tried to re enter 12h cloud and failed
TD’ Sequential: 12h has a red 1 and 2 that were very close to being 7’s and 8’s. If they would have close a few dollar higher then this topped on a 24 hours ago.
Visible Range: Still below the point of control (POC)
Price action: 24h: -0.4% | 2w: -0.2% | 1m: -2.74%
Bollinger Bands: Still hasn’t tested top band
Trendline: All eyes on the resistance from the bear trend. If we don’t breakthrough on high volume then I expect phase 2 to break down.
Daily Trend: Bearish
Fractals: Last move didn’t break up fractal, making that move even less impressive
RSI: Watching to see if daily stays > 50
Stochastic: Daily still has room to the upside
Summary: That pump did not break the most recent up fractal, it came on low volume and we failed to even test the top of the daily Bollinger Band. Longs are getting expensive and BTCUSDSHORTS’ are falling towards support.
The daily candle also just closed a hanging man. In my mind it is highly likely that the bear trendline is going to hold as resistance and that is going to lead to a breakdown of the phase 2 hyperwave trendline.
If phase 2 doesn't hold then the target is phase 1, based on the rules of Tyler Jenks' hyperwave.
All of that being said I still think it is a little too early to re enter my short position. It looks like there is still plenty of support left from $6,360 - $6,380 and I am going to wait to see how the price reacts when/if we retest it.
Another 24 - 48 hours of consolidating inside a ~$50 range seems most likely from here. That should give us plenty of time to watch how the traditional markets react to the election.


Bitcoin Daily Update (day 201)I believe that it is possible to beat the market through a consistent and unemotional approach. This is primarily achieved through preparing instead of reacting. Click here to learn more about how I use the indicators below and Click here to get my complete trading strategy! Please be advised that I swing trade and will often hold onto a position for > 1 month. What you do with your $ is your business, what I do with my $ is my business.
My most recent Bitcoin Bubble Comparison led to the following predictions: 1 day - 28 days = < $5,750 | bottom prediction: $2,860 by 10/30
Previous analysis / position: “This is where the risk:reward is what you should be thinking about. If it breaks through the trendline then exit the position. However if it gets rejected then it should sell off hard and fast.” (referring to ETH) / Short ETH:BTC from 0.03143 | Short ETH:USD from $211.96 | Short EOS:ETH from 0.0252326
Patterns: Descending triangle
Horizontal support and resistance: S =$6,443 - $6,459 | R = $6,494 - $6,514
BTCUSDSHORTS: Still fitting into a bull flag.
Funding Rates: Shorts pay longs 0.0028%
12 & 26 EMA’s (calculate % difference): Unable to support above 12 EMA, now it is acting as resistance. 26 = -1.87%
50 & 128 MA’s: 50 = -3.85% (angling down sharply which indicates it will be strong resistance) | 128 = -7.29%
Volume: Price continues rising on low volume
FIB’s: 0.618 = $6,637 | 0.786 = $6,414
Candlestick analysis: Daily hanging man forming. Watching weekly candle to see if it can retrace > /= 50% of last weeks candle.
Ichimoku Cloud: 4h cloud continues to act as resistance. Thick cloud with flat top indicates strong resistance from $6,523 - $6,778
TD’ Sequential: 12h on green 9 at horizontal resistance after a hanging man. Daily green 5. Weekly Red 2 never got below Red 1.
Visible Range: Looking back to February when we have continued to test this price makes the most sense and it shows the point of control at $6,514 and a high volume node up to $6,724
BTC’ Price Spreadsheet: 12h = - | 24h = -0.55% | 1w = +3.76% | 2w = -10.7% | 1m = +2.43%
Expected to test MA at $6,725 after bouncing from bottom band
Trendline: Top of descending triangle = $6,925
Daily Trend: Chop
Fractals: Up = $7,475 | Down = $6,065
On Balance Volume: Starting to move downward. If it creates a lower low that would be a bear div’ on the daily.
ADX: Indicates no trend
Chaikin Money Flow: Starting to turn over on the daily.
RSI (30 setting): W = 48.98 | D = 46.5
Stoch: %K testing %D on the daily
Summary: The market is showing significant signs of a top with the 12h red 9, daily dojis at resistance and today’s candle creating a lower low than September 14th. The BTCUSDSHORTS’ are posturing to breakthrough the all time highs similar to what ETHUSDSHORTS did last week.
Continuing with the common theme I will be watching BTC’ and trading ETH’. As mentioned above and in yesterday’s post ETH:USD and ETH:BTC are testing the 6 week bear trend line. That represents a good risk:reward opportunity for short sellers. If the trendline is broken then you can exit at a small loss. However if it hold then swing targets are $104.69 and 0.022 respectively.
EOS:ETH and EOS:BTC are both still at the top of my most overvalued coins in crypto. I was paying close attention to the ETH’ pair last night to see if it would break 0.0253 and I recommended that as an area to reduce position size or close out entirely. As it stands we found resistance at 0.0251 and the push back is forming a bearish wick/shooting star.
Order remains set to short EOS:BTC at 0.0007474. Click here to read my analysis on EOS’.

Bitcoin Daily Update (day 185)I believe that it is possible to beat the market through a consistent and unemotional approach. This is primarily achieved through preparing instead of reacting. Click here to get my complete trading strategy and click here to learn more about how I use the indicators below! Please be advised that I swing trade and will often hold onto a position for > 1 month. What you do with your $ is your business, what I do with my $ is my business.
1 day - 3 day: short squeeze/test top of triangle at $7,500 -$7,650 | 3d - 1 week: Retest $6,000 | 1 month predictions: < $5,750 by 9/24 | bottom prediction: $3,000 by 10/30
Previous analysis /position: Preparing to enter short, lined out four confirmations for entering / sidelines
Patterns: descending triangle
Horizontal support and resistance: $6,940 support appears to be breaking down and turning into resistance. Next support = $6,800
BTCUSDSHORTS: Has almost fully retraced while the price of Bitcoin’ has barely budged.
Funding Rates: Longs pay shorts 0.01%
12 & 26 EMA’s (calculate % difference): +0.67% | bullish crossover did not amount to anything
50 & 128 MA’s: 50 MA = -1% & back on top of price | 128 = -5.56%
Volume: Has not exceeded MA throughout this squeeze.
FIB’s: 0.618 = $6,895 | 0.786 = $6,509
Candlestick analysis: 2 hanging men
Ichimoku Cloud: Daily and 12h cloud held as resistance. 12h cloud breakdown could provide an entry.
TD’ Sequential: G9 < G6, G7, & G8. If > then would be perfected. When 9 is lower than 7 then it will often lead to a new countdown to the upside.
Visible Range: Low volume node at $7,200 tells seems like a good spot for one last short squeeze.
BTC’ Price Spreadsheet: 12h = -1% | 24h = +0.87% | 1w = +3.53% | 2w = +8.26% | 1m = -15.45%
Bollinger Bands: Weekly MA = $7,379 and should be strong resistance | Daily MA = $6,589 and is expected to get retested after pulling back from top band.
Trendline: Connected August 22nd to August 26th and it was violated yesterday
Daily Trend: Bearish
Fractals: DOWN = $6,212 | UP = $8,312
On Balance Volume: Weekly just created a higher high for a bull div’
ADX: ADX is at a major level of support which indicates that major volatility is on the horizon
Chaikin Money Flow: Will it get rejected at 0.05 or provide a buy signal?
RSI (30 setting): W = 49.73 | D = 50.30 | weekly crossing + CMF' breaking through 0.05 would be significant
Stoch: Pulling back on daily, plenty of room to go on 3d
Summary: Am waiting patiently to see if we get one last squeeze to $7,200 which would put us at a major resistance cluster. If that happens then I would expect it to occur in the next 12-24 hours. CBOE' options will get covered today and after that demand is satisfied I expect a breakdown to follow. If the price of Bitcoin’ is > $6,000 on Tuesday then I will be very surprised. As I am writing this ETH:BTC appears to be breaking down 0.04. Take a look at how hard it fell in December 2017 when it last broke down that support. ETH:USD is also on the verge of breaking down it's bear flag with a $115 target. My sights are set on opening large shorts on each.
“Don't fire until you see the whites of their eyes” -Col William Prescott

Bitcoin Daily Update (day 184)I believe that it is possible to beat the market through a consistent and unemotional approach. This is primarily achieved through preparing instead of reacting. Click here to get my complete trading strategy and click here to learn more about how I use the indicators below! Please be advised that I swing trade and will often hold onto a position for > 1 month. What you do with your $ is your business, what I do with my $ is my business.
1 day - 3 day: short squeeze/test top of triangle at $7,500 -$7,650 | 3d - 1 week: Retest $6,000 | 1 month predictions: < $5,750 by 9/24 | bottom prediction: $3,000 by 10/30
Previous analysis /position: “Due to green 7 on TD' Sequential I am expecting two more days to the upside and will be crossing my fingers for a 9 at resistance combined with a reversal candle to provide a perfected entry.” / sidelines
Patterns: Descending triangle
Horizontal support and resistance: R: $7,150 | S: $6,800
BTCUSDSHORTS: Have pulled back 32% while price only bounced while price is only +1.1% since short squeeze.
Funding Rates: Longs pay shorts 0.0116%
12 & 26 EMA’s (calculate % difference): 12 & 26 = + 1.18% | If price breaks down EMA’s it would be a good confirmation to enter a short.
50 & 128 MA’s: 50 = -2.20% | 128 = -7.05% | breaking down 50 MA is very bearish
Volume: Still significantly lower than average. Watch for it to pick up drastically if/when we break down $6,800.
FIB’s: 0.618 = $6,895 | 0.786 = $6,509
Candlestick analysis: Hanging man + tweezer top confirmed
Ichimoku Cloud: Held as resistance, back in fully bearish territory. Unresolved c clamp on weekly.
TD’ Sequential: Daily G8
Visible Range: $6,368 remains the crucial area of support as it is the point of control over the last 6 months.
BTC’ Price Spreadsheet: 12h = -2.84% | 24h = -3.56% | 1w = +4.76% | 2w = +4.86% | 1m = -16.62%
Bollinger Bands: Expected to retest Daily MA at $6,532 after pulling back from the top band.
Trendline: Connects Aug 22nd - Aug 26th and is currently being violated
Daily Trend: Bearish
Fractals: Down = $6,230 | UP = $8,314
On Balance Volume: No div’
ADX: ADX found support at 15, indicating that we have ranged for long enough and should start to trend again soon. -DI and +DI converging, expect them to cross in the next week.
Chaikin Money Flow: This thing has been all over the place and I have not found it useful at all over the past couple weeks. Bull div’ then bear div’ now bull div’ on daily. Massive bull div’ on weekly has become a very significant bear div’.
RSI (30 setting): W = 49.6 | D = 49.67
Stoch: Sell signal on daily. 3d shows plenty of room left.
Summary: Looks like we are just going to miss the perfected entry that I was hoping for yesterday. Instead we got a hanging man + a tweezer top which provided a low risk entry yesterday. Unfortunately I was on the golf course and unable to sell once the current candle traded below yesterday’s HM.
Now I am thinking today will be a great time to open a short and tomorrow/this weekend will be the time to add to it (if and only if it is moving in our favor).
I will be watching for the following and entering my position in quarters following each confirmation:
Bounce from $6,800 support creates lower high below $7,128 or a double top.
Breaking down $6,670 would make for a very bearish weekly candle and would firmly put us back below $6,800 resistance.
Breaking down $6,368 puts us back below the point of control on the visible range volume profile when looking back 6 months.
Taking out 2 week lows at $6,179 would provide the final confirmation.
I will be watching Bitcoin’ for confirmation to enter and then I will be shorting ETH. When/if it breaks down $260 I am expecting it to get ugly.
As is stands right now I would be placing stops right above yesterday’s high.

SPX Imminent retest of channel support: Rejection from ATHCompare to 6/14 Harami cross. Identical price behavior 8/21-23 c/w 6/12-14 and 8/7-9. Slapped down hard from high channel retest after 8/21 high.
All the Doji have been seen- pin bar, shooting stars, Harami crosses, engulfing bears, Red Shooting star today. Perfect setup for lower and soon- imminent.
Today I observed a bear flag all afternoon following the sharp intraday correction on 15m charts. Daily chart on 8/23 looks eerily similar to annual chart, past six months!
Expect a harder test than last time. Probably at least to 2791 as shown in graph, maybe lower; WS2 at ~2777. Gonna be a choppy week.
We have convergence of twin C waves bearing down from 08 Feb and 27 Jun A wave downspikes, rolling together now will bear down hard.
Batten down the hatches- good luck!
This isn't investement advice and I ain't no advisor. This post for amusement and education only. Enjoy!

US 30 Trendline Test Rejection: Imminent ThrowoverCompare/contrast to 11/12 June top and throwover. Bearish engulfing candle. Shooting stars. On intraday we saw hanging man twice, and shooting star in SPX 8/.21.
Expect imminent throwover to entry on wave C of ABC ZigZag correction pattern within days, after reaching all-time high on SPX 8/21, US 30 25888 at Fibo 0.786 from Jan 26 high. Target 23531.
Possibly one more rally attempt to trendline on 8/23, then swoon; or just start lower back down into Bear Flag channel now.
As always, this is not investment advice and all comments are only intended for education and amusement. Good luck!

Past history candlestick analysis for Hartalega
On March 8, 2018, an Inverted Hammer + Bullish Engulfing appeared, signifying a change to the down trend. This is further confirmed by the support line in blue.
Stock rallied for roughly a month plus until April 12, where a Hanging Man appeared (Note the Hanging Man is not as potent as a Shooting Star, but it still gives the signal that the bullish trend is coming to an end). The trend then start to change.
Stock goes downwards and tumbled, until a bullish engulfing pattern emerges on April 25 - 26. Interestingly, this happened 3 times! Triple bullish engulfing pattern! This also serves as a support line, which supported the price level on June 28 - 29.
Stock rallied up and hit a bearish Harami pattern on June 11 - 12, signalling that bull has lost it's momentum. Stock drops and hit the support line where a bullish engulfing pattern appears, and then goes upwards until it hits a Doji on July 2. Market comes to a neutral tone and market is unsure to go up or go down.. in the end it goes downwards.
Price could go further down until it hits the support line and change upwards, depending on the candlestick formation at that time. If it goes down it would hit the second support line formed by the inverted hammer.
Notice the MACD histogram is showing an upward trend, signifying an uptrend of price.

Candlestick analysis in Heineken chart
Stock: 3255 Heineken
Chart: Daily
Period: June - July 2018
Hanging Man appears on June 7, indicating an end to the bullish trend. This is further confirmed with the next day red candlestick close which is lower than the Hanging Man close. Trend then changed to bearish until June 26, which a hammer appeared. This indicates an end to the bearish trend. The bullish confirmation is given when the next day's green candlestick closed higher than the bullish hammer.
If you've long right after the hammer you would have profited handsomely.

Hanging man Doji on right shoulder of a triple top...No wild-eyed predictions here folks, just observations and ideas... maybe, just maybe, we got topping action and what looks bearishly like a head & shoulders triple top in Dow with textbook Hanging Man today and the appearance of another bearish Gartley forming, with left side completed. IF price action confirms this pattern, then the downleg to trendline will be swift to 24K +/- 200 IMHO. I will not presume to tell you that on a certain day the stars will align to produce this result but it is market forces of supply and demand that could cause something like this to play out, I'm afraid. Darn it anyway! Heck, maybe it will go up 2K and prove me wrong - I wish!
