Hang Seng - The Rebound found resistanceHang Seng rebound strongly with fresh measure announced to ease funding for private companies.
The strong rebound brought price to 26222 level. On the left chart, price reached one third of previous downswing (important fibonacci retracement level), also hovering around previous downward channel line. On the right 60 mins chart, yesterday rebound reached 5 golden ratio multiples and quickly retraced. Both charts in different time frame were suggesting the rebound hitting major resistance. And Hang Seng have not prove to be trend reversal, market remain bearish.
The current price projection from 26222 level as follow:
25917 short tern support for selling
If price trade below 25917, next target at 25729.
If price trade below 25729, next target at 25424
Hangseng

HK50 LONG OPPORTUNITYIndices globally have been in a downturn as the trade tensions between Trump and China heated up however should we expect some short term relief?
The market works in trend and tends to bounce between support and resistance zones. The HK50 (Hang Seng) has reacted from the key weekly support of 25300.00. Looking left you can see how this level has been used significantly in the past and could find some buyers at least into the key resistance of 28500.00.

HK50 LONG FROM WEEKLY SUPPORTIndices globally have been in a downturn as the trade tensions between Trump and China heated up however should we expect some short term relief?
The market works in trend and tends to bounce between support and resistance zones. The HK50 (Hang Seng) has reacted from the key weekly support of 25300.00. Looking left you can see how this level has been used significantly in the past and could find some buyers at least into the key resistance of 28500.00.

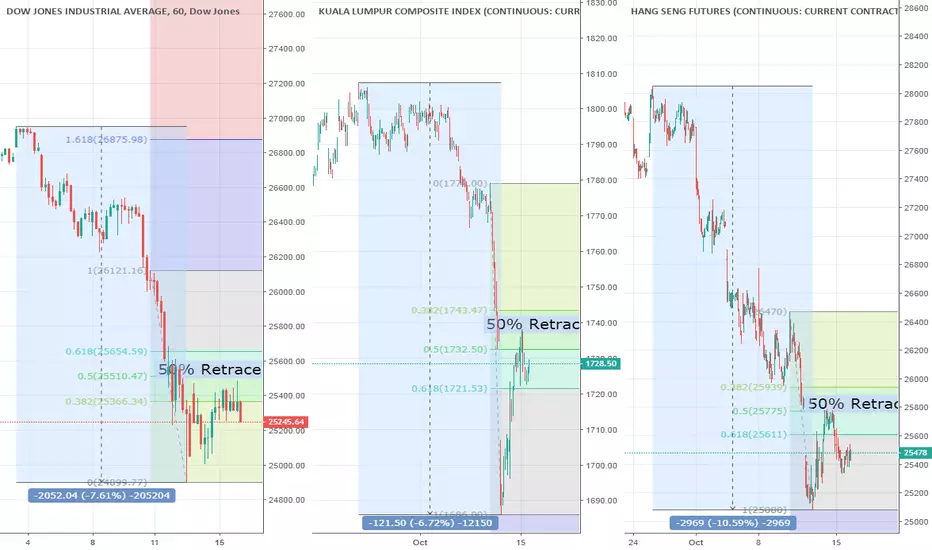
Dow, FKLI & Hang Seng - The 50% RetracementThe sharp declined in indexes market have not make significant come back yet since 11 Oct.
The 3 charts plotted in 60 minitues time frame. From the left
- Dow declined 7.6% from the peak, and rebound to 50% ratracement ( 25510) and trade below.
- FKLI declined 6.7% from the peak, and rebound to slightly higher than 50% ratracement (1738) and retraced.
- Hang Seng declined 10.5% from the recent peak, among the worst performing market, and rebound to 50% ratracement (25775) and trade below.
The current price structure in correction stage with no indication of bullish yet.
Hong Kong Stock Index (HSI) (Oct 2018) This will be my views of Hong Kong Stock Index (Oct 2018)
Please make sure to read the "update" comment as there will be changes along the way.
Cheers.
S0nic
Disclaimer:
The information contained in this presentation is solely for educational purposes and does not constitute investment advice. We may or We may not take the trade.
The risk of trading in securities markets can be substantial. You should carefully consider if engaging in such activity is suitable to your own financial situation.
We, Sonicr Mastery dot com is not responsible for any liabilities arising from the result of your market involvement or individual trade activities.
You should be aware of all the risks associated with foreign exchange trading, and seek advice from an independent financial advisor if you have any doubts.

Hang Seng - Room for downsideSince Jun, Hang Seng moving in 30 degree downward sloping channel. Price did not move out from this channel, and previous rally found resistant at the familiar upper channel again.
The current price movement have formed lower low, thus the downside target projection are use for price target for reference. If price continue to trade below 27439 will see 27062 & 26452 right after. Fibonacci spirals act as "future" support and resistance. Trader please be cautious when price trading near the above two levels.

Hang Seng - Support at 27300 & 26880Hang Seng likely to join Dow Jones to trade lower with cautious on rate hike ahead.
On the left chart (4 hours chart), Hang Seng Futures trading in a downward sloping channel with moderate slope of -22 degree. The recent rally not able to brought the index anyway further. Price is likely to continue to trade within the range for days to come.
If the current selling continue, as long as price below 27550, price is likely to discover lower price zone 27300 and second target at 26880.

Hang Seng - Reach Resistance 27270Rebound with global sentiment recovery from trade war concern. Hang Seng selling reach 50% retracement level 26683 on yesterday (left chart) and rebound. However the current swing have achieved 4 multiples of golden ratio. A potential retracement may occur. This basis can be refer to Hang Seng was under-performer among all indices market during this period of time.
Thus, today commentary are require to provide two directions view:
If price go higher high than 27270, price will further rebound to 27647.
If price trader lower than 27270, support could be found on 27025 & 26945.

Hang Seng - Price Heading to 26394Hang Seng did not went higher then 50% retracement stated in previous post. Quick selling seen in Monday open. The current price projection suggesting price to reach 26394 in the short term (300 points from now).

Hang Seng - Rebound reach 50% retracementHang Seng reach a conservative projection target yesterday, it went higher to reach 10 golden ratio multiples (1.618^10) & 50% retracement level on the left.
The rebound has not prove to be a reversal yet, as price did not go higher than correction zone 26990 & 27575, primary trend remain downtrend. Trader please trade with cautious as price will be volatile during correction phase.

Hang Seng - Rebound from LowHang Seng rebound from initial projection on post 5 Sep & 6 Sep 26431.
The current rebound expect to reach 26773 to 27222 (see left chart). If price did not trade higher that this, the primary trend remain weak and no reversal indication yet. Trend trader can remain sideline as current swing is correction phase.

Flash note: Hang Seng 50 Future/Tencent + ADR /NasperAccording to Lester Davids, Trading Desk analyst at Unum Capital:
"Some positivity on the Tencent Chart - Could be a driver tomorrow.
- Bullish Divergence
- Extended well below it's 200dma (HK$404)
- Chinese market sentiment overwhelming negative"
Contact the Trading Desk on +27 (0)11 3842920 or tradingdesk@unum.co.za to discuss.

Hang Seng - No sign of reversal yetPrice reach spiral projection 27156 yesterday. While price remain below 27156, 26431 is the next projection target.

Hang Seng Heading 27156 in short termBoth charts showing 3 fibonacci spiral projections. On the left, in Hang Seng Futures Daily charts, the downside room project at 26431 (Around 950 points from now). On the right chart, a 30 minutes chart spiral projection at 27156 (230 points from now). Trader please do not hesitate to sell until price trade higher high.

Dow vs Hang Seng DivergenceThe two market are not necessary similar, but historically both index have positive correlationship close to 80%. Dow make higher high during June, at the same month Hang Seng breakdown from the range and form lower low. The current divergence has lead both indices correlation to 26%. Is this the outcome of tariff war?

Short HSI (Hang Seng index)was about a 1% away from official bear market territory, sitting 3% away, for now. $GXC $SPY

Bear Unleashed Hang Seng Update.A little update on this Index that is perfectly consistent with the February "Bear Unleashed Hang Seng" chart.
Best wishes to all.


Hang Send - fifth wave is around the cornerIt's likely to have another upward impulse in the coming days.


Hang Seng - Key levels to watch for. Trading opportunitiesHang seng has been sold in line with Chinese equity markets and global equities markets due to trade tensions with US. As these start to subside, and market awakens to the fact that both countries look for win-win agreement equity markets should rally in the near term. Larger moves can be made if key technical levels are broken as highlighted in the chart.
Good trading to all.

HANG SEND short set upThe HANG SENG index sitting at it's final support. Now is the time it breaks upward or falls through and takes these shakey markets south.

HangSeng / D1 : Big nice "Crash Pattern" waiting for a signalHope this idea will inspire some of you !
Don't forget to hit the like/follow button if you feel like this post deserves it ;)
Indicators used in this forecast are PRO Sinewave BETA & PRO Momentum .
You can check my indicators via my TradingView's Profile : @PRO_Indicators
Kindly,
Phil
If you want to learn more about the basic rules to trade with my indicators here's the educational video link :
