HSI / W1-H1 : Highly Speculative Short scenario...Hope this idea will inspire some of you !
Don't forget to hit the like/follow button if you feel like this post deserves it ;)
Indicators used in this forecast are PRO Sinewave & PRO Momentum .
You can check my indicators via my TradingView's Profile : @PRO_Indicators
Kindly,
Phil
If you want to learn more about the basic rules to trade with my indicators here's the educational video link :
Hangseng

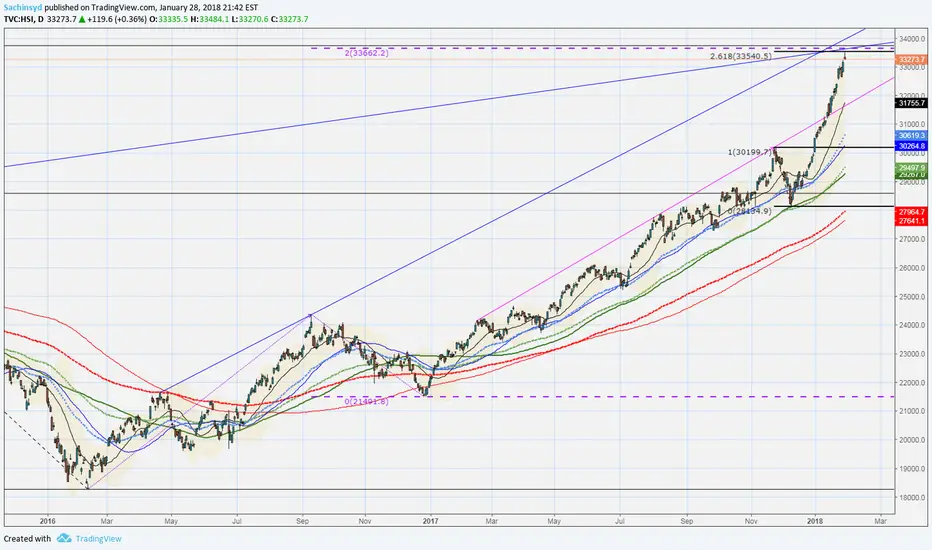
$HSI into fib cluster likely to retrace down $HSI into fib cluster likely to retrace down to 20dma where short term resistance line was breached. Short 33500-700 area
HSI Daily Update (30/1/18)Indices across the board are facing strong downwards movement.
HSI just break through the support zone, next support will be at 32000.
Reachable soon...
Disclaimer:
The information contained in this presentation is solely for educational purposes and does not constitute investment advice.
The risk of trading in securities markets can be substantial. You should carefully consider if engaging in such activity is suitable for your own financial situation.
SonicR Mastery team is not responsible for any liabilities arising from the result of your market involvement or individual trade activities

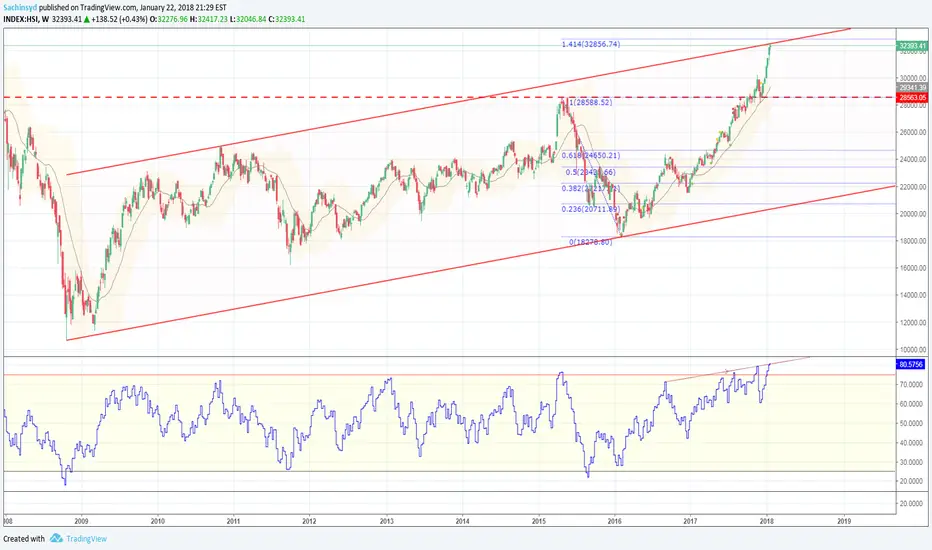
HSI / 2008 vs 2018 : Feels like "Oops I did it again" !!!The comparison is easy, the debt level is even crazier than during the last credit bubble that bursted 10years ago.. Real economies just started to get over it but it seems like traders haven't learnt anything for the previous crisis !! As I always say... trading is about cycles and no matter how ofter I hear "This is different now..." or things like that... the thing is that cycles repeat through time.. credit bubbles or speculative bubbles have always burned the markets even though the economy was looking good and strong... Will we repeat the cycle again... I tend to say yes ! But it's too early.. Sure thing is that I'll have a close look at what could happen on the same fibonnacci extension than the one that triggered the previous krash ! Just in case ;)
Hope this idea will inspire some of you !
Don't forget to hit the like/follow button if you feel like this post deserves it ;)
You can check my indicators via my TradingView's Profile : @PRO_Indicators
Kindly,
Phil

HSI HangSENG at key fib levelsHSI HangSENG at key fib levels .. Beware of sharp profit taking or selloff

HSI Short Position CallingGiven the Hang Seng prices about to reach its high point, I call a short for this upcoming week. While there is potential for some long term gains, I believe an extremely short position is conservatively the best calling. That would maximize losses and still bring some profits just looking at the technical analysis of past charting patterns. Also it still looks extremely bearish given it is a strong buy. I would predict the best strategy would be a short over long holding for expected positive correlations. Overall though, it is extremely highly investible.

Our Forecast of Hang Seng Index in the following weekHang Seng Index has been in a near-term uptrend since the beginning of December 2017. The question is whether HSI will close at 30000 by the end of next week. Please take note that the market will be closed for 25 & 26 December 2017 in observance of the Christmas Holiday.
HSI made a recent high of 30,200 on 22 November 2017 and since then it went all the way down to 28135 on 7 December 2017. Investors like you may be wondering the price movement of HSI in the following week. From a technical outlook, the index has a near-term upward directional bias since 7 December 2017.
Based on our forecast, if the bullish momentum continues, we could potentially see the index test the 29760 as the first level of resistance. If this level is clear, it is possible for HSI to retest the 30000 psychological level, followed by 30200 which is the high on 22 December 2017. On the other hand, if this move is not sustainable and the index were to make a U-turn to the downside, we could potentially see the index test 29140 as our first target level, and if this level cannot provide the necessary support, the index could potentially be retraced to 28950.
Good trading
NinjaSingapore
23 December 2017
DISCLAIMER
Our research materials are provided for information purposes only. They should not be used or considered as an offer to sell or a solicitation of an offer to buy any securities. The research materials are prepared for general circulation and general information only. They do not take into account the specific investment objectives, investment knowledge and experience and financial situation of any recipient. Investors seeking to buy or sell any securities discussed or recommended in our research materials, should seek independent financial advice relating thereto and make his/her own appraisal of the tax or other financial merits of the investment.
Any opinions expressed are subject to change without prior notice. Our research materials are based on information from various sources believed to be reliable. Although all reasonable care has been taken to ensure that such information is not misleading, we make no guarantee, representation or warranty, expressed or implied as to its accuracy, adequacy or completeness. We do not accept any liability whatsoever for any direct, indirect or incidental, special or consequential loss of any kind arising out of the use or reliance on the information in our research materials.

HSI short tems double top D1HSI could build a double top at D1 wave.
In connection to high world stocks DOW, US30, Ger30


rebounding soonlooks like some rebound back to 28000 or above is imminent.
overall we are still in a complex wave 4 on the daily.

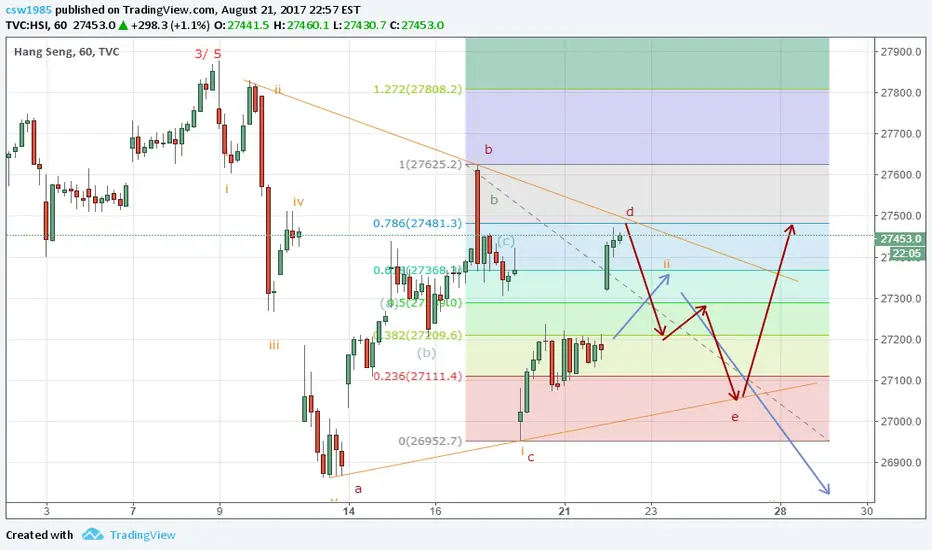
alternative countmarket did rebound to the 274xx level as suggested
but it gaped up with great momentum and went past the 0.618 level to the 0.786 level of wave i
usually a wave C down would be swifter and wouldn't "stall" that much.
Market need to come down again fast or I'm a bit worried for the bears
An alternative count would be wave 4 is taking the form of a contracting triangle (red arrow) ( which the first 5 wave down could be counted as 3 waves)
and shorts should be covered around the 272xx-27xxx area.
the high of last week 27625 is their last line of defence. it cannot be breached or it s game over for the bears

Weekly chart: potential extended wave 5 about to end?potential short term top around 271xx-274xx area ? possible extended wave 5 target projected from the length from wave 0 to wave 3( 1.618)

Hang Seng putting in base for some July joy?!Hang Seng (HSI) which is heavily property weighted and led by some key stocks eg Tencent had one of its larger sell offs today, but looked to possibly put in a base around the key technical futures levels of around the 25000's /25500's. Bullish seasonality normally strong over July so a potential dip buying opportunity or part of a more major global weakness in the larger stock indices? Downside support levels at: 25000, then 24500's. Upsides: early to mid 27000's?

Hang Seng Index wanna to return to trendline?It's believed that HangSeng is in Bull 2 market. However, as it has rised 5000+ points since the beginning of this year. Would it return to the trendline after Jun?


HSI down signalWhile 245 gap down 2 weeks ago, HSI still trades below the gap resistance.
It's believed that DOWS and Nikk has the selling signal by Tanken has cut their Kijun on daily chart.
Sell HSI/ HSCEI when rebound. It's holiday tomorrow, let's see on Wed.

Hong Kong Hang Seng: Uptrend is Due This YearPretty weak, but still up
Hang Seng index, which represents Hong Kong stocks, was going down suring the recent few months. But right now it appears to be reversing, or at least correcting, to the upside. What to expect this year?
Let's recognize a bit of Hang Seng nature from the technical point of view. Look at the chart.
30% per rally
Most of the rallies last 6 years had the same overall percentage of price rise: 30-35%. So for now this is the "nature" of Hang Seng, which means we can expect the same % of growth in future rallies. Each rally usually takes around 4-6 months, so we may expect the same timing in the future.
Angles resistance
According to the angles drawn on my chart, we can see a pretty strong resistance somewhere in the red square. Once the price hits that square, the reversal to the downside (or at least bigger correction) is expected.
Price target: 28000 within this year
Once the uptrend is finally confirmed, expect the yearly top at around 28000. Angle resistance zone coincides with the 30% growth "nature", so this is a pretty realistic price target.


HANGSENG SHORTEverything is described in chart.
Every fundamental reason is given since the US rate hikes again.
The chinese loans have to be paid in US Dollar which increases a lot.
