Hang Seng searching out new lowsHanG Seng came under fire and could see new lows in coming days. The price action recently flushed through resistance at 22416 and is now unwinding longs positions on a move down. A break below 21068 could see a move into 20165.
Hangseng

HSI UpdateI said yesterday afternoon that I was bearish on China, look at MFI on this chart. It's basically at support now so I flipped my puts this morning.
At least I found one index where indicators still work, lol. US/Euro markets in a complete melt up.

Hang Seng - ChinaMajor resistance in another China ETF....Tagging Multi year Pivots going all the way back to 2011.

Hangseng Index Rallying in Nesting Impulse Elliott Wave StructurCycle from 10.31.2022 low in Hangseng Index is in progress as a nesting 5 waves impulsive Elliott Wave structure. Up from 10.31.2022 low, wave ((1)) ended at 18414.09. The 45 minutes chart below shows pullback in wave ((2)) ended at 16833.68. Wave ((3)) is currently in progress as another impulse in lesser degree. Up from wave ((2)), wave ((i)) ended at 19237.45 and dips in wave ((ii)) ended at 18530.82. Wave ((iii)) ended at 19737.31, pullback in wave ((iv)) ended at 18799.81 and final leg wave ((v)) ended at 19926.48. This completed wave 1 in higher degree.
Wave 2 pullback ended at 18878.64 with internal subdivision as a zigzag structure. Down from wave 1, wave ((a)) ended at 19130.53, rally in wave ((b)) ended at 19786.29 and wave ((c)) lower ended at 18878.64. This completed wave 2 in higher degree. The Index has resumed higher in wave 3. Up from wave 2, wave ((i)) ended at 20098.23 and pullback in wave ((ii)) ended at 19303.73. Index then extended higher in wave ((iii)) towards 21396.09, and pullback in wave ((iv)) ended at 20862.77. Expect Index to end wave ((v)) of 3 soon, then it should pullback in wave 4 to correct cycle from 12.20.2022 low before the rally resumes. Near term, as far as pivot at 18878.64 low stays intact, expect pullback to find support in 3, 7, 11 swing for more upside.

Hange Seng index still heading on up to 24,637!Large C&H has formed since the break up and out of it's recent medium downtrend.
Price is also above the 200SMA (Which explains the Green background)
This means, an uptrend is confirmed,
7>21 >200SMA
RSI >50 >75
Target 24,637
Bullish

HK50 - Price action looks to be forming a topHK50 - Intraday - We look to Sell at 19560 (stop at 19821)
We are trading at overbought extremes. A Doji style candle has been posted from the high. Price action looks to be forming a top. This is negative for short term sentiment and we look to set shorts at good risk/reward levels for a further correction lower. Further downside is expected although we prefer to sell into rallies close to the 19560 level.
Our profit targets will be 18755 and 18540
Resistance: 19480 / 20635 / 22510
Support: 18540 / 17605 / 16450
Please be advised that the information presented on TradingView is provided to Vantage (‘Vantage Global Limited’, ‘we’) by a third-party provider (‘Signal Centre’). Please be reminded that you are solely responsible for the trading decisions on your account. There is a very high degree of risk involved in trading. Any information and/or content is intended entirely for research, educational and informational purposes only and does not constitute investment or consultation advice or investment strategy. The information is not tailored to the investment needs of any specific person and therefore does not involve a consideration of any of the investment objectives, financial situation or needs of any viewer that may receive it. Kindly also note that past performance is not a reliable indicator of future results. Actual results may differ materially from those anticipated in forward-looking or past performance statements. We assume no liability as to the accuracy or completeness of any of the information and/or content provided herein and the Company cannot be held responsible for any omission, mistake nor for any loss or damage including without limitation to any loss of profit which may arise from reliance on any information supplied by Signal Centre.

Hang Seng Cup and Handle upside to comeCup and Handle has formed on Daily with Hang Seng.
The breakout was strong, and if we weren't in, we'd wait for a bit of a pull back for a consecutive entry level.
7>21 < 200 Moving Average which gives it a Bullish bias.
With the Covid restrictions lifting slowly and things finally showing a recovery to come for the economy, this could be the helpful catalyst for upside for the index.

HSI: is about 40% upHangseng looks bullish.
There are 2 bull patterns just ended, so it looks about 40% up at least.

Hang Seng Index under fire!!Watching the Hand Seng underlying index in coming sessions...could be a good selloff on the cards...price action looking weak and there is a lot of buyers that could be put under pressure to unwind long positions!!

Joe Gun2Head Trade - Top pattern on HK50Trade Idea: Selling HK50
Reasoning: Top pattern on HK50
Entry Level: 17641
Take Profit Level: 16980
Stop Loss: 17796
Risk/Reward: 4.25:1
Disclaimer – Signal Centre. Please be reminded – you alone are responsible for your trading – both gains and losses. There is a very high degree of risk involved in trading. The technical analysis , like all indicators, strategies, columns, articles and other features accessible on/though this site is for informational purposes only and should not be construed as investment advice by you. Your use of the technical analysis , as would also your use of all mentioned indicators, strategies, columns, articles and all other features, is entirely at your own risk and it is your sole responsibility to evaluate the accuracy, completeness and usefulness (including suitability) of the information. You should assess the risk of any trade with your financial adviser and make your own independent decision(s) regarding any tradable products which may be the subject matter of the technical analysis or any of the said indicators, strategies, columns, articles and all other features.

Hang Seng: Falling for FallThe Hang Seng Index has been going through a constant change of ups and downs. Going into November, we are expecting the index to drop down to ideally 13 715 points and make its way up again. As long as it stays within the green area between 14 451 and 13 119 points, chances are high of the HSI going up to 18 772 by the end of this fall.

$HSI Hang Seng Index Can Rise Up - Inside and FCP Zone NowTraders, I have been covering indices in depth latetly and what I see a common pattern is that US Indices has started to bounce back. US3 has been gaining for last 3 weeks or so, SnP500 is lower but gaining and NASDAQ is the only one which gained slowest. Hang Send Index (HSI) has reached 2008 levels but forming an M pattern. It is now inside an FCP zone which can push it upwards. Now think about the consequences of that.
Please support this analysis by liking and sharing. 👍🙂
Rules:
1. Never trade too much
2. Never trade without a confirmation
3. Never rely on signals, do your own analysis and research too
✅ If you found this idea useful, hit the like button, subscribe and share it in other trading forums.
✅ Follow me for future ideas, trade set ups and the updates of this analysis
✅ Don't hesitate to share your ideas, comments, opinions and questions.
Take care and trade well
-Vik
____________________________________________________
📌 DISCLAIMER
The content on this analysis is subject to change at any time without notice, and is provided for the sole purpose of education only.
Not a financial advice or signal. Please make your own independent investment decisions.
____________________________________________________

YANG - China Bear Fund 3x leverageThere are numerous headwinds to the Chinese economy and normally I would say the CCP would be able to manipulate the mechanisms needed to keep stability, but not this time. This time it is different due to conflicting policies and factors outside of their control.
You have their 0 Cov policy which is causing widespread business disruption as the Chinese vaccine dose not seem effective against omicron and B.A2 variant.
You have them needing to strengthen the yuan due to the dollar ripping higher by selling USD but, they need the dollars to service debts and there is a dollar liquidity crisis which means they need to hold on to every dollar they can.
You have the ag sector not fully recovered from decimating their swine herd due to Swine Fever and crops disrupted due to last year's flooding plus a global fertilizer shortage.
Finally you have it as a bet that an autocratic regime, governed by a single man who has a record of shooting the messenger, to not respond to economic crisis nimbly, imaginatively and effectively.
Entry over the week of 4/25, averaged in at 20.40. Good luck and god speed.

Hong Kong Hang Seng Index at 30-year supportThe Hang Seng absolutely melt down on Monday, most people explained the selloff as the disappointment in Xi and his royalists taking complete control of the CCP, or the market is disappointed because there is no lifting of COVID restrictions after the 20th party congress....IMO, both of these are or should be well expected, the people's daily actually published the importance of COVID zero for like 3 days in a row ahead of the 20th party congress....anyway
If we zoom out, we can see the HSI is at a historical upward trend line support, and below it at the moment (this is a monthly chart). Valuation does not make sense, because the Index is trading at 0.6 PB, and each time the index traded below 1 in history, it resulted in significant return over the next 2 years (and I believe the PB never went below 0.9). However, the index now has more tech companies in it and the price to book is inflated a bit?
However, given how oversold and undervalue the index is, this looks more like a final capitulation than a "start" of another round of bear market. If we just simplify things, if the index level climb back up above this 30-year trend line, there is a high chance that the bottom is in like previous bear markets circled in red (given no new black swan event happen to the world). Volume also picks up significantly today (not available on tradingview somehow), consistent with typical capitulation at market bottom where everyone loses hope and just give up and shut down their computers...
meanwhile, theres energy crisis, war, inflation and protests going on in Europe, but European equities are up as much as 2% today and US futures up 0.5-0.8% pre market, no one cares about China selling off...interesting divergence...

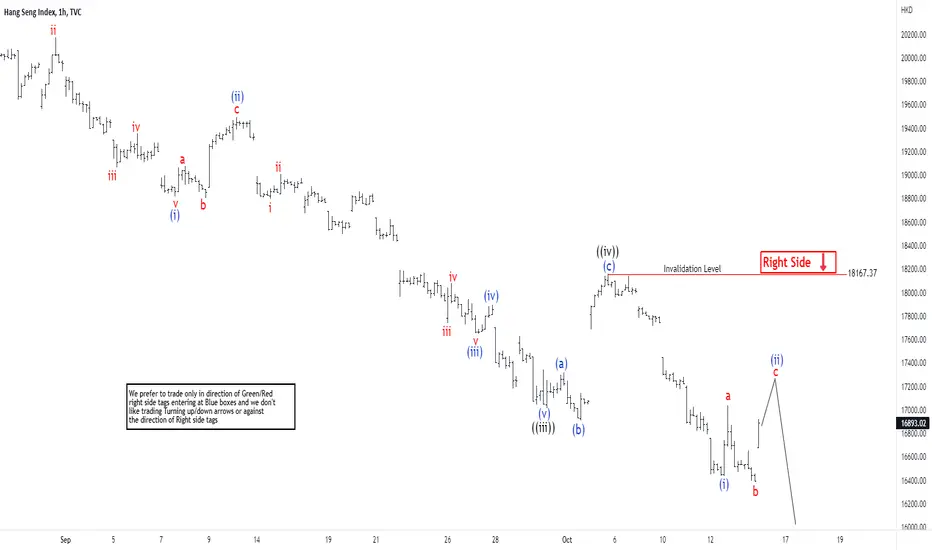
Elliott Wave View: Hangseng Index Sequence Remains BearishShort term view of Hangseng Index suggests cycle from 6.28.2022 high is unfolding as a 5 waves impulse Elliott Wave structure. Down from 6.28.2022 high, wave ((i)) ended at 19469.11 and wave ((ii)) ended at 20185.15. Index then resumes lower in wave ((iii)) towards 16906.96 with internal subdivision as an impulse in lesser degree. Wave ((iv)) rally ended at 18164.20 with internal subdivision as expanded flat as the 1 hour chart below shows. Up from wave ((iii)), wave (a) ended at 17315.79, pullback in wave (b) ended at 16906.96, and wave (c) ended at 18167.37.
The Index then has resumed lower again. Technically it has enough number of swing to end wave ((v)) but near term may still extend lower. Down from wave ((iv)), wave (i) ended at 16438.60. Wave (ii) rally is in progress as an expanded flat and while below 18167.37, the Index can resume lower again. Near term, as far as pivot at 18167.37 high stays intact, expect rally to fail in 3, 7, or 11 swing for further downside. Once wave ((v)) ends, it should also end the cycle from 6.28.2022 high. Index should then do larger degree rally in 3, 7, or 11 swing to correct that cycle before the Index resumes lower.
Hang Sheng - trading ideaJust a monthly range
Maybe we have bottom, idk
R:R isn't perfect but 2 isn't bad

HSI UpdateHSI touching overbought on RSI, probably pulls back tonight.
If you're still holding along position in PDD, I suggest dumping or at least locking in some profit. I'm already out.

HSI UpdateOversold and hit my target last night so bought some PDD calls this morning.
Good earnings and positive news so you know that garbage is gonna go up fast, it always does. Already getting pumptarded, but I've seen PDD move $20 in a week, for example runup before last earnings.
This is why I plot stuff though, hit the target almost on the dot.

China is not a safe haven from SPXYeah no. Long term TL is being challenged and price is at important reisstance on the RSI, MACD and price support turned to resistance. Confirmation should come soon for the next leg down.

HANG SENG The 6 year Support is holding. Potential 25k move.Hang Seng (HSI) broke and closed today above the 1D MA50 (blue trend-line) for the first time since February 2021. Despite the weakness since early April, the index hasn't yet broken or even come close to the March 16 low, indicating that we have a long-term Support. That is reasonable technically as that level (18250) is a 6 year Support formed by the February 12 2016 low and as long as it holds, pull-backs should keep finding buyers.
The natural target next is the 1D MA200 (orange trend-line) and towards the end of the year, the 0.618 Fib (around 25000), which would be a symmetrical move with the 2016 bullish break-out from the long-term correction.
--------------------------------------------------------------------------------------------------------
Please like, subscribe and share your ideas and charts with the community!
--------------------------------------------------------------------------------------------------------

HANG SENG 30th MAY 2022In China, authorities are holding an unprecedented national meeting by teleconference in a bid to boost the economy hit by Covid-19. Investors' concerns about tightening monetary policy seem to have eased. Hong Kong's Hang Seng Index led the strengthening of Asia-Pacific markets today. One of the driving factors was the soaring stock of Alibaba.
Premier Li Keqiang also warned that China's current economic difficulties outweigh the severe shocks at the start of the Covid-19 pandemic in 2020. So the bearish possibility could occur before they actually get out of the fight against the pandemic.

HSI almost ovverboughtHSI almost overbought, so you know what that means....
PDD puts though the premiums are high due to earnings.
HANG SENG INDEX - global potencial move (language of numbers)Globally gaining a large long position with a 15% stop behind loy
