Hangsengindex

HSI, are we going to 31600 ?Here is all patterns i can see with current HSI structure.
At 31600, there is a bearish gartley (78%).
At this exact same level, there is a 5-0 pattern (161% extension) which would lead to a ~50% drop in a form of AB=CD .
I tend to think, when fibs are nicely aligned (confluence) the probability is high to touch the level.
HSI could rally up to 31600, falls down 27400 and bounces back to 31600 again and higher...


HSI Shake&Bake PA setupLooking forward for further decline in Hang Seng Index.
Let's shake it and bake summer low!

Hong Kong Equities: buy around 20000-22000 areaHong kong troubles are well known now.
think if the crisis continues, look to buy when it hits 20000-22000. this is a long term trend line that draws from 2008 crisis low.
Update on Hang Seng Index Analysis on Weekly timeframeDuring last week, HSI has successfully broken 28,075 short term support level and dropped over 1,500 points to our target near 26,505. Currently, HSI is retesting the previous low at that level.
We are expecting the market to break the 26,505 structure level and if it does, we would be looking at a retest of structure in the lower timeframe for our entry. Potential target could be near the next low which is around 24,500.
Gordon @GoreStreetTrading
Previous Analyis

Hang Seng Index Analysis on Weekly timeframeHSI has retraced roughly 75% from the top 33,516 (January 2019) since the uptrend started on 28 December 2018. In April, we have seen HSI spike up to the 30,200 level where price was rejected. Recently, price has formed a short term support near 28,075 level since mid-June.
Price has now printed a higher low and a lower high which therefore is not clear where the market is heading in the long run. This means we need to see a breakout of either higher low or lower high to see a clear direction.
In the short run, we would expect the market to hold up near 28,075 level and try to push through the upper bound (downward trendline). If price could break and close above the most recent LH 30,220, the market may retest previous 31,500 resistance zone.
On the other hand, if we see price push and close below 28,075 short term support level, we would look for a short term retest on lower timeframe of 28,075 for a potential short position down to 26,700 (most recent low),.
The reason we have two possibilities is due to the current market conditions. We need to see a break out one way or the other to make a directional judgement.
Gordon @GoreStreetTrading

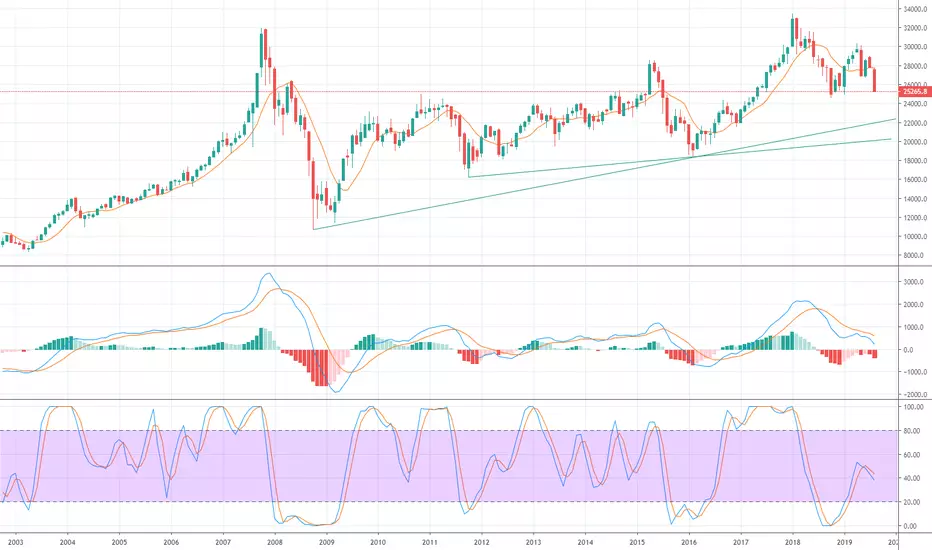
Hang Seng Index - 5-Wave Exhaustion as Confirmed by StochasticsHang Seng Index
- Five-Wave Exhaustion Elliot Wave count.
- Divergence shown by Stochastics 14-3-3.


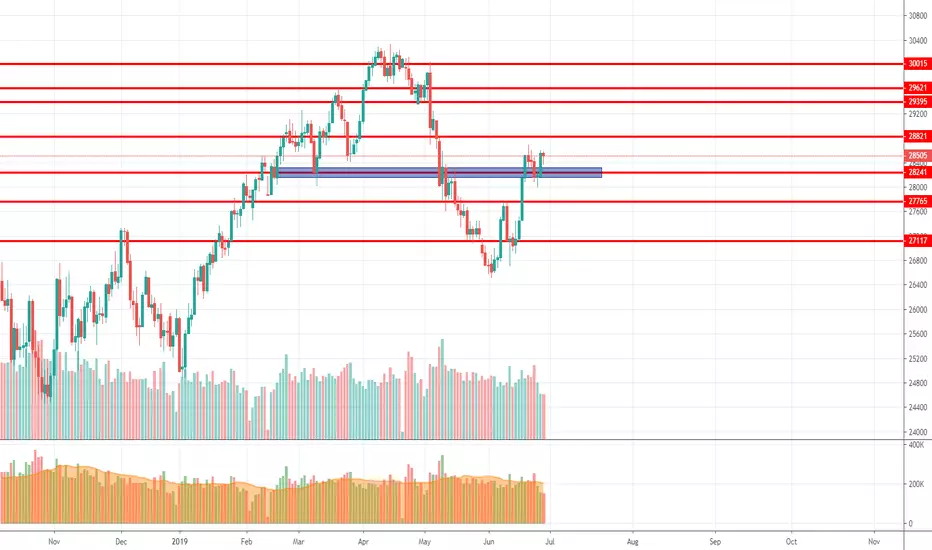
HSI Upside Target (July 2019)HSI is currently in an uptrend, the critical 29000 level would be reached soon and then push up further.
Upside Target: 29250, 29400
Support: 28700, 28850
To fill the gap above 29400, it would require really good news about trade deal between US and China.

Morning star on HANG SENG. 29 june Trading Idea. With Xi and Trump meeting this weekend, I'm expecting good news from them as the market close with a very bullish pattern. Going long here should be very rewarding as there is potential for upside than downside. 27910 will be our SL.
Hang Seng bearishEnded last week with a daily that bearishly engulfed the prior 3 days and it's rally back towards its all time high stopped right around the .618. I'd have to call that a dead cat. Also a hanging man at the top where the rally ended along with an island. Currently losing this fib level as we speak. looks bad.

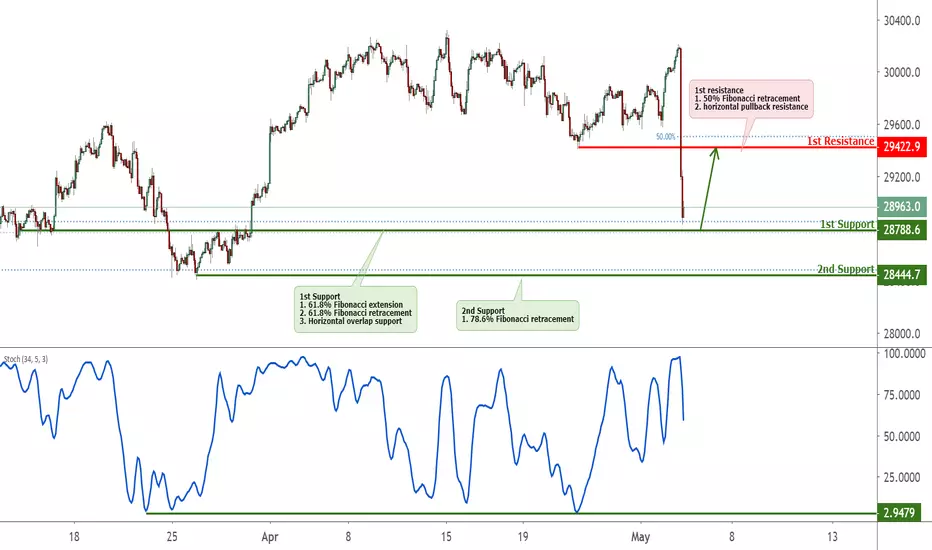
Hang Seng index Approaching Support, Prepare For A Bounce is app
HIS is approaching its support at 28788.6 (61.8% Fibonacci extension, 61.8% Fibonacci retracement, horizontal overlap support) where it could potentially bounce to its resistance at 29422.9 (50% Fibonacci retracement, horizontal pullback resistance).
Stochastic (89, 5, 3) is approaching its support where a corresponding bounce could occur.
Potential Upside Target for HSI (April)HSI had a strong gap and breakout after the weekend.
The index is currently moving within the two sets of upward channels, we expect the trend to continue if it holds.
The Potential Upside Target for HSI would be 29700, 30000 and 30300.
We should see some kinds of retracement after reaching TP1 before advancing further.

Hang Seng Set for Renewed UptrendUS China trade war resolution more forcefully impacts Shanghai Composite and Shenzhen Component, but Hang Seng should also see some gains. Moreover, we have seen a bit more progress in the negotiations apparently with tech transfers, tech war. Let's see if it pans out though. For more, check out www.anthonylaurence.wordpress.com

Proceed with CautionHSI closed in a strong support region.
Fourth wave expanded flat is the preferred count as the selloff seems to hv good momentum but caution is required. Under this count, HSI will make a new low below 28000 and then rally towards 30000. ALT. Triangle.
28600-29000 area has seen very heavy volume traded recently. Expect the prices to hover in and around this area for some time.
Selling rallies with SL 29280 is the plan for now. Will update if things change.

Hangseng correction. Expanded flat or a Triangle?Hangseng appears to be in wave iv correction with A and B waves both unfolding in 3 waves. Wave C is currently under way.
In case of an expanded flat, it will break below 28000. Target area is 27800-600.
In case of a Triangle, wave C should end around 28550-600 area.
Once completed, wave v should advance to 30000-30300 area.

Hang Seng (HSI) Buy Trade 2H TimeframePrice is in an uptrend on the daily and lower timeframes, and has just broken the 29 153.0 ceiling, which represents the previous high. It currently is 23 points (pips) below the 289 432.2 level, which has been tested twice previously ass support, though it was later broken through.
As a trend trader, I would wait for a retest of price towards previous high (29 143 area). That area is almost in confluence with the upward trendline, which can also be used as a buying level, once price gets close to it.

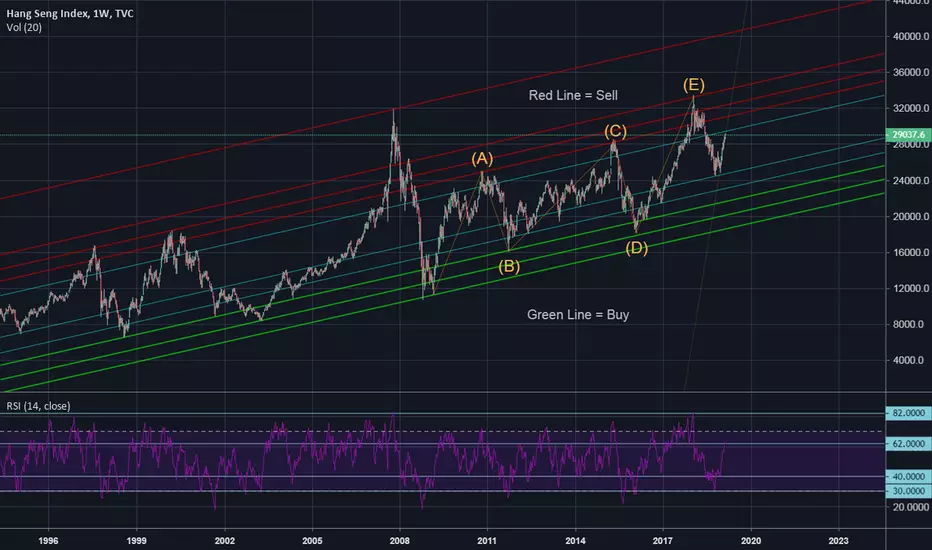
Long Term Trend for HSI on Weekly ChartSELL When:
- RSI reaches 82
- Touches the RED Line with RSI reaches 70
- Bearish RSI Divergence occurs
BUY When:
- Touches the GREEN Line with RSI reaches 30
- Bullish RSI Divergence occurs
Hang Seng: it's time tu rise The price
The price is back above the EMA200 on daily time frame after 9 months of downtrend. In fact, since the index has scored new absolute highs above 33000 points, the price has started to fall until the support around 24500 points and from here it has restarted.
Technical analysis
Technically the price is now above the new dynamic support (identified by the EMA200) and from the static one formed by 38.2% of the Fibonacci retracement, respectively at the price of 27400 and 27700 points approximately: until the price remains above these levels , this index will tend to be lateral/bullish with target on the resistance placed at 30,000 points. If both supports yield, it will test again the area of 24000 points.
Our forecast
In the very short term it is very likely that the rising of price is the most valuable hypothesis, in line with the other main global indices. The returns to the bearish side is expected on the second quarter/half of 2019 when the markets will again be affected by the restrictive policies of the banks plants.

HSI Upper TargetHSI is currently in a very strong uptrend.
If it breaks the upper resistance 28350 and 28525, the upper target would be 29000.

Hang Seng Index Too Much for this rally - Ichimoku and other indShorter term:
1. RSI overbought
2. MACD bearish reversal for shorter and middle term
3. KDJ overbought, bearish reversal for shorter term
Ichimoku for this rally:
1. conversion line up-crossing the base line well below the cloud
2. candle up-crossing the conversion line below the cloud, and the baseline in the middle of the cloud
3. relatively small candle breaking up the cloud with half immersed; cloud rather thin
4. magnetic effect from the currently flat baseline
Bullish Ichimoku signs:
5. Lagging span well above the price 26 days ago
6. Both spans for the cloud going upwards

HSI approaching resistance, potential drop!HSI is approaching our first resistance at 28057(horizontal swing high resistance, 38.2% Fibonacci retracement , 61.8% Fibonacci extension ) where a strong drop might occur below this level pushing price down to our major support at 26592 (50% Fibonacci retracement , 61.8% Fibonacci extension)
Stochastic (34,5,3) is also approaching resistance where we might see a corresponding drop in price.
Trading CFDs on margin carries high risk. Losses can exceed the initial investment so please ensure you fully understand the risks.
