Hangsengindex


up with a bangafter closing at 29018 yesterday , the index gaped up with great momentum this morning and broke the high two days ago
now it would only be safe to go short again if the hourly bar closes below 29214 ( 29190 for futures).
if this level holds, hsi could go all the way to 2943x-295xx


the big picturemaybe the big trend looks sth like that
just guessing
Anyway I never trade based on Elliott wave only
This is just for fun :)

crazy-ass movementwow.didnt see that coming
a crazy sell-off followed by a crazy rebound.
now the bulls in full control.

scepticalthe index saw resistance and fell back yet still i dont buy the idea that it would go straight down from here
my bet is hsi would go above the 28650 level again before dat wave c happens:)

Entering resistance zoneRebound target met. yet I doubt if the index would reverse here.
just wait and see

Still intactthe bears failed to push the index below 28094 for the third time.
rebounding to the red area very soon


....market rebounded to 285xx and reversed as predicted.
but still i couldnt say this is the start of a much bigger mid term correction
this month s candle very likely to be bearish but its not 100% and todays high shouldnt be breached again for the downtrend to continue
won some fast money these few days :) gonna stay on the sidelines for a while

Crazy!!the index plummeted crazily right after i 'd called the top :)
it should rebound from here back to 285xx before going down again.
Remeber i said this months candle is very likely going to be a bearish one ? ( becuz of the 8 consecutive bullish monthly candle theory)
we opened at 27885 this month. we should go below 27885 before the last trading day of October

That's it ?Got our push to the 288xx area this morning and market reversed again
Should be the start of correction to the 281xx-282xx area.

Close to a short-term topthe index found support at the range bottom again with the hourly bar closing above it.
We may get another push to the 288xx area before going down again towards the end of the month

close to a short term topindex found support at 286xx the range bottom with the hourly bar still closing above it.
we may get another push to the 288xx area before a quick drop towards the end of this month

correction pendingsaw resistance at 288xx. should be heading to 282xx-281xx first.
some interesting finding : after 8 straight bullish candles on monthly. the 9th would be bearish(which was true as we saw last month).
the 10th candle would also be bearish 70% of the time). This month the index opened at 27885,
lets see if there 'd be some fast sell off towards the end of October.
Struck in the Middleafter the rebound to 285xx, index quickly dropped back all the way to 283xx and further to the 282xx support during the night sessions
yet it found support at the bottom of the range again and managed to go back to 284xx this morning.
Now it would only be safe to short again if the hourly closes below 28330 or 28362 for futures.
it could go all the way to 288xx if this level holds. but i don't recommend longing the index

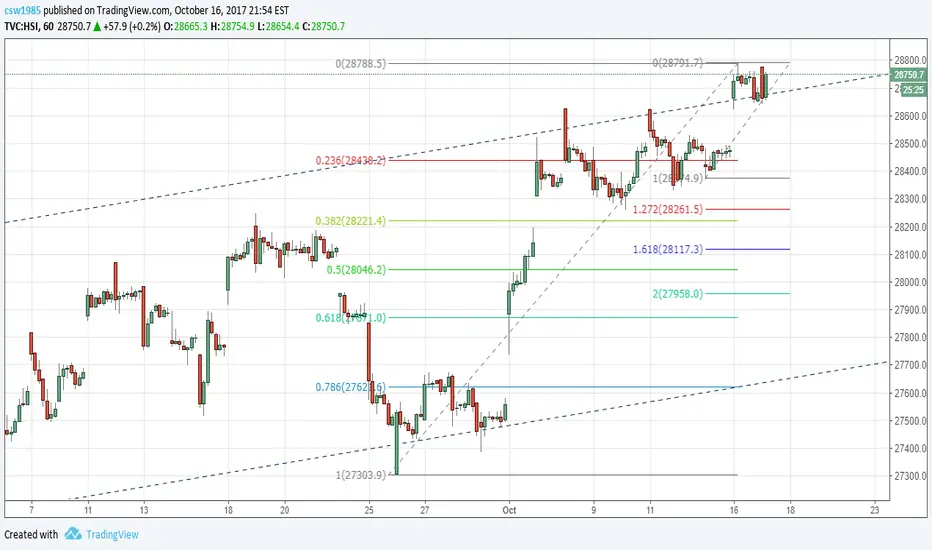
Confluencethe top of a channel, a pitchfork warning line, a fib level and the top in 2015..
the index s showing resistance
some little rebound to 284xx-285xx should happen first though

Near resistance againRebound target met. very bullish day.the index gapped up through two median lines and is now approaching the top yellow schiff pitchfork warning line AGAIN.
Over the past two month, it s been proven to be a huge resistance level. lets see how price reacts when we get there.

new highNow that 28128 s been broken
the hsi should be heading towards the 285xx area
yet its still very likely that the index would come back down below 28015( monthly open price) before the monthly bar closes
As the hangsengindex has never seen 9 bullish candles in a row over the past 30 years.

what a reboundthe index did rebound as predicted but boy did it go up with great momentum
if it managed to go above the high at 28128, it would negate my hourly count
a complex wave iv s fxxked up like that :)
that being said, since we just saw 8 straight bullish candles close on the monthly chart, even after it goes past 28128 to the 283xx-285xx area , it s still very likely the index would go back down to close as a bearish candle by the end of September.

where we are nowit is possible that there would be another up move to the 278xx before going down again.
