HSI1! 2021 Aug 16 WeekHSI1!
HSI1! 2021 Aug 16 Week
Gentle ascend, intermediate trend channel established.
High probability short trade from the upthrust.
Tested Historic UHV High from 27 Jul
Weekly: Up bar close above middle
(some strength, but supply still present)
Daily: Strength coming in
H4: Supply still present and Lower High
Strategy for Short (Test and Reject):
- 26900
- 26584
Strategy for Long (Test and Support):
- 25815
- 25560
- 24743 - 24930
- 26340 (ultimate confirmation if there is acceptance
at this price followed by strong bullish volume)
Have a sane trading week for Hang Seng : )
Hangsengindexfutres

2021 Aug 09 Week HSI1!
HSI1!
HSI1! 2021 Aug 09 Week
Last week's market:
= No follow through in breakout - Weakness
- Upthrust and returned to rotation zone = weakness
- Yet to test the Historic UHV from 27 Jul
- Market in 650pt rotation (grey box)
Monthly = UHV wide spread down bar closing off low (Change in behavior takes time)
Weekly = Potential demand, close on middle 26042
Daily: No result from Reversal1. Last bar closing off low, no sign of strength yet
H4: Supply still present. (Weakness appears on Up bars)
Immediate Resistance 26340 - 26483
Intermediate support 25560 - 25650
Strategy:
1) Price reaction off Red/Green Zones
2) Price reaction off boundary of rotation zone (grey box)

2021 Aug 02 Week
OANDA:HK33HKD
2021 Aug 02 Week
Last week a historically UHV down bar appeared. Strength always appears on UHV ultra wide spread DOWN bar.
Weekly: Market has rolled over with a wide spread down bar closing in middle (UHV) = Indecision.
Price bounced off Monthly channel demand line.
Daily: Shakeout + Reversal = Strength. Market was resisted at 26340 temporarily.
Given the UHV, there should still be supply to clear.
H4: Bar A UHV ultra wide spread bar closing off low = strength. Automatic reversal after climatic Bar A
has reasonably good bullish volume. Test of the lower region of bar A is to be expected.
Bar B test of low has off the low and level with bar A, some demand is present.
Strategy:
(1) Red/Green zones = preferred entry
(2) Dotted Red/Green is to indicate late entry, but risk will be higher since SL is further away
Remember to follow and like if you find this useful.
Have a profitable week ahead.

HSI1! 2021 June 21 Week (Intraday)
HSI1!
HSI1! 2021 June 21 Week (Intraday)
Market has made lower high and we can now visualize a down channel.
Intermittent support at 28441.
Scenario:
1) Short opportunity if price returns to test 28751 - 28655 region
2) Wait for price reaction at red/green zone before taking position.

HSI1! 2021 June 14 Week (Intraday)
HSI1!
HSI1! 2021 June 14 Week (Intraday)
Weekly, Daily = Bullish | H4 = TBC
Past 7 days in rotation. rotation range zones trade levels remains.
Bar 2 and 3 are weak.
Red/Green zone = preferred entry

HSI1! 2020 May 31 Week (Intraday)
HSI1!
HSI1! 2020 May 31 Week (Intraday)
Weekly = TBC | Daily = TBC | H4 = Bullish H1 = price rotation
Bar 1 = weakness, no result from effort
Bar 2 = Upthrust = weakness
Bar 3 = reversal = weakness
Red/Green zone = preferred entry
Immediate support = 28942
If price continues to peel away from the supply (upper line of the channel,
means upward momentum may be weakening / pausing.

HSI1! 17 May 2021 Week (Intraday)
HSI1! 17 May 2021 Week (Intraday)
Weekly = TBC | Daily = Bearish, H4 and below = Bullish
Green zone target was reached last week, and market broke down and reach for the lower green zone.
Market is still making lower highs and in a downtrend, so prefer to short on test of the below levels
Scenario
1) Market may attempt to close gap
2) Short levels 28753 / 28565 / 28231
Have a good trading week ahead.

HSI1! 10 May 2021 Week (Intraday)
HSI1!
HSI1! 10 May 2021 Week (Intraday)
Weekly | Daily = TBC, H4 and below = Bullish
03 May Week - Rejection scenario played out and green zone price target was reached.
After which Bar A dominated the market. The low volume wide spread down bar test of its low at A1 offered good long opportunity; and later climatic bar B as well.
Notice how the demand line of a previous channel (grey) acted as a resistance with the highs tracing that line.
Will market attempt to return to previous channel?
Scenario:
If 28663 is accepted, price may attempt 29820.
Else we may again see green zone as price target.
Have a good trading week ahead.

HSI1! 03 May 2021 Week (Intraday)
HSI1!
HSI1! 03 May 2021 Week
Weekly = Bullish, Daily = Pending, H4 and below = Bearish
Market was within the 29252 - 28440 range
Market currently is oversold as it went below the channel at the moment.
Market may attempt to return to the channel
Scenario:
Acceptance into channel price may try 29200
Rejection: the green zones may be the price target.
Have a good trading week ahead.

HSI1! 2021 Apr 26 Week (Intraday)
HSI1! 2021 Apr 26 Week (Intraday)
It looks like price will try to reach for 29318 and
possibly attempt the resistance level.
Immediate support = 28426 - 28484
Immediate resistance = 29243
Entry preference remains at SR zones.
Remember to like and follow if you find this useful.
Have a good trading week ahead.

HSI1! 2021 Apr 19 Week (Intraday)
HSI1! 2021 Apr 19 Week (Intraday)
Noticed that price weren't able to make its way past the midpoint of the channel.
Is the market weakening?
The support and resistance zone remains. No change to trade levels.
1) Use the range of previous ultra high volume bar as a guide for a immediate support/resistance.
Clue:
Ultra high volume, wide spread down bar is a sign of strength, WAIT for long opportunity in lower TF.
Ultra high volume, wide spread up bar is a sign of weakness, WAIT for long opportunity in LTF.

HSI1! 2021 Apr 12 Week (Intraday)
HSI1! 2021 Apr 12 Week (Intraday)
Bar 2 came down to test supply of Bar 1, and closed off its low.
Price may come back down to test for supply again before moving up.
Will wait for a reversal pattern, preferably at the supply line of the
channel, to long.
Or green/red zones cab be entry zones as well.

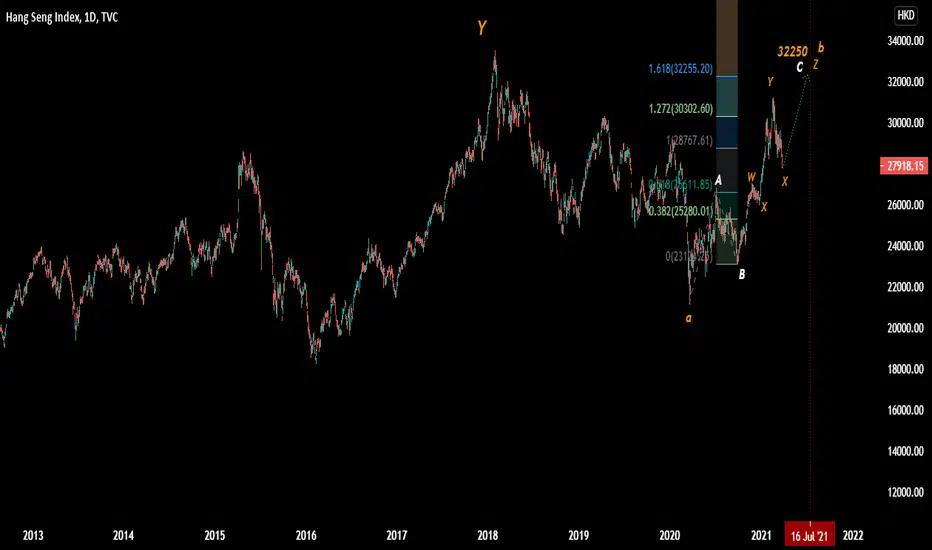
HANG SENG READY FLYWhen the Whole world needs to take some breather , Hong kong is an exeption.
Elliot wave count is somewhat tricky but I tried my best.
Wave Y (double zigzag) completed on Feb2018 . This index took 2 years time to form its first leg of correction(wave a of 'X' wave) The proceeding Wave b,will have a time target of July 2021
At present this index will reach 32255 (C=1.618 times of waveA)marked in white colour.
SELVAM.B
NEOwave practitioner
HSI1! 2021 Apr 05 Week (intraday)
HKEX:HSI1!
HSI1! 2021 Apr 05 Week (intraday)
Daily = bearish | H4 = bullish / H1 = bullish
Last week's short on test of high was only good for 29 Mar as
resistance turned support, after which we had to recognize and
adopt a long strategy.
Demand has weakened, foreseeing the holiday.
Strategy remains that green/red zones remain the preferred entry levels
Like and follow if you find this useful.
Have a profitable trading week.

HSI1! 2021 Mar 29 Week
HSI1! 2021 Mar 29 Week
Daily / H4 = bearish
H1 = bullish
Price came down to support last week
Cognizant of the downtrend, prefer to short on test of high.
Like and follow if you find this useful.
Have a profitable trading week.

HSI1! 2021 Mar 22 Week
HKEX:HSI1!
HSI1! 2021 Mar 22 Week
Red/Green zone = preferred entry
H4 = price rotation
Daily / Weekly = bearish
Levels unchanged. Ultra high buy volume came 1, but are these to distribute?
Bar 2 sell doesn't yield result compared to previous down bars.
So either we continue to see price rotation or there may be long opportunity.
Remember to Like and Follow if you find this useful.
Have a profitable trading week ahead.

HSI1! 2021 Mar 01 Week
HSI1! 2021 Mar 01 Week
Red/Green zone = preferred entry
What a mighty down move from 22 Feb's alert on selling.
On daily chart we see some buying, however note the low volume on buy, so let's watch
on 01 Mar to see if more buy volume will come in to support.
Otherwise we can see 28078-28168 as test of previous support
Previous peak demand zone was at 26414.
Have a profitable trading week ahead. HKEX:HSI1!

HSI1! 2021 Feb 08 Week
HKEX:HSI1!
HSI1! 2021 FEB 08 WEEK
29273 if supported will indicate higher prices.
Friday showed that there's supply present still as
indicated by bar A closing off its high and subsequent
bars closing very near to each other.
Let's see if price can break out or more time is needed
for the buildup
Remember to Like and Follow if you find this useful.
Have a safe and profitable trading week.

HSI1! 2021 Jan Week
HKEX:HSI1!
HSI1! 2021 Jan 25 Week
Red Greed zones = preferred entry levels
Grey box = price rotation
If we look at the daily/weekly chart, the high is nearing 30336, previous resistance.
Immediate price watch 29488, 29672
Resistant3 = 30336 (Previous high, supply area)
Resistant2 = 30098 - 30143
Resistant1 = 29857 - 29905
Support1 = 29323 - 29362
Support2 = 28970 - 29000
Trade Management
Profit target can be 30% / 50% / till next zone
Remember to Like and Follow if you find this useful.
Have a safe and successful trading week ahead.
