Weekly Equities Trade Idea: CRCL Puts (Update)Hello Traders!
I'm providing an update to the CRCL trade idea from Monday July 14th. Here's what I'm watching:
- Price to open within the range from Tuesday July 15th
- Potential imbalance resolve from Monday July 14th at $204.70
- If price breaks Friday July 11th's high at $206.80 the trade is invalidated
Cheers,
DTD
Haramipattern

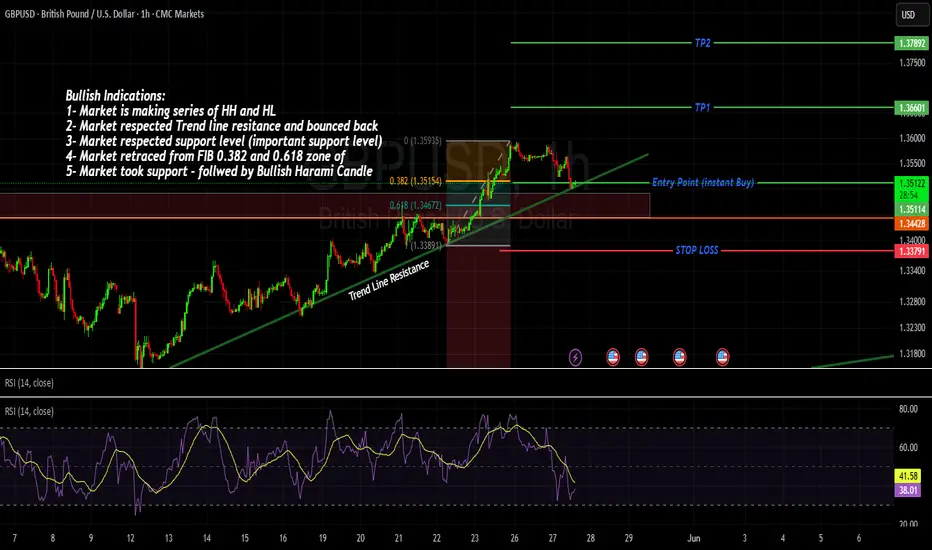
GBPUSD - SO MANY BULLISH CONFLUENCES ! Bullish Indications:
1- Market is making series of HH and HL
2- Market respected Trend line resistance and bounced back
3- Market respected support level (important support level)
4- Market retraced from FIB 0.382 and 0.618 zone of
5- Market took support - followed by Bullish Haram Candle
Entry point - Instant Buy
SL below last LH (Although too much, but safe play)
TP1 and TP11 (with 1:1 and 1:2)
Mastering Candlestick Patterns for better trades!Candlestick patterns are a powerful tool for identifying market sentiment and potential reversals. Let's break down some key single and double candlestick formations seen in this chart:
🕯️Single Candlestick Patterns:
- Doji – Represents indecision in the market, signaling a potential reversal.
- Inverted Hammer – A bullish reversal pattern after a downtrend, indicating buyers are stepping in.
- Long-Legged Doji – Suggests market uncertainty; watch for confirmation before taking a position.
- Bearish Closing Marubozu – A strong bearish signal showing sellers' dominance, with no upper wick.
- Bullish Opening Marubozu – A strong bullish candle with no lower wick, signaling a potential uptrend.
🕯️Double Candlestick Patterns:
- Bullish Engulfing – A strong bullish reversal pattern where the green candle fully engulfs the previous red candle, signaling buying pressure.
- Bullish Harami – A potential trend reversal where a small green candle is "inside" the previous large red candle, indicating a slowdown in selling.
- Cross Doji – Suggests hesitation between buyers and sellers, often appearing before a reversal.
How to Use Them in Trading?
✔️ Combine candlestick patterns with indicators like RSI, MACD, or Moving Averages for stronger confirmations.
✔️ Look for patterns near key support and resistance levels to increase reliability.
✔️ Always wait for confirmation before entering a trade!

Auro Pharma - Bullish Harami - Daily Time Frame#AuroPharma
PCR : 0.78
Daily Volume : ++ 2.8x
Daily Fut OI change : +2.3
ATM IV : 27.6 (+1.5)
IVP : 16

BUY CUB cmp 144.50, target min 166 then 180/200 SL- 129CUB correction is completed both price-wise and time-wise. From this month it has strong potential upside with minimum target of 166 around, then 180 and 200 levels. 2nd target of 180 and 3rd target 200 can come in next month or next to next month but 166 is almost confirmed. This view will fail if it close on or below 130 levels. so the risk is very less from current levels and the rewards are very high with short term time frame. Fundamentally, the fair value of the stock near to 175-180 levels going with earnings of fy25-26 and with fy24, its still stand to value near 155-160 levels so there is a tremendous potential in value unlocking. NIMs of the bank likely to improve given the interest rate downtrend to start and the cost of borrowing will reduce resulting in improvement of margins. NPAs recovery is already going since last 3-4 quarters and it has reduced. Credit growth is expected to grow given the digitalisation in approval process, ties up with NBFC and expanding to new areas of credit growth. Branches increased last year, however still concentrated in TamilNadu, so any improvement in that state directly impacts cub. Recently the key person in higher management has changed with strong banking experience in big banks and mid size bank as well. Expect the strong turnaround for cub in coming quarters, so 200 is just the levels but it wont be surprising even it cross new lifetime highs when numbers are out. Multiple brokerage house knew this and gave a buy call, it is just a matter of time that Investor's patience soon going to be rewarded. Good luck.

Lululemon Athletica ( NASDAQ: $LULU) Continuous Bullish TrendThe 50-day Moving average is above the 200-day moving average indicating the bulls are driving NASDAQ:LULU price up.
Investors have been pushing the share price higher, NASDAQ:LULU still appears to have upward momentum. This is a positive sign for the stock's future value.
The candle stick movement of NASDAQ:LULU indicates a large Bullish Harami forming.

DXCM - bottom fishing (swing trade)DXCM had been essentially a range bound stock in the past 3 years, forming what is potentially a long term head & shoulders formation (bearish if break down). However, it looks like the odds of breaking down has diminished with a bullish monthly pin bar now forming after finding support at its 88.6% fib retracement (imperfect double bottom).
The stock is still below its 200 day MA but this MA is less relevant for a stock that is just ranging sideways for the past few years. It can still be a good candidate for swing trade due to its wide range.
The daily chart is starting to exhibit reversal patterns with higher highs (HH) and higher lows (HL). The recent earnings gap up on huge volume was a good catalyst. And the subsequent pullback to almost close the gap (and today's "bullish harami" to signify potential rebound) provided an opportunity to long at lower risk.
Ready to test a small long position with initial stop loss just under $83.50 (allowing for gap fill that might still stand a small chance of happening IMO)
Disclaimer:
This is just my own analysis and opinion for discussion and is NOT a trade advice. Kindly do your own due diligence and trade according to your own risk tolerance and don't forget that money management (ie trailing stop loss and position sizing) is (probably the most) important!
Take care and Good Luck!

Bearish Trend Detected in BCHUSD - Potential Trading OpportunityGreetings, Traders! Today, we have an intriguing opportunity to discuss the bearish trend in the BCHUSD crypto pair. After carefully analyzing the 1-hour chart, we have identified potential entry, stop loss, and take profit levels for this trade. Let's delve into the details.
Crypto Pair: BCHUSD
Entry Price 1: 252.076
Entry Price 2: 252.176
Stop Loss: 256.638
Take Profit 1: 242.490
Take Profit 2: 247.146
Technical Analysis:
The BCHUSD crypto pair has been exhibiting a distinct bearish trend on the 1-hour chart. Recently, a bearish harami candlestick pattern has formed, confirming the bearish sentiment and providing a potential trading opportunity.
Based on this pattern and price action, we suggest entering the trade at two price levels: 252.076 and 252.176. These entry prices align with the bearish trend and provide an opportunity to capitalize on the anticipated downward movement.
Trade Plan:
Entry Prices: We recommend entering the trade at 252.076 and 252.176 to take advantage of the bearish momentum in the BCHUSD crypto pair.
Stop Loss: To manage risk, it is crucial to set a stop loss order at 256.638. This level will help protect your position in case of any unexpected upward reversal.
Take Profit Targets: The suggested take profit levels are set at 242.490 and 247.146, aiming to capture potential profits within the bearish trend. Adjustments can be made based on your personal risk tolerance and market conditions.
Please note that closely monitoring the price action is essential, and it's crucial to adjust your positions accordingly if the market dynamics change significantly.
Disclaimer: This analysis is based on technical factors and the bearish harami candlestick pattern observed in the BCHUSD crypto pair. Always conduct thorough research, consider other market factors, and seek advice from a qualified financial advisor before making any investment decisions.
Remember that trading cryptocurrencies involves substantial risk, and it's important to be well-informed and make informed decisions.
Happy Trading!
Disclaimer: The above post is for informational purposes only and should not be considered as financial advice. Trading in cryptocurrencies involves risks, and it is important to conduct thorough research and consult with a qualified financial advisor before making any investment decisions.

How to Trade Bearish Harami PatternsHow to trade bearish harami patterns with entries and stop levels.

USD JPY 27 - July - 2021
USD JPY SHORT
Trade it based on what market will do next hours
I used 100 MA and 3 MA to define the trend on daily chart.
I used fibs from lowest point after trend changed to see the levels
On daily/ weekly/ monthly chart I identify " Bearish Harami " that indicate me a possibility of trend change .
Bearish scenario :
I aim for the lowest price of the month
If current 4 H candle will close under 110.000 I will go short using following entry price, stop and TP
I will entry at 109.980
My SL is @110.230 that's 250 Pips lose
My final TP is @ 109.083, that's a 897 Pips gain
Overall I have 3.59 R/R
After price hit at least 1-1 R/R, I move SL to entry point so I will limit any kind of loses.

Possibility of Bearish HaramiIf the next candle(s) close come lower than the green candle, it may build a Bearish Harami pattern and you may think about setting your Stop Sell limit.

BTC - A good bullish sign.In my last BTC analysis, I warned about the Head and Shoulders , and if triggered, could sink the prices all the way back to U$ 3850. Fortunately, the ghost of this bear pattern is disappearing (almost completely), and the bulls are showing strength.
Now we see that the price respected the upward trendline (purple), and a harami cross pattern appeared in the chart (yesterday). Today occurred the breakout of yesterday’s high, confirming a long setup. Let’s hope the price will maintain at high levels, because if they drop below yesterday’s low or under the purple line, and close at that level, it will put the trade in danger.
If the price close above the harami, probably the BTC will breakout the U$ 7306 (first challenge) and will seek the U$ 9.2k again (previous top/target).
The U$ 9.2k is the most important region here, it served as support and resistance in the past (rectangles) and is a good technical target to aim.
