HARDUSDT – Professional Analysis: Blue Box Resistance ZonesHARDUSDT is currently testing crucial levels, and the blue boxes are clearly acting as strong resistance areas. These levels aren’t arbitrary—they've been identified through careful analysis of price behavior and historical reaction, which is why I consistently deliver a high win rate that you can verify on my profile.
Key Insights:
Blue Boxes as Resistance: These zones have repeatedly proven to be where sellers step in, creating significant barriers for upward price movement.
Confirmation is Crucial: I never trade blindly. I wait for clear lower time frame (LTF) confirmations—if HARDUSDT rejects at these resistance levels with a clean LTF downward breakdown and confirmed by CDV signals, that is my cue for a short entry.
Adaptive Strategy: If, by chance, the price breaks above these blue boxes with strong volume and then retests them as support, I will adjust my strategy and consider a long position. I never insist on a short idea; I simply respond to what the market tells me.
How to Trade:
Short Setup:
Wait for HARDUSDT to approach the blue boxes.
Look for rejection signals on the lower time frames (5-minute, 15-minute).
Confirm with CDV and other technical indicators that the downward momentum is intact before entering a short.
Potential Long Shift:
If the resistance is broken with significant volume and a successful retest, be prepared to switch the bias to long.
This adaptive approach is what separates professional trading from mere speculation.
Why Follow This Analysis:
I operate at a level that most traders don’t reach—using a disciplined, data-driven approach that ensures every entry is validated by robust market signals. My methodology has been refined over years of experience, which is why my trading success is among the highest around.
If you’re serious about trading profitably, you need to follow strategies rooted in precision, discipline, and market-tested confirmations. Trust the process, follow the analysis, and let the market work in your favor.
Stay sharp and trade with confidence, your success depends on it.
📌I keep my charts clean and simple because I believe clarity leads to better decisions.
📌My approach is built on years of experience and a solid track record. I don’t claim to know it all but I’m confident in my ability to spot high-probability setups.
📌If you would like to learn how to use the heatmap, cumulative volume delta and volume footprint techniques that I use below to determine very accurate demand regions, you can send me a private message. I help anyone who wants it completely free of charge.
🔑I have a long list of my proven technique below:
🎯 ZENUSDT.P: Patience & Profitability | %230 Reaction from the Sniper Entry
🐶 DOGEUSDT.P: Next Move
🎨 RENDERUSDT.P: Opportunity of the Month
💎 ETHUSDT.P: Where to Retrace
🟢 BNBUSDT.P: Potential Surge
📊 BTC Dominance: Reaction Zone
🌊 WAVESUSDT.P: Demand Zone Potential
🟣 UNIUSDT.P: Long-Term Trade
🔵 XRPUSDT.P: Entry Zones
🔗 LINKUSDT.P: Follow The River
📈 BTCUSDT.P: Two Key Demand Zones
🟩 POLUSDT: Bullish Momentum
🌟 PENDLEUSDT.P: Where Opportunity Meets Precision
🔥 BTCUSDT.P: Liquidation of Highly Leveraged Longs
🌊 SOLUSDT.P: SOL's Dip - Your Opportunity
🐸 1000PEPEUSDT.P: Prime Bounce Zone Unlocked
🚀 ETHUSDT.P: Set to Explode - Don't Miss This Game Changer
🤖 IQUSDT: Smart Plan
⚡️ PONDUSDT: A Trade Not Taken Is Better Than a Losing One
💼 STMXUSDT: 2 Buying Areas
🐢 TURBOUSDT: Buy Zones and Buyer Presence
🌍 ICPUSDT.P: Massive Upside Potential | Check the Trade Update For Seeing Results
🟠 IDEXUSDT: Spot Buy Area | %26 Profit if You Trade with MSB
📌 USUALUSDT: Buyers Are Active + %70 Profit in Total
🌟 FORTHUSDT: Sniper Entry +%26 Reaction
🐳 QKCUSDT: Sniper Entry +%57 Reaction
📊 BTC.D: Retest of Key Area Highly Likely
📊 XNOUSDT %80 Reaction with a Simple Blue Box!
📊 BELUSDT Amazing %120 Reaction!
I stopped adding to the list because it's kinda tiring to add 5-10 charts in every move but you can check my profile and see that it goes on..
HARDBTC

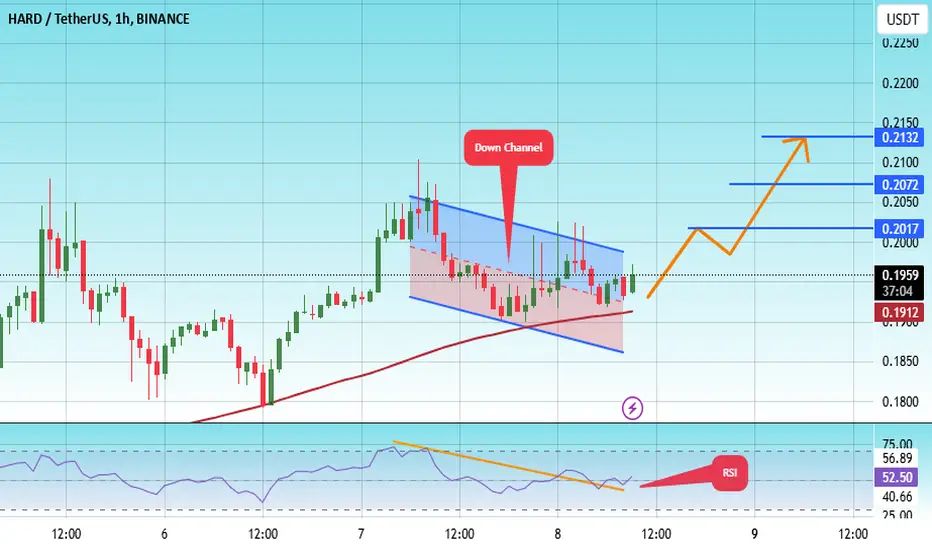
#HARD/USDT Ready to go higher#HARD
The price is moving in a descending channel on the 1-hour frame and sticking to it well
We have a bounce from the lower limit of the descending channel, this support is at 0.1880
We have a downtrend on the RSI indicator that is about to be broken, which supports the rise
We have a trend to stabilize above the moving average 100
Entry price 0.1960
First target 0.2017
Second target 0.2072
Third target 0.2132
HARD looks bullishIt looks like a large diametric is running out. The condition for completing this diametric is to maintain the green area.
This diametric looks like our big B wave with the data on the chart.
By maintaining the green range, it can move towards the specified TPs.
Closing a daily candle below the invalidation level will violate the analysis.
For risk management, please don't forget stop loss and capital management
When we reach the first target, save some profit and then change the stop to entry
Comment if you have any questions
Thank You

HARD/BTC - Kava Lend: Trend_Reversal◳◱ An intriguing development has unfolded on the AMEX:HARD / CRYPTOCAP:BTC chart as we've identified a compelling Trend Reversal. This shift in price dynamics indicates a noteworthy potential trend change. It's crucial for us to pay attention to the next resistance levels located at 0.00000445 | 0.00000455 | 0.0000048 and the significant support levels found at 0.0000042 | 0.00000405 | 0.0000038. Taking these factors into consideration, it may be prudent to contemplate entering a buy position at the current price of 0.00000432, allowing us to take advantage of the projected trend continuation.
Let's keep a watchful eye on this exciting opportunity and stay proactive in our trading strategies.
◰◲ General info :
▣ Name: Kava Lend
▣ Rank: None
▣ Exchanges: Binance
▣ Category/Sector: N/A
▣ Overview: Kava Lend project overview is currently unavailable. I'll try to update this in the upcoming analysis.
◰◲ Technical Metrics :
▣ Mrkt Price: 0.00000432 ₿
▣ 24HVol: 0.154 ₿
▣ 24H Chng: 4.854%
▣ 7-Days Chng: N/A
▣ 1-Month Chng: N/A
▣ 3-Months Chng: N/A
◲◰ Pivot Points - Levels :
◥ Resistance: 0.00000445 | 0.00000455 | 0.0000048
◢ Support: 0.0000042 | 0.00000405 | 0.0000038
◱◳ Indicators recommendation :
▣ Oscillators: BUY
▣ Moving Averages: STRONG_BUY
◰◲ Technical Indicators Summary : STRONG_BUY
◲◰ Sharpe Ratios :
▣ Last 30D: N/A
▣ Last 90D: N/A
▣ Last 1-Y: N/A
▣ Last 3-Y: N/A
◲◰ Volatility :
▣ Last 30D: N/A
▣ Last 90D: N/A
▣ Last 1-Y: N/A
▣ Last 3-Y: N/A
◳◰ Market Sentiment Index :
▣ News sentiment score is N/A
▣ Twitter sentiment score is N/A
▣ Reddit sentiment score is 0.53 - Bullish
▣ In-depth HARDBTC technical analysis on Tradingview TA page
▣ What do you think of this analysis? Share your insights and let's discuss in the comments below. Your like, follow and support would be greatly appreciated!
◲ Disclaimer
Please note that the information and publications provided are for informational purposes only and should not be construed as financial, investment, trading, or any other type of advice or recommendation. We encourage you to conduct your own research and consult with a qualified professional before making any financial decisions. The use of the information provided is solely at your own risk.
▣ Welcome to the home of charting big: TradingView
Benefit from a ton of financial analysis features, instruments and data. Have a look around, and if you do choose to go with an upgraded plan, you'll get up to $30.
Discover it here - affiliate link -

Bullish Momentum with CautionHARD is currently trading at a price of $0.1500 area. Looking at the Relative Strength Index (RSI) of 70, it indicates that the coin is in the overbought territory. This suggests that the buying pressure has pushed the price to a level that may not be sustainable, potentially leading to a reversal or correction in the near future.
Considering the Exponential Moving Averages (EMAs), both the EMA 50 and EMA 100 indicate an upward trend. The EMA 50 has a value of 0.1306, indicating that HARD has been experiencing a medium-term upward trend. Similarly, the EMA 100 with a value of 0.1367 also suggests an upward trend, although slightly slower than the EMA 50. These bullish EMAs indicate positive sentiment for HARD.
The Moving Average Convergence Divergence (MACD) is -0.0023, which indicates a bearish signal. This suggests that the short-term momentum for HARD might be weakening, potentially leading to a temporary slowdown or correction in price.
In terms of Fibonacci retracement levels, the 4-hour timeframe provides us with three levels to consider. The 0 Fibonacci level at 0.1210 suggests a potential support level, where the price might find stability or bounce back from a downward movement. The 0.5 Fibonacci level at 0.1346 indicates a potential point of equilibrium or consolidation, where the price might experience a temporary balance between buyers and sellers. Finally, the 1 Fibonacci level at 0.1483 represents a potential resistance level, where the price might face selling pressure and struggle to move higher.
Considering all these indicators together, we can conclude that HARD has been experiencing an upward trend, supported by the positive EMAs. However, the overbought RSI and the bearish MACD signal caution that a short-term correction or consolidation may be imminent. Traders and investors should closely monitor the Fibonacci retracement levels for potential areas of support and resistance, as they can provide valuable insights for decision-making.

Kava Lend (HARD) formed bullish Gartley | A good buy opportunityHi dear friends, hope you are well and welcome to the new trade setup of Kava Lend (HARD) with BTC pair.
Our last trade of HARD was below, and we caught more than 130% pump.
Now on a 2-hr time frame, HARD has formed a bullish Gartley pattern for another bullish reversal move.
Note: Above idea is for educational purpose only. It is advised to diversify and strictly follow the stop loss, and don't get stuck with trade

HARD ; im Looking for a pump %43HARDUSDT after broke resistance , next target is above 0.7 level.
Red trendline resistance broke and now the price is stay above that.
if the price stays above this resistance then more pump is ahead to the targets that are mentioned on the chart but if the price goes below the trendline once again then we can expect correction.
I think that it could be more pump and send it above $1 if the btc remain above 46k.
Happy trading

$HARD trend reversal. Falling wedge has broken. 0.92-1.4$Hi dear readers. We are looking at @kavalend / Hard protocol 1h and daily charts. $HARD made double bottom making 0.63USDT on January 10th 2022 which is matches to December lows 2021.
As you know it is reversal pattern. $HARD had broken falling wedge pattern on 1h timeframe and is going to hit 0.91-0.92USDT short term target.
At the same time, you can notice W pattern on daily timeframe which is going to play out.
Soon 1.4 USDT resistance will be broken and $HARD is free to fly to the moon.
My target for $HARD in 2022 is 16-20$.

HARDUSDT coin analysis👑 ̲F̲X̲o̲n̲e̲4̲a̲l̲l̲ 👑 VIP 🚀🚀,
🟢 #HARD - USDT 🔚BINANCE
💰 buy Now : 0.77 ( strong coin )
🔸TARGET
🔹 1.04
🔹 1.29
🔹2.21

HARDUSDT Technical Analysis
💎 HARDUSDT has broken above the resistance and the triangle. After the breakout and retest it is expected to go higher. The last large green candle shows that the Bulls are in control
🌐 Tradingview
💵 Invest Only 5% of your Portfolio
🎳 Entry/Pullback now or from 1.1146 - 1.0474
☕️ TP1 1.2001
🍺 TP2 1.3605
🍻 TP3 1.5220
🍾 TP4 1.6780
🍷 TP5 1.8373
🍸 TP6 2.0000
🍹 TP7
🎁 TP8
🚫 SL 1.0397 - 0.9776
Good Luck 🎲
Check the Links in Description and if you LIKE this analysis, please support our page and Ideas by hitting the LIKE 👍 button. ❤️ Your Support is really appreciated! ❤️
Traders, if you have your own opinion about it, please write your own in the comment box. We will be glad for this.
Feel free to request any pair/instrument analysis or ask any questions in the comment section below.
We will have more FREE forecasts in TradingView soon
Have a profitable day 😊👍🏻

HARDBTC Technical Analysis⏳ Spot
💎 HARDBTC has got rejected from the resistance zones several times but the Support zone also has been pushing the price higher. After breaking above the resistance it is expected that the price goes higher
🌐 Tradingview
💵 Invest Only 5% of your Portfolio
🎳 Entry/Pullback now or from 0.00001674 to 0.00001524
☕️ TP1 0.00001836
🍺 TP2 0.00002229
🍻 TP3 0.00002657
🍾 TP4 0.00003101
🍷 TP5 0.00003500
🍸 TP6
🍹 TP7
🎁 TP8
🚫 SL 00.00001524 to 0.00001383
Good Luck 🎲
Check the Links in Description and If you LIKE this analysis, Please support our page and Ideas by hitting the LIKE 👍 button. ❤️ Your Support is really appreciated! ❤️
Traders, if you have your own opinion about it, please write your own in the comment box. We will be glad for this.
Feel free to request any pair/instrument analysis or ask any questions in the comment section below.
We will have more FREE forecasts in TradingView soon
Have a profitable day 😊👍🏻


HARDUSDT BULLISH SIGNAL UPDATE!!As you all know, HARD is not performing well from last 6 weeks and according to the Chart patterns, Ascending Channel is formed, Breakout formation and also indicators giving bullish signal.
Short term Trade, DYOR Before taking trade, as i'm not responsible for your loss.
RISK FACTORS:
Market/ BTC CRASH
Happy Trading :)
Good Luck!
If you like my idea, please support:
Binance Smart Chain ( BSC ): 0x69Ea86D0f6B762fC36A322b0C833D2bd04534b3d

HARDUSDT Technical Analysis⏳ Spot
💎 HARDUSDT has been above a very significant support level. After several rejections it has eventually formed an extended flag pattern . We have a rejection from the upper band of the channel so the first TP would be the upper band of the channel, after the breakout and retest it can go higher
🌐 Tradingview
🏁 Short & Medium Term
💵 Invest Only 5% of your Portfolio
🎳 Entry at Market or at 0.9226 - 0.9361
☕️ TP1 1.0220
🍺 TP2 1.1700
🍻 TP3 1.3333
🍾 TP4 1.5777
🍷 TP5 1.8000
🍸 TP6
🍹 TP7
🎁 TP8
🚫 SL 0.8666
Good Luck 🎲
Check the Links in Description and If you LIKE this analysis, Please support our page and Ideas by hitting the LIKE 👍 button. ❤️ Your Support is really appreciated! ❤️
Traders, if you have your own opinion about it, please write your own in the comment box. We will be glad for this.
Feel free to request any pair/instrument analysis or ask any questions in the comment section below.
We will have more FREE forecasts in TradingView soon
Have a profitable day 😊👍🏻

HARD/USDTI might be wrong , but HARD/USDT is ready to explode in short term.
I bought here , Targets on chart.
SL daily close below $0.85
NOT FINANCIAL ADVICE.

HARD to the upsideYOUR LIKE OR COMMENT IS MY FUEL FOR NEXT ANALYSIS :) IF U HAVE ANY QUESTION REACH ME HERE
This is not a financial advice. Always do your own research and always put stoploss in your trade (SL) :) If you want more detailed info
how to study and read charts or just need help with some coin, just write to me here a comment, i will try to answer to everybody...
i can help you :) all for free, don't worry, BE HAPPY!

HARDUSDT BULLISH SIGNAL UPDATE!!As you all know, HARD is not performing well from last 6 weeks and according to the Chart patterns, Ascending Channel is formed, Breakout formation and also indicators giving bullish signal.
Short term Trade, DYOR Before taking trade, as i'm not responsible for your loss.
RISK FACTORS:
Market/ BTC CRASH
Happy Trading :)
Good Luck!
If you like my idea, please support:
Binance Smart Chain ( BSC ): 0x69Ea86D0f6B762fC36A322b0C833D2bd04534b3d

HARDUSDT { HARD PROTOCOL } - BULLISH SETUPANALYSIS 🔎
- HARDUSDT hit a swing high and retraced.
- Price retested the all-time low support.
- There was a relatively high concentration of buyers at that zone.
- The downtrend was resisted by the descending trendline resistance.
- Price brokeout above the descending trendline resistance.
- This is a bullish signal.
BUY ENTRY ⬆️
- Market entry: current market price.
- Stop limit entry: breakout above the horizontal resistance level (@0.844).
- Limit entry: Retest of the swing low support (@0.5427).
TARGETS 🎯
- Horizontal resistance level (@1.535).
- Horizontal resistance level (@2.6601).
- Horizontal resistance level (@2.998).
SETUP INVALIDATION ❌
- Initial invalidation: breakdown below the support level (@0.5427).
- Final invalidation: breakdown below the all-time low support (@0.3811).

HARDBTC Wait For the Breakout
Welcome back Traders, Investors, and Community!
Hi Traders, HARDBTC on H4 if it breaks above the Resistance it could go higher.
⬆️Buy now or Buy at 0.00001699
⭕️SL at 0.00001596
✅TP1 @ 0.00001965
✅TP2 @ 0.00002285
✅TP3 @ 0.00002770
We will have more FREE forecasts in TradingView soon
❤️ Your Support is really appreciated!❤️
Have a Profitable Day

[ALERT] KAVA/BTC BULLISH OWL FORMATIONKAVA is the truth. You can stake it for well over 30%. 60% of the current supply is locked up in staking right now. They'll be releasing a swap on their platform within the next two weeks. I really like their phone app Cosmostation. Expect this one to be a player in the next generation of cryptos. Start building that bag now friends while it's got a low market cap. Target for 4k by 2022.

$hardclosing daily or 4H above 2800 sat with bullish retest is where the magic is happen.
Weekly RSI is on oversold area.
Volume is increasing slightly last couple hours.


