GBPUSD ShortTime Frame: 4H
Symbol: GBPUSD
Entry: 1.14047
TP: 1.12198
SL: 1.15235
Bias: Short
Current flow of price dynamics is suggestive of a non-directional range bound trades. The optimism for a trending situation or the euphoria of momentum and volatility both are are absent. We are projecting our trade set ups based upon recent movement propensity.
Harmonicforex

GBPUSD ShortTime Frame: 4H
Symbol: GBPUSD
Entry: 1.14357
TP: 1.12138
SL: 1.16392
Bias: Short
The forex pairs are in a tight range and the oscillations are rather switching between support to resistance and resistance to support . Our technical analysis based on dynamic support and resistance display optimism for the set up we have projected here.

GBPUSD ShortTime Frame: 4H
Symbol: GBPUSD
Entry: 1.14605
TP: 1.12558
SL: 1.15851
Bias: Short
Recently dollar is showing weakness against other currencies in short time frames. Most of the dollar dependent currencies are showing bullish bias.

GBPUSD ShortTime Frame: 4H
Symbol: GBPUSD
Entry: 1.14340
TP: 1.12775
SL: 1.15821
Bias: Short
We are bearish. The price may move further down and create an ambience for a short term selling opportunity.

GBPUSD ShortTime Frame: 4H
Symbol: GBPUSD
Entry: 1.12121
TP: 1.09763
SL: 1.13845
Bias: Short
The price pattern of these instruments is getting more range bound and offering less scope to take a bigger or bold directional steps. The price levels are hardly getting broken due to lack of fervor in the market. Our goal is to seek opportunities from the inefficiencies that exist in the market.

GBPUSD ShortTime Frame: 4H
Symbol: GBPUSD
Entry: 1.12519
TP: 1.10268
SL: 1.14195
Bias: Short
We are bearish for this instrument. The price level might drop from the current level.

GBPUSD NeutralTime Frame: 4H
Symbol: GBPUSD
Bias: Neutral
The current price pattern of this pair is showing a weak market condition. The dynamic support and resistance also not displaying any edge to go for a strong trading opportunity. Considering the current volatility and the oscillations in the market , we have tactfully projected the trade set ups.

GBPUSD ShortTime Frame: 4H
Symbol: GBPUSD
Entry: 1.15283
TP: 1.12535
SL: 1.17090
Bias: Short
The price pattern of this instrument is suggestive of a range-bound and low volatility set up. We are not very optimistic about any strong directional opportunity. We have projected in the chart according to impulsive move structure.

GBPUSD ShortTime Frame: 4H
Symbol: GBPUSD
Entry: 1.15166
TP: 1.12864
SL: 1.17090
Bias: Short
We have no major directional bias. Dollar will remain strong in spite of all difficulties. We assume that the dollar will strengthen further and the other currencies related to it will decline in recent weeks.

CYPHER Harmonic Pattern - Made Easy For Everyone !The Cypher harmonic pattern is a technical analysis indicator used by traders to identify valuable support and resistance levels based on the Fibonacci sequence of numbers and detect trend reversals.
Here, in this article, we explain how the Cypher harmonic pattern works, identify it, and trade it.
What is the Cypher Harmonic Candlestick Pattern?
The Cypher harmonic pattern is a technical analysis formation indicating a price-action reversal.
The pattern was discovered by D. Oglesbee and is known as a relatively advanced pattern formation. In structure, the Cypher pattern is similar to the butterfly harmonic pattern; however, the Cypher is not a very common chart pattern due to its unique Fibonacci ratios.
The Cypher pattern, which can be either bullish or bearish, has five points (X, A, B, C, and D) and four legs (XA, AB, BC, and CD). Like any other harmonic pattern, the theory behind the Cypher chart pattern is that there is a strong correlation between Fibonacci ratios and price movements.
Eventually, the market is expected to reverse from point D after the four market swing wave movements
How to Identify and Use the Cypher Harmonic Pattern in Forex Trading?
Much like any other harmonic chart pattern, several conditions must occur so you can identify the Cypher pattern:
B point retracement of the primary XA leg ranges between 38.2% to 61.8% Fibonacci levels
C point is an extension leg with a Fibonacci ratio that should be between 127.2% to 141.4% of the primary XA leg
D point should break the 78.6 retracement level of XC
Let’s see what the Cypher harmonic pattern looks like on a trading chart.
Cypher Pattern – Set a Stop Loss
A reasonable stop-loss level when trading the Cypher pattern is simple and does not necessarily require the combination of Fibonacci retracement.
All you need to do is to place the stop loss somewhere below the D level because if this level breaks, the entire Cypher pattern is invalidated. So, the stop would be placed at the next support or resistance level, which is the X-point
Cypher Pattern – Set a Take Profit Target
The simple Cypher pattern trading method is using its points as profit targets, meaning the A and C levels.
How accurate is the Cypher harmonic chart pattern?
The Cypher harmonic pattern has been historically proven to be a fairly reliable and accurate chart pattern. According to various studies, the pattern has an accuracy rate of around 70%.

GBPUSD ShortTime Frame: 4H
Symbol: GBPUSD
Entry: 1.15418
TP: 1.12550
SL: 1.17394
Bias: Short
The price pattern of these instruments is getting more range bound and offering less scope to take a bigger or bold directional steps. The price levels are hardly getting broken due to lack of fervor in the market. Our goal is to seek opportunities from the inefficiencies that exist in the market.

GBPUSD ShortTime Frame: 4H
Symbol: GBPUSD
Entry: 1.15863
TP: 1.12968
SL: 1.18391
Bias: Short
The current price pattern of the forex pair is denoting a paradigm shift because of recent price fluctuation. The study of recent support and resistance proves that the course of price action will abide by our projected trajectory.

GBPUSD ShortTime Frame: 4H
Symbol: GBPUSD
Entry: 1.15719
TP: 1.12851
SL: 1.18126
Bias: Short
The dynamic support and resistance of the instrument is showing a possible price drive towards the projected area. We are more interested in the spots that we have drawn on chart and trying to align our goals according to projections.

InvestMate|CAD/JPY Will we go higher or is this already a peak?CAD/JPY Will we go higher or is this already a peak?
🍁Unemployment remaining low at 5.2%.
🍁Inflation slowly slowing The latest reading on 19 October indicated 6.9% which, compared to the peak of 8.1% recorded in June, offers a breath of optimism.
🍁Interest rates definitely higher than in the EU. At 3.25%. With the next rate hike due on 10 October, the market assumes it will be a 75 basis point hike to 4%.
🍁Trade balance at a high of C$1.52B in August. On 3 November we will find out how much it amounted to in September. Canada is now seeing very strong trade volumes. The highest in a decade.
🍁Manufacturing PMI low of 49.80 points.
tradingeconomics.com
🍁The Consumer Confidence Index is falling but neither all-time highs nor a "crisis" state is just low at 48.51 points.
tradingeconomics.com
🍁Will we see this reflected in the chart of these currencies?
🍁💴On the other side of the globe.
💴In Japan, no change.
💴Unemployment Rate low at 2.5%
💴Inflation low 3%. Japan is one of those countries that has not been hit by Inflation as much as Europe and the USA.
💴Interest rates at -0.1%. Still negative from 2016. Hence these falls in the Yen. When other countries raise rates causing their currencies to strengthen, their strength against the Yen increase.
💴For now, there are no increases on the horizon. The Bank of Japan says it has no intention of changing its monetary policy.
💴But the government doesn't want the Japanese Yen so cheap either, hence in recent days we have seen sharp falls which were interventions to stop the Yen weakening sharply against other currencies.
💴I don't think this will stop investors from pushing prices up again.
💴 Looking at the sytcajci of both currencies, I don't think anything has changed in the current trend over the months. The only threat could be unexpected monetary interventions to strengthen the Yen
📈Meanwhile on the chart.
📈On 21 October we made a double top and then after the intervention we went down into the support zone and there was a sharp overbought period.
📈Turning to the monthly chart, the first thing that catches our eye is a harmonic formation called gartley.
📈If the harmonic formation were to be fulfilled we can expect a rise to the range of the largest downward wave at the 0.786 level.
📈Assuming a stop below the post-intervention lows and a take profit at 0.786, this gives us a profit/risk range of 2.52.
🚀If you appreciate my work and effort put into this post I encourage you to leave a like and give a follow on my profile.🚀

GBPUSD NeutralTime Frame: 4H
Symbol: GBPUSD
Bias: Neutral
We do not see any strong opportunity here for this pair. We vote for a neutral position.

PRZ as Gartley and AB=CD pattern on EURUSDHello traders!
I have spotted and interesting opportunity to sell intraday. There's a Gartley pattern in formation (and I believe it'll extend to 0.886) in which the CD leg also completes an AB=CD pattern on ratios 0.704:1.44. This is a medium high harmonic pattern. It's highly probable that it'll hit TP1 from my perspective. TP2 could happen, but TP3 could be so much to ask. This is a reversal, so stick with TP1 if enter this way or planning into go short with another strategy. Good luck in the markets and also wait for the price to completely the pattern. Normally Gartley pattern's entry is at 0.786, but the AB=CD is telling me that it could go further into 0.886 of the movement.
Do you have any other ideas? Let me know in the comments.

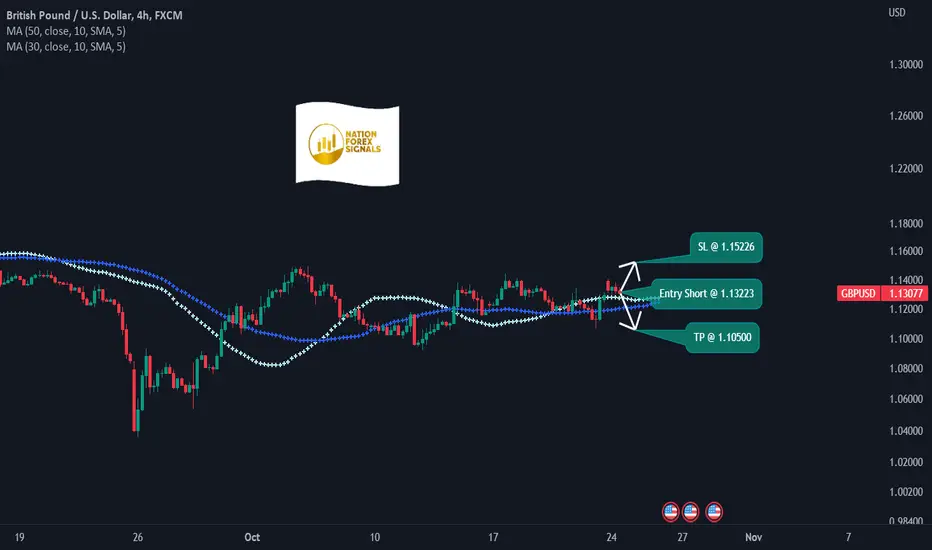
GBPUSD ShortTime Frame: 4H
Symbol: GBPUSD
Entry: 1.13223
TP: 1.10500
SL: 1.15226
Bias: Short
As we see the pair is showing an overbought level and this may result is a reversal and therefore our eyes are on bearish side.
GBPUSD ShortTime Frame: 4H
Symbol: GBPUSD
Entry: 1.11824
TP: 1.09223
SL: 1.13779
Bias: Short
We are bearish for this pair. There is a high probability of a strong price fall following by the current price oscillations that we have seen recently

GBPUSD ShortTime Frame: 4H
Symbol: GBPUSD
Entry: 1.12083
TP: 1.09386
SL: 1.14637
Bias: Short
The pair is not well suited for major trending trades. We can consider the micro trends and follow the micro level opportunities keeping pace with supply and demand and follow the projected trading set ups.

GBPUSD LongTime Frame: 4H
Symbol: GBPUSD
Entry: 1.13705
TP: 1.16921
SL: 1.11020
Bias: Long
The zigzag price pattern of the current set up is denoting a weaker trend in the market. As we do not see any strong price pattern here, we cannot forecast any strong price projection. However, our main strategy is to avail opportunities from short term price fluctuations.

GBPUSD LongTime Frame: 4H
Symbol: GBPUSD
Entry: 1.12976
TP: 1.15905
SL: 1.10977
Bias: Long
For the instruments related to FX pairs, our core focus is in dollar strength. As we see dollar is quite powerful for several months at a stretch. The tempo of dollar is never declining but the traders must be careful in dealing with mercurial price fluctuations all along the price trajectory. Our bias is solely dominated by short term momentum and price action for this pair and we anticipate a price move according to our projection.

GBPUSD > Bullish Harmonic Bat Pattern Near Key Market Level.Analysis of #GBPUSD
Following up on my previous post on GBPUSD here is another way to consider buying GBPUSD.
If the market keeps falling to test back strong demand zone near 1.0600 it will complete a bullish harmonic bat pattern near key market level 1.0600, a good level to consider buying entry
Thanks for your continued support!

GBPUSD ShortTime Frame: 4H
Symbol: GBPUSD
Entry: 1.12640
TP: 1.10136
SL: 1.14809
Bias: Short
We are bearish for this pair. There is a high probability of a strong price fall following by the current price oscillations that we have seen recently.
