📊 Harmonic Patterns Cheat SheetHarmonic Patterns use the identification of quantified chart price action structures that have specific and consecutive Fibonacci ratio alignments that form the visual structures. Harmonic patterns calculate the Fibonacci levels of the price patterns to identify high probability reversal points on the charts. This method believes that harmonic patterns or cycles repeat on charts in cycles repeatedly. The key to using this strategy is to identify these patterns and to use them for creating good risk/reward ratio entries and to exit when a profit target is reached. Positions are taken based upon the odds that the same historic patterns will repeat after entry.
🔹 Butterfly
The structure of the Butterfly pattern requires a specific alignment of Fibonacci measurements at each point within the structure. Most important, a mandatory 0.786 retracement of the XA leg as the B point is the defining element of an Ideal Butterfly Pattern and it acts as the primary measuring point to define a specific Potential Reversal Zone. In many ways, the Ideal Butterfly Pattern is like the Gartley Pattern because it requires a specific B point retracement and possesses a tighter array of Fibonacci ratios within the structure. Specifically, the Butterfly incorporates a 1.27 XA projection with a “tame” BC projection, which is usually only a 1.618. In addition, the Butterfly usually possesses an equivalent AB=CD pattern or an alternate 1.27AB=CD pattern. Although the equivalent AB=CD is a minimum requirement, valid Butterfly structures rarely exceed the alternate 1.27 AB=CD completion point.
🔹 Shark
The Shark Pattern is dependent upon the powerful 88.6% retracement and the 113% Reciprocal Ratio, works extremely well retesting prior support/resistance points (0.886/1.13) as a strong counter-trend reaction. Represents a temporary extreme structure that seeks to capitalize on the extended nature of the Extreme Harmonic Impulse Wave. Demands immediate change in price action character immediately following pattern completion. Extreme Harmonic Impulse Wave utilized depends upon location of 88.6% level – these are minimum requirements. Requires an active management strategy to capture high probability profit segments.
🔹 Gartley
The important features of the Gartley are the specific location of the various points: X,A,B,C and D. The X-A leg is the largest price move in the pattern. It is followed by a counter move of A to B. The first leg, A to B, sets up the potential AB=CD, which is crucial to the completion of the pattern and to the indication of the reversal zone. After a brief and smaller B to C retracement, the C to D leg is established. A precise calculation of the AB=CD will provide a significant potential reversal point. Ideal Gartley The ideal Gartley set-up will be defined by specific Fibonacci retracements. One of the most important numbers in the pattern is the completion of point D at the 0.786 of XA. Although the price action might exceed this number slightly, it should not exceed point X. The pattern is a nice set-up, especially with the convergence of an AB=CD.
🔹 Bat
The Bat pattern is probably the most accurate pattern in the entire Harmonic Trading arsenal. The pattern possesses many distinct elements that define an excellent Potential Reversal Zone. The pattern typically represents a deep retest of support or resistance that can frequently be quite sharp. Quick reversals from Bat pattern PRZs are quite common. In fact, valid reversals from Bat patterns frequently possess price action that is quite extreme. The pattern incorporates the powerful 0.886XA retracement, as the defining element in the Potential Reversal Zone. The B point retracement must be less than a 0.618, preferably a 0.50 or 0.382 of the XA leg. The most ideal B point alignment is the 50% retracement of the XA leg. The B point is one of the primary ways to differentiate a Bat from a Gartley pattern. If a pattern is forming and the B point aligns at a 0.50 of the XA leg, it is likely to be a Bat.
🔹 Three Drive
The three drives pattern consists of a series of higher highs or higher lows. It is similar to the ABCD pattern. The difference is that a Three drives pattern is made of 5 legs, while an ABCD pattern has only 4. Three-Drives is a reversal pattern, so it signals an upcoming change in a trend. Point A is at the 61.8% retracement of the drive 1. Point B is at the 61.8% retracement of the drive 2. Drive 2 is at the 127.2%-161.8% extension of A. Drive 3 is at the 127.2%-161.8% extension of B. You can enter the market when you are sure that the market has formed the point B (buy in a bearish Three-Drive and sell in a bullish Three Drive). Take Profit should be around the 127.2%-161.8% extension of B.
🔹 Cypher
The Cypher pattern, which can be either bullish or bearish, has five points (X, A, B, C, and D) and four legs (XA, AB, BC, and CD). Like any other harmonic pattern, the theory behind the Cypher chart pattern is that there is a strong correlation between Fibonacci ratios and price movements. Eventually, the market is expected to reverse from point D after the four market swing wave movements – X to A, A to B, B to C, and C to D. B point retracement of the primary XA leg ranges between 38.2% to 61.8% Fibonacci levels. C point is an extension leg with a Fibonacci ratio that should be between 127.2% to 141.4% of the primary XA leg. D point should break the 78.6 retracement level of XC.
🔹 AB=CD
In this pattern, the A to B leg is the first price move. After a brief retracement from point B to point C, the pattern will complete the C to D leg, which is the same length as AB. Simply, after the AB and BC legs have been established, you project the AB length from point C… Although the price action will not always be exactly equivalent, the AB=CD legs usually will be close enough to determine the reversal points. Sometimes, this pattern will be exact but I usually wait for the CD leg to at least equal the AB leg. The Fibonacci numbers in the pattern must occur at specific points. In an ideal AB=CD Pattern, the C point must retrace to either a 38.2% at a minimum to validate the structure. The maximum retracement of the AB leg is an 88.6% level that defines a less extreme AB=CD pattern formation but still valid.
🔹 Crab
The Crab is a distinct 5-point extension structure that utilizes a 1.618 projection of the XA leg exclusively. This is the most critical aspect of the pattern and the defining level in the Potential Reversal Zone (PRZ). The extreme (2.618, 3.14, 3.618) projection of the BC compliments the 1.618 XA extension. In addition, the Crab primarily utilizes an alternate AB=CD to compliment the PRZ. Although a minimum AB=CD completion is necessary for a valid structure, the alternate 1.27 or 1.618 calculation are the most frequent cases. The 1.618 AB=CD pattern is the most common alternate calculation utilized in the structure. It is important to note that the alternate AB=CD pattern within the Crab is the least important number in the PRZ.
👤 @AlgoBuddy
📅 Daily Ideas about market update, psychology & indicators
❤️ If you appreciate our work, please like, comment and follow ❤️
Harmonicforex


SPELL: INCREASE VIEWSpell showing interesting view on volume data.
We will check this coin to see if it's able to hold volume

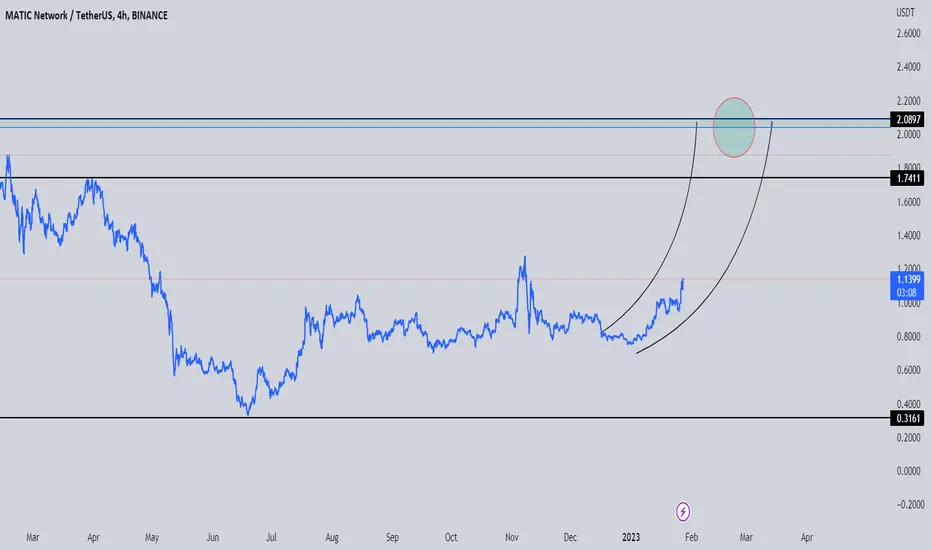
MATIC :DAY TRADING VOLUMEMatic seems interesting for day trading.
we will follow the coin to see if it can get confirmation.
GBPUSD ShortTime Frame: 4H
Symbol: GBPUSD
Entry: 1.23775
TP: 1.22643
SL: 1.24448
Bias: Short
GBP/USD is the forex ticker that shows the worth of the English Pound against the US Dollar. It lets merchants know the number of US Dollars that are expected to purchase an English Pound. The Pound-Dollar is one of the most seasoned and most broadly exchanged cash matches on the planet. Follow the live GBP/USD rate with the graph and stay up with the latest with Pound-Dollar news and investigation. Plan your exchanges with the GBP/USD figure and key turn focuses information and backing and opposition levels.


GBPUSD LongTime Frame: 4H
Symbol: GBPUSD
Entry: 1.24017
TP: 1.24896
SL: 1.23469
Bias: Long
The ongoing value patter of this instrument has a potential for a medium strength cost drive according to our projected bearing. We accept that the projections we have made here will be demonstrated by the quick motions of cost.

IOTX Could Enter Top 40 RANK OF COINS 2023 🌠$0,10 FIRST TARGETIOTX is currently ranked 117th on CoinMarketCap, and depending on our study, it could rise to the top 40 . The Internet of Things is a major trend that is set to revolutionize the world in the same way as Artificial Intelligence. IOT can become with time very important, and IOTX plays a big role in its development.
TA technical analysis
We know IOTX as a coin that has unexpected increases as we saw before, and it's a coin that can go against the trend of BTC .
Last time, we observed a trend in IOTX that seems to indicate an increase. Technical analysis of IOTX is also suggesting further growth.
The Internet of Things can play a crucial role in the future, especially when combined with what IOTX is currently developing and will continue to develop in the future.
Expecting Targets
Depending on our algorithmic trading including the trend and volume study we expect that IOTX is able to break the coming time to $0,10 as an important target.
The big question and that's also the reason for this update, is whether IOTX going to show a huge increase that we did not see before since the last developments. and when we say higher increase we mean a NEW ATH?
We make our trading decisions based on the data and analysis we have done, and our analysis shows a high chance of success, we expect that IOTX may rank in the top 40 and reach a new all time high.
Right now, our focus is on reaching the $0.10 target, We have seen the full effects of 2017 and 2021 on coins, IOTX may be one of the coins that could show a significant increase in the coming time.
I hope you did enjoy reading this content, thank you for reading.

IOTX : VEHICLE TECHNOLOGY WILL EXPLODE IOTX TO THE MOON!As cars become more advanced and connected through the use of IoT technology, they will generate significant amounts of data that can be used for various purposes such as predictive maintenance, traffic management, and even autonomous driving. We believe that IoT technology will play a significant role in the advancement of autonomous driving. In order for cars to become connected, IoT is necessary.
We anticipate that the market for autonomous driving cars will become increasingly prevalent, similar to the growth of electric cars. Overall, the growth of vehicle technology is expected to drive the growth of the IoT market by creating new opportunities for data generation and analysis, improving safety and security, and facilitating the development of smart cities.
Security is a top priority, and Raullen Chai, the co-founder, and CEO of IoTeX, has a strong background in this area. He previously worked for companies such as Google, Uber, and Oracle, and holds a Ph.D. from the University of Waterloo, where his research focused on designing and analyzing lightweight ciphers and IoT authentication protocols.
We believe that IOTX is currently the best option for IoT on the market and in the crypto space, and it may show unexpected growth in the future. Our analysis has led us to believe that the internet of things will become a new trend and IOTX will enter into a new range of bull trends. IoT is necessary for the functionality of AI.
Based on our analysis, we expect IOTX to reach a value of $0.41 USD in the coming time, it's a coin that can go step by step until it breakout. However, it's important to always do your own research and trade safely. Keep in mind that, if there is real hype on the coin, the price action could go much higher, but we will have to wait and confirm this over time. This is not a coin that is recommended for trading, but it's worth keeping an eye on it.

GBPUSD ShortTime Frame: 4H
Symbol: GBPUSD
Entry: 1.23216
TP: 1.22209
SL: 1.23875
Bias: Short
GBP/USD is the forex ticker that shows the worth of the English Pound against the US Dollar. It lets brokers know the number of US Dollars that are expected to purchase an English Pound. The Pound-Dollar is one of the most established and most generally exchanged cash matches on the planet. Follow the live GBP/USD rate with the outline and stay up with the latest with Pound-Dollar news and examination. Plan your exchanges with the GBP/USD conjecture and key turn focuses information and backing and obstruction levels.

IOTX the Surprising Increase : Target Analysis in 2023 $0,41This update focuses on the expected targets for IOTX in 2023. We anticipate that there will be an increase in IOTX's value in the coming time, as seen in a recent trend analysis. With this update, we will be discussing the specific goals we expect IOTX to achieve based on our research and analysis. We believe that there will be a point in time when IOTX will experience significant growth.
See the blow chart for more TA views.
The top target that this update share is between $0,41 and $0,45 for 2023, and if there is a trend in autonomous vehicles for IOTX the price action can increase more.
2023 seems to be a digital year with tech trends. further, we expect also that OTX Could Enter the Top 40 RANK OF COINS 2023
This means that depending on this study that there is a good possibility IOTX could do 1300% increase in 2023
IOTX is like the AI, it was a time in sleeping modes, but it seems it's about to get up coming time.
MachineFi has the potential to revolutionize the future as the world becomes increasingly digital. We have already seen a shift towards digitalization in industries such as supermarkets and with the increasing number of IoT connections, more companies will follow suit. Self-driving cars are on the horizon and IoT will play a crucial role in making them a reality. AI also relies on IoT systems to function at their full potential. For this reason and other reasons, we expect that IOTX is the best coin for IoT in the cryptocurrency market.

GBPUSD ShortTime Frame: 4H
Symbol: GBPUSD
Entry: 1.23639
TP: 1.22747
SL: 1.24254
Bias: Short
The ongoing value example of the instrument is clearing a way for investigating bearish direction. As we see the bearish force is predominant, we can anticipate a short exchange.

BTC : CONFIRMATION of 20800 MEANS HIGH CHANCE FOR 24KBitcoin seems still in the run.
we did add before that $20800 is an important zone.
If BTC is able to confirm this price action, there is a good chance that BTC will increase to 24K coming time.

TFUEL: VIEW OF INCREASETFEUL showing on low time frame volume.
we will see if this volume is able to get confirmed.

GBPUSD ShortTime Frame: 4H
Symbol: GBPUSD
Entry: 1.23505
TP: 1.22859
SL: 1.24005
Bias: Short
GBP/USD is the forex ticker that shows the worth of the English Pound against the US Dollar. It lets dealers know the number of US Dollars that are expected to purchase an English Pound. The Pound-Dollar is one of the most established and most broadly exchanged money matches on the planet. Follow the live GBP/USD rate with the graph and stay up with the latest with Pound-Dollar news and examination. Plan your exchanges with the GBP/USD gauge and key turn focuses information and backing and obstruction levels.

KNC : OVERVIEW UPTRENDKNC is one of the coins selected today for an uptrend. We will closely monitor the coin to see if it can generate further gains

GBPUSD LongTime Frame: 4H
Symbol: GBPUSD
Entry: 1.23404
TP: 1.23896
SL: 1.22883
Bias: Long
Current cost design is in a tight reach and the hope of the directional moves is fair. As we see the motions of cost from help to obstruction and protection from help is progressively drawn towards more tight ranges which might imply disinterest from the imminent financial backers interests.

CRV : INCREASE VIEWThe market seems still stable for day trading, CRV can show coming time an increased view for day trading since it's an important target for confirmation of an uptrend.
we will follow this coin to see if it's able to show some increased view.
At this moment the coin is still stable and going depending on normal market trends,the study shows that the coin are able to increase coming time.
We check always the last possibility and chances on the markets.
CRV seems on this time frame interesting for the watchlist.
The coin has a good possibility to increase over the $1

EGLD: SHOWS INCREASE VIEWEGLD: SHOWS INCREASE VIEW, on this reason we follow this coin for day trading.

GBPUSD LongTime Frame: 4H
Symbol: GBPUSD
Entry: 1.23578
TP: 1.24716
SL: 1.22681
Bias: Long
GBP/USD is the forex ticker that shows the worth of the English Pound against the US Dollar. It lets brokers know the number of US Dollars that are expected to purchase an English Pound. The Pound-Dollar is one of the most established and most generally exchanged cash matches on the planet. Follow the live GBP/USD rate with the outline and stay up with the latest with Pound-Dollar news and investigation. Plan your exchanges with the GBP/USD conjecture and key turn focuses information and backing and opposition levels.

ZRX : THE SCAN COINfor the day trading coin, ZRX has a good chance to get into the trend coming time.
We will follow this coin to see if it can target one of the levels we did add in the chart.
ZRX shows a structure increase in the overview study.
This scan is made for the moment and can change with time. it's important first to see if ZRX is able to increase as the short data shows.

RLC : SHOWING + VOLUMERLC showing since the last 15 min + volume, which means we should check it coming time, on this reason follow the coin trends to see if it's able to confirm into a breakout.
same time interesting to see If this coin are going to breakout $2 USD level

GBPUSD ShortTime Frame: 4H
Symbol: GBPUSD
Entry: 1.22144
TP: 1.21211
SL: 1.22788
Bias: Short
GBP/USD is the forex ticker that shows the worth of the English Pound against the US Dollar. It lets merchants know the number of US Dollars that are expected to purchase an English Pound. The Pound-Dollar is one of the most seasoned and most generally exchanged money matches on the planet. Follow the live GBP/USD rate with the graph and stay up with the latest with Pound-Dollar news and examination. Plan your exchanges with the GBP/USD gauge and key turn focuses information and backing and obstruction levels.
