BTCUSDTHello Traders! 👋
What are your thoughts on BITCOIN?
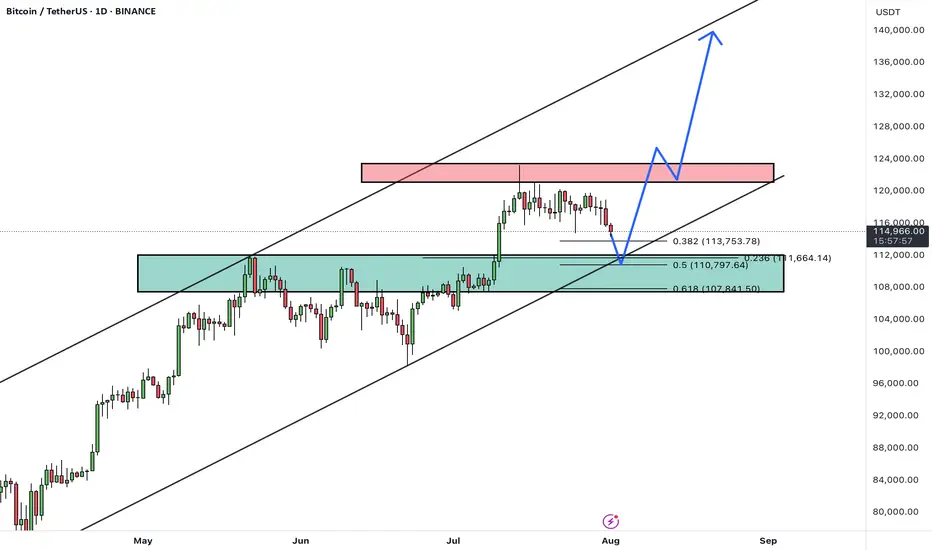
After a strong rally, BTC is currently pulling back from the 124K resistance area, heading toward a major confluence support zone between 108,000– 110,000, which aligns with:
✅ Previous breakout zone
✅ 0.5–0.618 Fibonacci retracement
✅ Lower bound of the ascending channel
This level is expected to attract buyers and act as a base for a new bullish leg.
Scenario Ahead (Main Bias):
1. Price dips into the 108–110K support
2. Bullish reversal from the zone (watch for strong reaction candles or bullish divergence)
3. Target 1: 124K (retest resistance)
4. Target 2: 135K–140K (upper channel boundary upon breakout)
BTC remains in a healthy bullish structure. Current pullback is considered constructive, and the 107–110K zone offers a high-probability long setup. Watch for bullish signals before entering.
A confirmed daily close below 107K would invalidate this bullish structure and expose BTC to deeper correction levels.
What’s your take on this setup? Do you expect a bounce from support or a deeper correction? Share your thoughts below 👇
Don’t forget to like and share your thoughts in the comments! ❤️
Harmonic Patterns
AUDUSD: Bearish Continuation from broken supportThe current setup is a clean example of a trend continuation play. Price recently broke decisively below a structure zone, this break and retest now flips the narrative, what once was a buy zone is now an opportunity for short entries.
Following the aggressive move down, price now began pulling back into that broken zone. The move appears corrective rather than impulsive, characterized by a slower, more rounded structure typical of pullback leg. This is classic behavior in continuation setups: fast drop, slow retrace, and then potential for the next leg lower.
The projected move targets a retest of the swing low at 0.63800. That level is significant, it's a level where prior demand reacted strongly and now it serves as the next probable magnet for price.
What makes this continuation trade high probability is the sharpness of the prior bearish impulse as it signals intent. The market seems to be in a controlled bearish sequence, where sellers dominate momentum and retracements offer fresh entries for trend followers.
The structure and zone alignment all point in the same direction continuation lower, not reversal.
Let me know in the comments what you think
Disclosure: I am part of Trade Nation's Influencer program and receive a monthly fee for using their TradingView charts in my analysis.

BTC DOMINANCE UPDATE- So, all elements are annotated throughout the graphic, like always.
- Timeline.
- Older Top Dom (2021) (red doted line).
- New Top Dom (2025) (red line).
- Some supports ( Orange Line ).
- Some Bottoms ( Green Lines ).
- Most important in chart : Fibonnacci Retracements.
- After this chart, I’ll drop links to my older BTC dominance posts.
- Not much to say, just look at the chart :
- In 2021, BTC.D formed a double top because Bitcoin spiked twice and hit two all-time highs.
- That doesn’t mean BTC.D will behave the same way in 2025. I don't expect another double top, but who knows.
- We could see a retracement down to the 45–47% range. That would likely signal the start of a new bear market.
- For now, i don’t see the end of the bull run yet. I’m mostly waiting for a strong BTC push in price, a fast dip in BTC Dominance, and the kickoff of Altseason.
— it’s going to be wild and fast! Just my personal opinion.
Stay Safe !
Happy Tr4Ding !

USDCHFHello Traders! 👋
What are your thoughts on USDCHF?
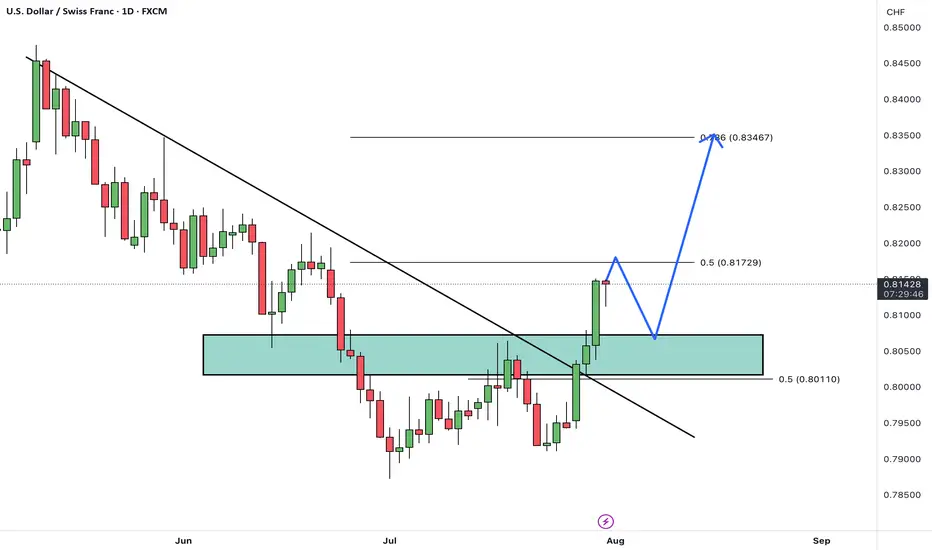
USD/CHF has broken above its descending trendline and cleared a resistance zone, signaling a potential trend reversal and growing bullish momentum.
After some minor consolidation and a pullback to the breakout zone, we expect the pair to continue its rally toward the next identified targets.
The broken resistance now acts as new support, and as long as price remains above this area, the bullish outlook remains valid.
Is USD/CHF ready to extend higher toward its next targets? Share your view below! 🤔👇
Don’t forget to like and share your thoughts in the comments! ❤️
Today’s Opportunity: Stay Sharp on GBPJPY!Hey friends,
Here's my latest analysis on GBPJPY.
📌 Buy Entry Zone: 197.590 - 197.336
🎯 Target Level: 198.642
📅 Today, major economic data will be released from the U.S.
Make sure to factor this into your fundamental analysis.
📊 It’s not just about the charts—fundamentals matter too.
Technical + Fundamental = Powerful outcomes ✅
💬 Every like and bit of support keeps me going.
Thanks so much to everyone backing this journey! 🙌

Ethereum Bull TrapThe Ethereum bull trap: Is it a breakout or fakeout? Iinstitutional and retail trends show something strange is cooking
www.cointrust.com

Ethereum - The moment of truth!🔬Ethereum ( CRYPTO:ETHUSD ) trades at a key breakout level:
🔎Analysis summary:
Ethereum - after consolidating for the past four years - is once again retesting the previous all time high. And before we will witness another bearish rejection, Ethereum has the chance to finally break out of the long term triangle pattern. It's time for us to start praying.
📝Levels to watch:
$4.000
SwingTraderPhil
SwingTrading.Simplified. | Investing.Simplified. | #LONGTERMVISION

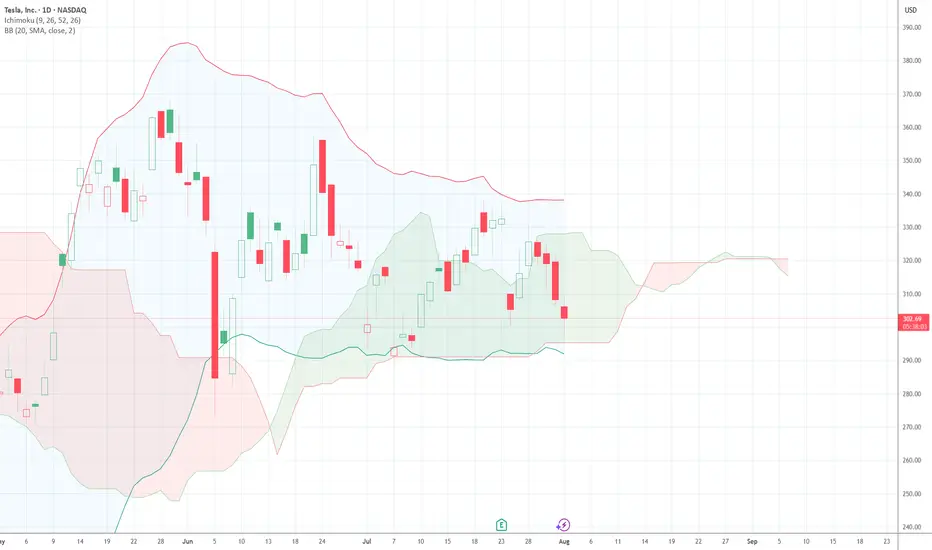
$TSLA 3rd Time's a CharmI bottom called NASDAQ:TSLA twice in a row. About to do it a third time today. 312.5C 8/8 @ 4.47 were just bought for $1.3 million.
BTC SHORT SETUP INTRADAY ( 02 AUG 2025 )If you have doubt on our trades you can test in demo.
Details:
Entry: 113,680 $ - 113,450 $
Target Price: 112,300 $
Stop loss: 114,370 $
Trade Ideas:
Idea is clearly shown on chart + we have some secret psychologies and tools behind this.
What is required to Join VIP?
- Nothing just you have to share 10% of your profit with us at the end of the month which you earned from our signals. Yeah this is just the requirement, trade where ever you like your favorite broker or else you don't need to pay fees first or create account thru our link.
Trade Signal:
I provide trade signals here so follow my account and you can check my previous analysis regarding BITCOIN. So don't miss trade opportunity so follow must.
BINANCE:BTCUSDT BINANCE:BTCUSDT.P BINANCE:BTCUSD

Be prepared to be liquidated.Be prepared to be liquidated.
Be prepared to be liquidated.
Ada =0.18
Shiba =0.000005
،Doge =0.05
Ethereum =900
Dot=1.30
Dydx=0.39
Fil=1.20
Sand=0.15
Mana=0.13
...........

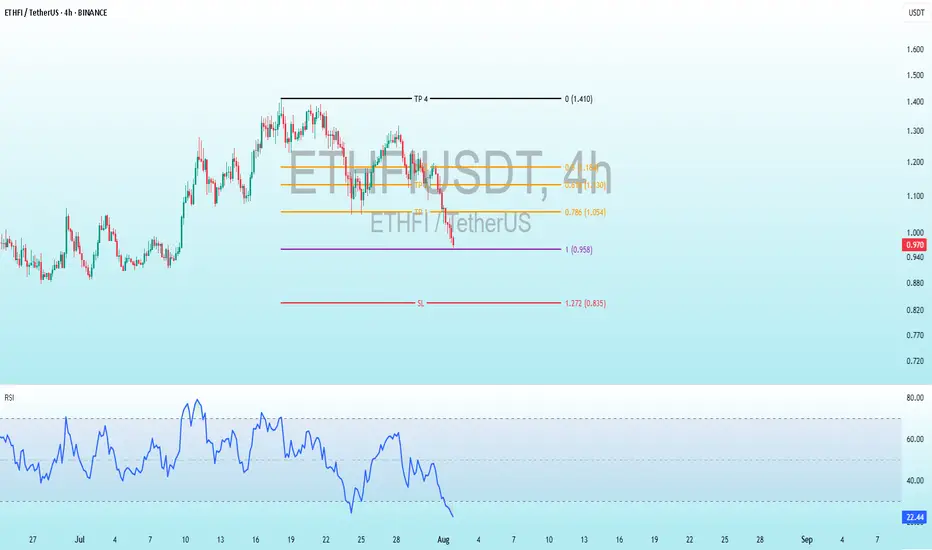
ETHFI Bullish DivergenceBINANCE:ETHFIUSDT
Trade Setup:
Target 1: 1.054 (0.786 Fibonnaci Golden Zone).
Target 2: 1.130 (0.618 Fibonnaci Golden Zone).
Target 3: 1.184 (0.786 Fibonnaci Golden Zone).
Target 4: 1.410 (0 Fibonnaci).
Stop Loss: 0.835 (1.272 Fibonnaci).
RSI Analysis: The RSI is showing a bullish divergence, suggesting potential bullish momentum. The current RSI is around 22.36, approaching oversold territory, so caution is advised.
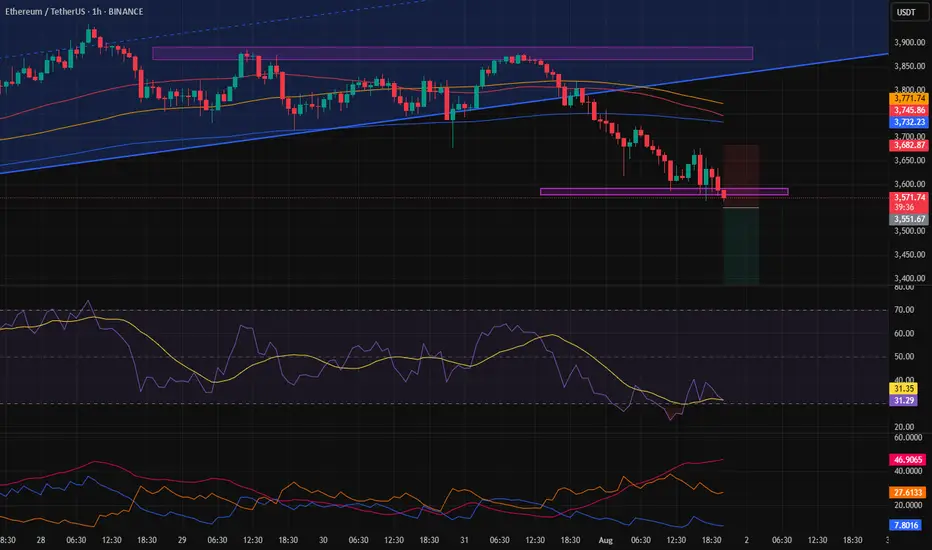
Possibility of Ethereum moving toward the \$3,330 price range.Considering the breakout of the 4-hour channel and confirmation of the downtrend, reaching the \$3,330 level is not out of the question.
This target was derived using a pattern-based projection from the channel breakout.
I’ve personally taken this position, but I’m not recommending it — just sharing for informational purposes.
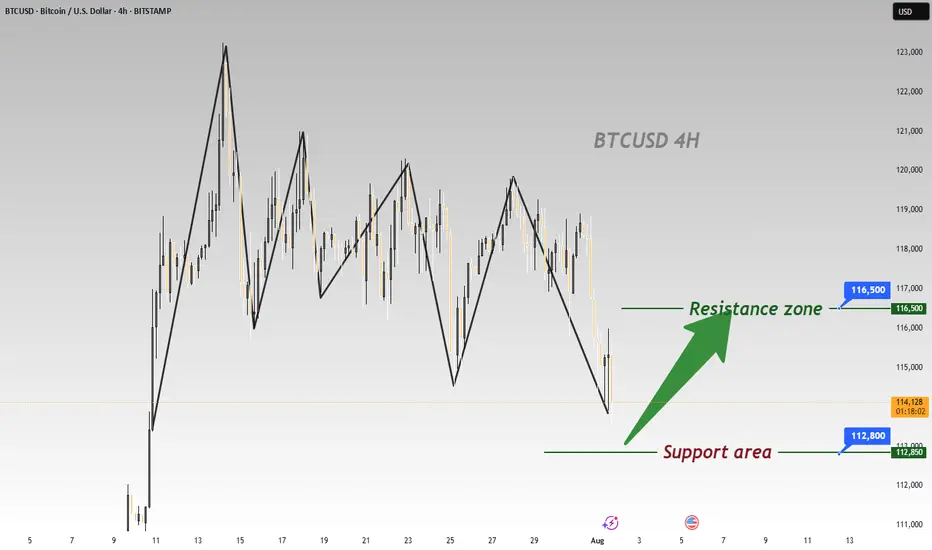
BTC Plummets Post-NFP; Go Long for Rebound to 116500BTC has plummeted significantly under the influence of the non-farm payroll data 📉, and now is an excellent opportunity to go long. Its Support level is around 112800, and according to the current trend, we can wait for a rebound to around 116500.
⚡️⚡️⚡️ BTCUSD ⚡️⚡️⚡️
🚀 Buy@ 113000 - 113800
🚀 TP 114500 - 115500 - 116500
Daily updates bring you precise trading signals 📊 When you hit a snag in trading, these signals stand as your trustworthy compass 🧭 Don’t hesitate to take a look—sincerely hoping they’ll be a huge help to you 🌟 👇
XAUUSD ANNASIS OUTLOOK BULLISH 1/8/2025 XAUUSD – Trade in Progress
Long from $3,295 – targetting $3,355 / $3,365
+600+ pips potential on extended breakout
Bulls gaining strength above $3,300
Holding with confidence – structure supports it
#XAUUSD #GoldTrade #LiveSetup #TargetPending

We might be changing the trend in the coming months!I found this indicator extremely accurate for the past tops. We are focusing on the histogram today and looking once that green candles starts growing momentum taking BTC down the hill. If this idea proves right we might be bottoming around 400 days perhaps August 2026 ~45k

DXY Just Broke Through the Lock… Where’s the Market Headed Now?🌅 Good Morning, Friends!
A few days ago, I marked 98.950 as a key threshold for the DXY index. As of today, that level has officially been broken—and the bullish momentum we anticipated is now kicking in. 📈
The next target? 101.000.
That said, it’s crucial to remember: DXY is heavily influenced by fundamental data. Stay alert and keep a close eye on key economic developments—they’re essential for navigating this move.
This breakout validates the analysis I shared with you all. And it wasn’t just about charts—it was about discipline, precision, and timing.
Every single like from you is a huge boost to my motivation. Thanks from the heart—your support drives me to keep sharing these insights! 💙

AUDCAD / GBPAUD Trade Recaps 01.08.25A tester trade on AUDCAD with the reasons explained as to why this was a test position, and a short position executed on GBPAUD. Solid setup that this time around just didn't commit.
Full explanation as to why I executed on these positions and the management plan with both.
Any questions you have just drop them below 👇

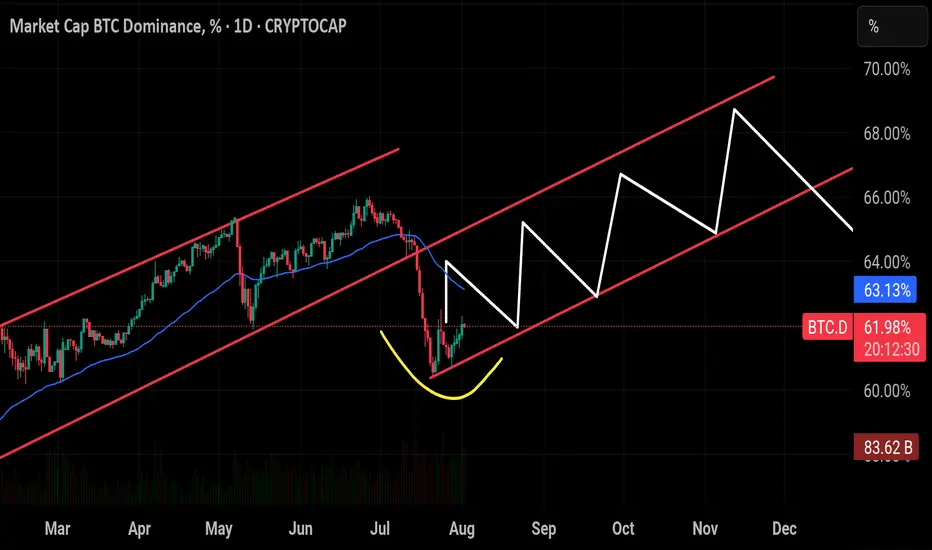
$BTC Dominance seems to be replaying its historical pattern —CRYPTOCAP:BTC Dominance seems to be replaying its historical pattern — after peaking around 66%, it’s now pulling back toward the critical 60% support zone. If the breaks below this level have triggered sharp drops toward 54%, often marking the start of strong altcoin seasons. Unless BTC.D closes back above 65%–66%, history suggests we could see another wave of altcoin outperformance in the weeks ahead. And looking at the chart structure, a breakout in BTC’s price action could align with this cycle, potentially driving Bitcoin toward a new all-time high soon.
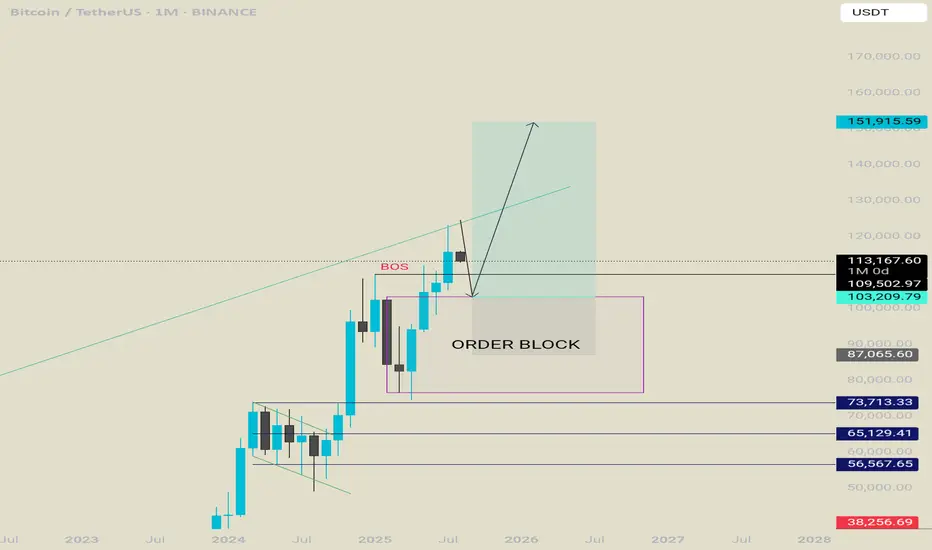
Bitcoin projection for the rest of the year. Bullish.We are in a retracement phase , i think btc will retrace deep enough to convince people that bull run is over . Once that happens it will flip to the upside and leave everyone shocked.
A retrace towards 108k-104k is possible.
Once they get tapped btc will start a new run towards a new all time high where everything will get to an end and a new besr market will start. Until then lets enjoy the rest of the year.
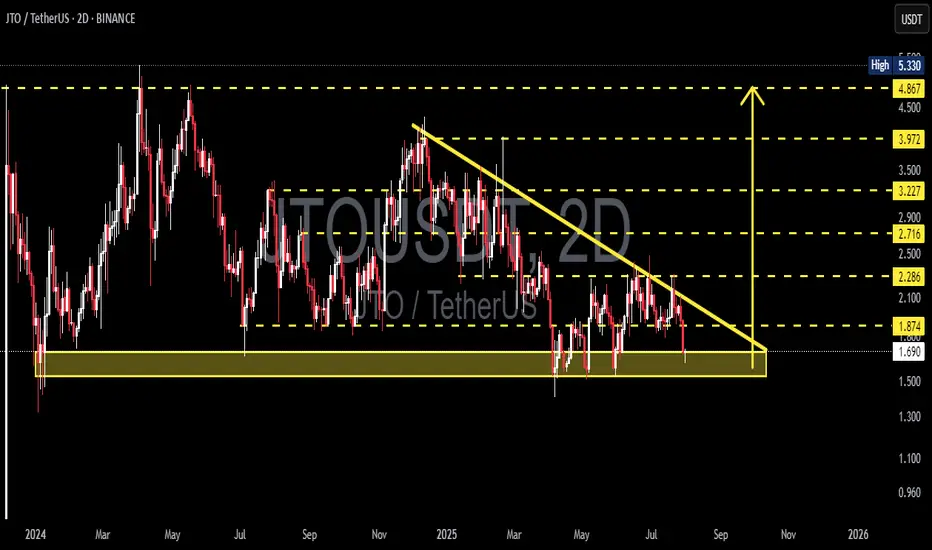
JTO/USDT at the Edge of Pressure – Breakout or Breakdown Ahead?🧠 Detailed Technical Analysis (2D Timeframe):
JTO/USDT is currently consolidating at a critical support zone within a well-defined Descending Triangle pattern that has been forming for over 6 months.
Key observations:
Price has been making lower highs, forming a downward-sloping resistance trendline.
Meanwhile, strong buying interest has held up the support zone between $1.69 and $1.87, suggesting accumulation.
This creates a classic Descending Triangle, often leading to a sharp breakout or breakdown.
---
📌 Key Levels:
Level Description
$1.69–$1.87 Major Demand Zone / Key Support
Descending Trendline Dynamic Resistance (from Lower Highs)
$2.29 First Resistance (Breakout Trigger)
$2.71 Key Mid-Term Resistance
$3.22 – $3.97 Major Upside Targets
$1.50 & $1.30 Breakdown Targets
---
📈 Bullish Scenario (Breakout):
If the price holds the support and successfully breaks the descending trendline, we could see a strong bullish reversal:
Confirmation breakout may lead to a rally toward $2.29 → $2.71 → $3.22 → up to $3.97.
Breakout strength increases if accompanied by volume surge.
Bullish Catalysts:
Positive project fundamentals.
Volume squeeze near triangle apex.
RSI/MACD divergence (if present).
---
📉 Bearish Scenario (Breakdown):
If price closes below the $1.69 zone with conviction:
Descending triangle confirms as a bearish continuation.
Target downside to $1.50 and potentially $1.30.
Could signal distribution phase by larger players.
Bearish Confirmation: Strong 2D candle close below $1.69 with high volume.
---
🧩 Pattern Breakdown – Descending Triangle:
The pattern represents price compression between lower highs and a horizontal support.
Statistically, 70% of descending triangles resolve to the downside.
However, in oversold conditions or with bullish catalysts, it may lead to a powerful short squeeze breakout.
---
🧭 Summary & Strategy Insight:
JTO/USDT is nearing a decision point. At the edge of the triangle’s apex, volatility is likely to spike — with a strong move in either direction.
💡Possible Strategy:
Conservative entry: Wait for breakout confirmation above the trendline with volume.
Aggressive entry: Speculative buy near $1.70 with tight stop loss.
Avoid heavy positions until the breakout or breakdown confirms.
---
🧲 Suggested Post Title:
> "JTO/USDT at a Crossroads – Descending Triangle Set for Explosive Move?"
A breakout is imminent. Will you be ready?
#JTOUSDT #CryptoBreakout #DescendingTriangle #AltcoinSetup #TechnicalAnalysis #CryptoStrategy #ChartPatterns
Potential Sell Opportunity on EURGBPReasons I think this pair will fall.
- RSI was overbought on 4H
- Bearish RSI Divergence on 4H
- Lower high potentially being printed on 4H
Looking to sell on the retest once price breaks though previously printed low.
What do you think?

BTC Double BottomFibonacci sequence is a mathematical concept; it appears in various aspects of everyday life and nature. It's not directly used in a calculated way, but its principles are reflected in the patterns we see around us. Its key for traders to pinpoint these reversal areas to keep a positive risk/reward ratio. Bulls will target 116k if this low can be sustained.

OEX /SPX Bullish wave 5 pattern crossroads The chart posted is the sp 100 I am posting it as we are now at the crossroad for bull or bear count .We have rallied to .786 as I will show and have a wave a x 1.27 = c at the .786 High But if we break above 5922 in the Cash SP 500 There is NOTHING to stop it from reaching a target of 3005 in the OEX where wave A up or wave 1 x 1.618 = wave C Top or wave 3 in the SP 500 WAVE A or WAVE 1 up 5481 - 4835 = 646 x 1.618 =1045 plus wave B low or wave 2 5102low= 5102plus 1045 =6147.22 The exact high . This is the reason I took the loss and moved LONG .Best of trades WAVETIMER
