EURUSD : The trend is still downAfter what Trump said last night, the trend is still down.
I will keep selling.
If we look carefully, 'they' did tell us beforehand that we should keep selling. Just know where to look.
Good luck, and let's make lots of money.
Harmonic Patterns

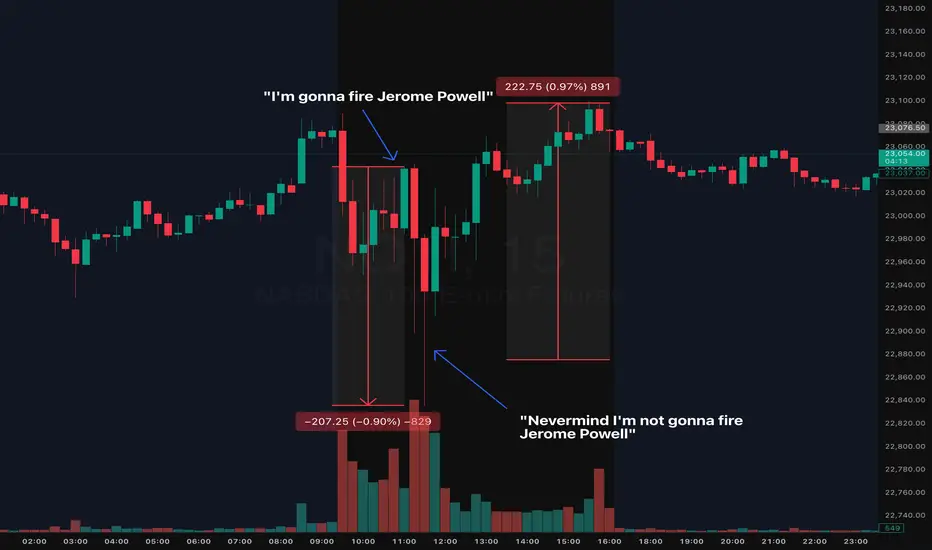
2025 Trading Final Boss: Daily Market Manipulation, The New NormMarking this point in history because we'll likely forget and move on.
During the early hours of the July 16th NYC session, we saw indices quickly flush ( CME_MINI:NQ1! CME_MINI:ES1! ) nearly 1% on the news that Trump will fire Jerome Powell. The dip was bought almost instantly.
Shortly after the dip was bought (roughly 0.50% recovery), guess what? Trump announced, he is "not considering firing Jerome Powell". The dip then recovered and achieved a complete V to finish the day somewhat green. Make what you want of it but always use a stop loss in these tough conditions.
Welcome to 2025 Trading Final Boss
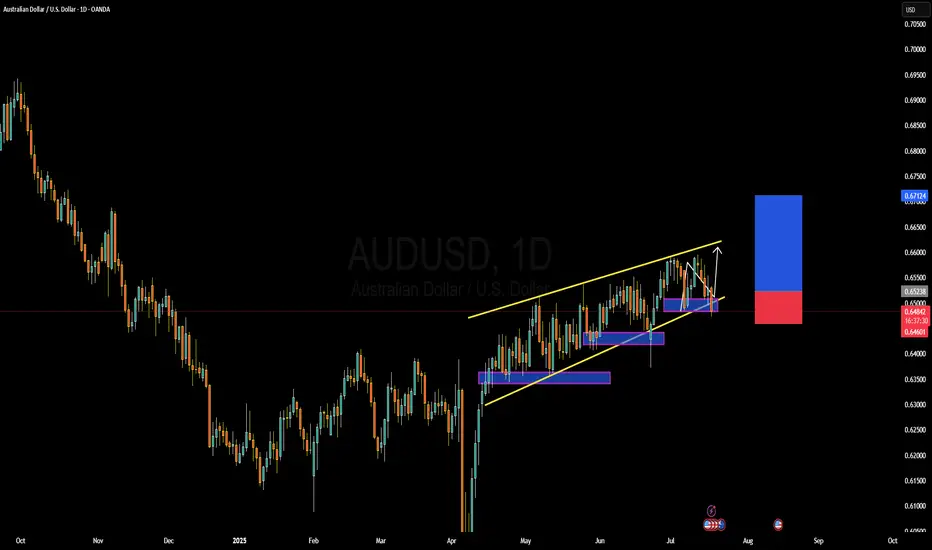
AUDUSD Forming Bullish MomentumAUDUSD is showing strong bullish momentum, and the current price structure confirms that the pair is gearing up for another potential rally. After building solid bullish pressure from key support zones, price has been making higher lows with clear buying interest stepping in on dips. I entered this setup earlier and am already in deep profit. With the momentum continuing to hold, I’m anticipating another wave to the upside in the coming sessions.
From a fundamental standpoint, the Australian dollar is currently benefiting from broad US dollar softness driven by expectations of a Fed rate cut later this year. As inflation cools in the US and the labor market shows signs of moderation, the Fed’s hawkish stance has softened, weakening the dollar across the board. At the same time, the Reserve Bank of Australia (RBA) has maintained a relatively firm tone, leaving the door open for further tightening if inflation pressures persist domestically. This divergence in central bank tone is favoring AUD strength.
Additionally, commodities like iron ore and copper—major Australian exports—have recently found renewed demand, particularly from China. With Chinese authorities signaling more fiscal and monetary stimulus to support their post-COVID recovery, the Australian economy stands to benefit, further supporting AUD upside. This commodity-backed strength adds another layer of support to the bullish AUDUSD narrative.
Technically, the pair has broken above a key resistance level and is now forming a bullish continuation pattern on the lower timeframes. Price action is supported by rising volume and moving averages starting to slope upward. The structure is clean, the fundamentals are supportive, and sentiment across TradingView shows increasing bullish interest in AUDUSD. I'm holding for higher levels as the bullish wave continues to develop.
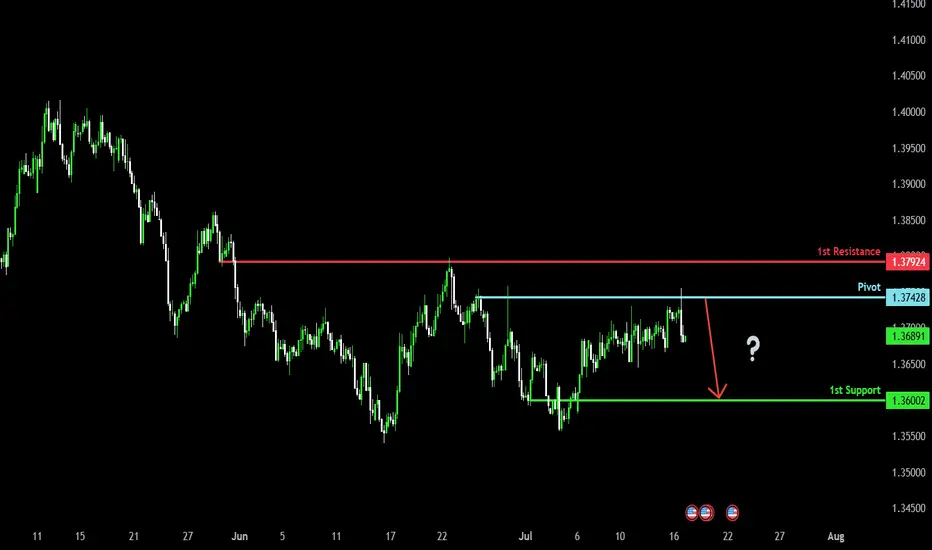
Bearish drop?The Loonie (USD/CAD) has rejected off the pivot which acts as a pullback resistance, and could drop to the 1st support.
Pivot: 1.3742
1st Support: 1.3600
1st Resistance: 1.3792
Risk Warning:
Trading Forex and CFDs carries a high level of risk to your capital and you should only trade with money you can afford to lose. Trading Forex and CFDs may not be suitable for all investors, so please ensure that you fully understand the risks involved and seek independent advice if necessary.
Disclaimer:
The above opinions given constitute general market commentary, and do not constitute the opinion or advice of IC Markets or any form of personal or investment advice.
Any opinions, news, research, analyses, prices, other information, or links to third-party sites contained on this website are provided on an "as-is" basis, are intended only to be informative, is not an advice nor a recommendation, nor research, or a record of our trading prices, or an offer of, or solicitation for a transaction in any financial instrument and thus should not be treated as such. The information provided does not involve any specific investment objectives, financial situation and needs of any specific person who may receive it. Please be aware, that past performance is not a reliable indicator of future performance and/or results. Past Performance or Forward-looking scenarios based upon the reasonable beliefs of the third-party provider are not a guarantee of future performance. Actual results may differ materially from those anticipated in forward-looking or past performance statements. IC Markets makes no representation or warranty and assumes no liability as to the accuracy or completeness of the information provided, nor any loss arising from any investment based on a recommendation, forecast or any information supplied by any third-party.
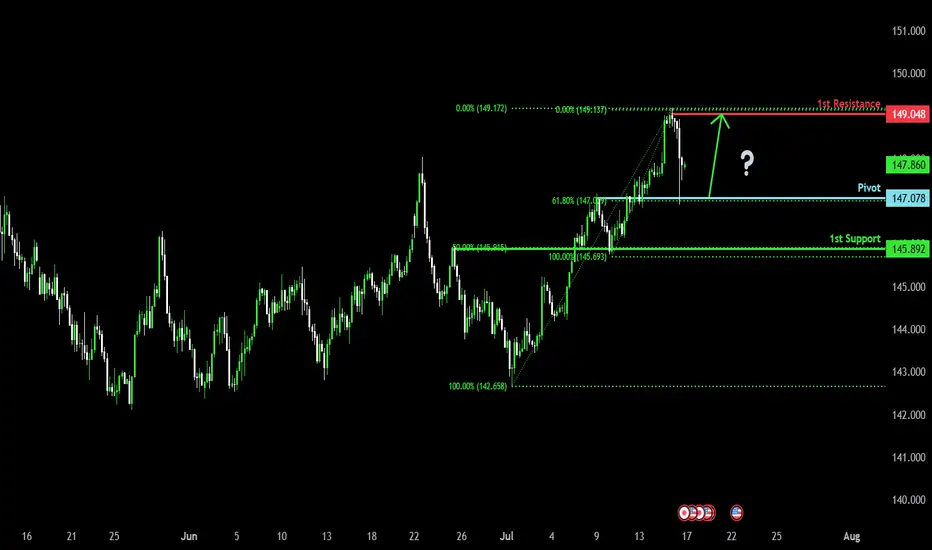
Bullish bounce off pullback support?USD/JPY is falling towards the pivot which aligns with the 61.8% Fibonacci retracement and could bounce to the 1st resistance.
Pivot: 147.07
1st Support: 145.89
1st Resistance: 149.04
Risk Warning:
Trading Forex and CFDs carries a high level of risk to your capital and you should only trade with money you can afford to lose. Trading Forex and CFDs may not be suitable for all investors, so please ensure that you fully understand the risks involved and seek independent advice if necessary.
Disclaimer:
The above opinions given constitute general market commentary, and do not constitute the opinion or advice of IC Markets or any form of personal or investment advice.
Any opinions, news, research, analyses, prices, other information, or links to third-party sites contained on this website are provided on an "as-is" basis, are intended only to be informative, is not an advice nor a recommendation, nor research, or a record of our trading prices, or an offer of, or solicitation for a transaction in any financial instrument and thus should not be treated as such. The information provided does not involve any specific investment objectives, financial situation and needs of any specific person who may receive it. Please be aware, that past performance is not a reliable indicator of future performance and/or results. Past Performance or Forward-looking scenarios based upon the reasonable beliefs of the third-party provider are not a guarantee of future performance. Actual results may differ materially from those anticipated in forward-looking or past performance statements. IC Markets makes no representation or warranty and assumes no liability as to the accuracy or completeness of the information provided, nor any loss arising from any investment based on a recommendation, forecast or any information supplied by any third-party.
EURUSD – Weakness emerges at descending channel resistanceEURUSD remains within a well-defined descending channel and was recently rejected at the upper trendline – a key dynamic resistance zone. Price action shows the recovery is limited around 1.16600, with multiple FVG (Fair Value Gap) zones reinforcing the potential for further downside.
On the news front, the euro remains under pressure as Eurozone inflation data brought no surprises, while the US dollar is supported by June’s PPI rising exactly as expected at 0.2%. This combination leaves EURUSD with little momentum to break higher, making a move back toward the 1.15300 support area a scenario to watch.
If the price fails to break above 1.16600 and forms a lower high, the bearish trend will be further confirmed. Keep an eye on price behavior around the FVG zones to identify optimal entry points.

Bearish drop?The Loonie (USD/CAD) has rejected off the pivot which acts as a pullback resistance, and could drop to the 1st support.
Pivot: 1.3742
1st Support: 1.3600
1st Resistance: 1.3792
Risk Warning:
Trading Forex and CFDs carries a high level of risk to your capital and you should only trade with money you can afford to lose. Trading Forex and CFDs may not be suitable for all investors, so please ensure that you fully understand the risks involved and seek independent advice if necessary.
Disclaimer:
The above opinions given constitute general market commentary, and do not constitute the opinion or advice of IC Markets or any form of personal or investment advice.
Any opinions, news, research, analyses, prices, other information, or links to third-party sites contained on this website are provided on an "as-is" basis, are intended only to be informative, is not an advice nor a recommendation, nor research, or a record of our trading prices, or an offer of, or solicitation for a transaction in any financial instrument and thus should not be treated as such. The information provided does not involve any specific investment objectives, financial situation and needs of any specific person who may receive it. Please be aware, that past performance is not a reliable indicator of future performance and/or results. Past Performance or Forward-looking scenarios based upon the reasonable beliefs of the third-party provider are not a guarantee of future performance. Actual results may differ materially from those anticipated in forward-looking or past performance statements. IC Markets makes no representation or warranty and assumes no liability as to the accuracy or completeness of the information provided, nor any loss arising from any investment based on a recommendation, forecast or any information supplied by any third-party.

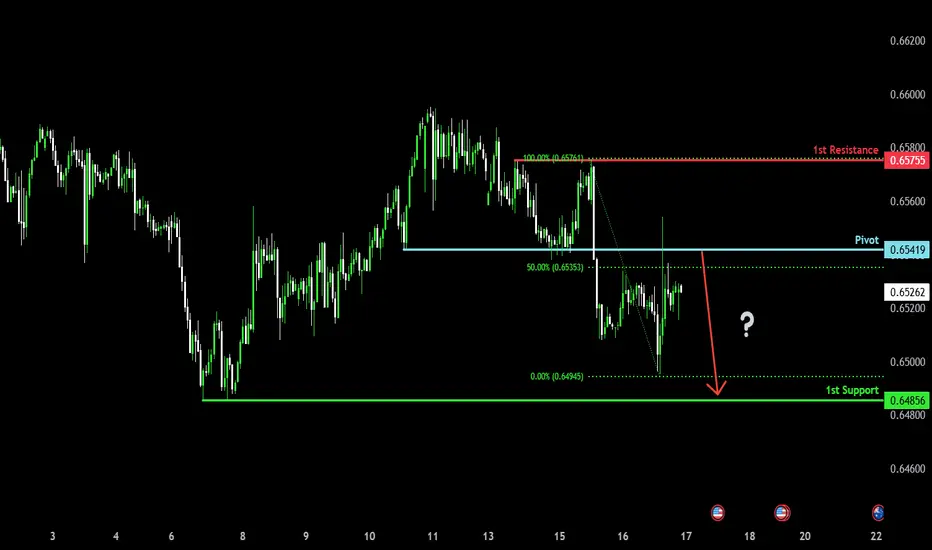
Bearish reversal?The Aussie (AUD/USD) is rising towards the pivot and could reverse to the 1st support.
Pivot: 0.6541
1st Support: 0.6485
1st Resistance: 0.6575
Risk Warning:
Trading Forex and CFDs carries a high level of risk to your capital and you should only trade with money you can afford to lose. Trading Forex and CFDs may not be suitable for all investors, so please ensure that you fully understand the risks involved and seek independent advice if necessary.
Disclaimer:
The above opinions given constitute general market commentary, and do not constitute the opinion or advice of IC Markets or any form of personal or investment advice.
Any opinions, news, research, analyses, prices, other information, or links to third-party sites contained on this website are provided on an "as-is" basis, are intended only to be informative, is not an advice nor a recommendation, nor research, or a record of our trading prices, or an offer of, or solicitation for a transaction in any financial instrument and thus should not be treated as such. The information provided does not involve any specific investment objectives, financial situation and needs of any specific person who may receive it. Please be aware, that past performance is not a reliable indicator of future performance and/or results. Past Performance or Forward-looking scenarios based upon the reasonable beliefs of the third-party provider are not a guarantee of future performance. Actual results may differ materially from those anticipated in forward-looking or past performance statements. IC Markets makes no representation or warranty and assumes no liability as to the accuracy or completeness of the information provided, nor any loss arising from any investment based on a recommendation, forecast or any information supplied by any third-party.
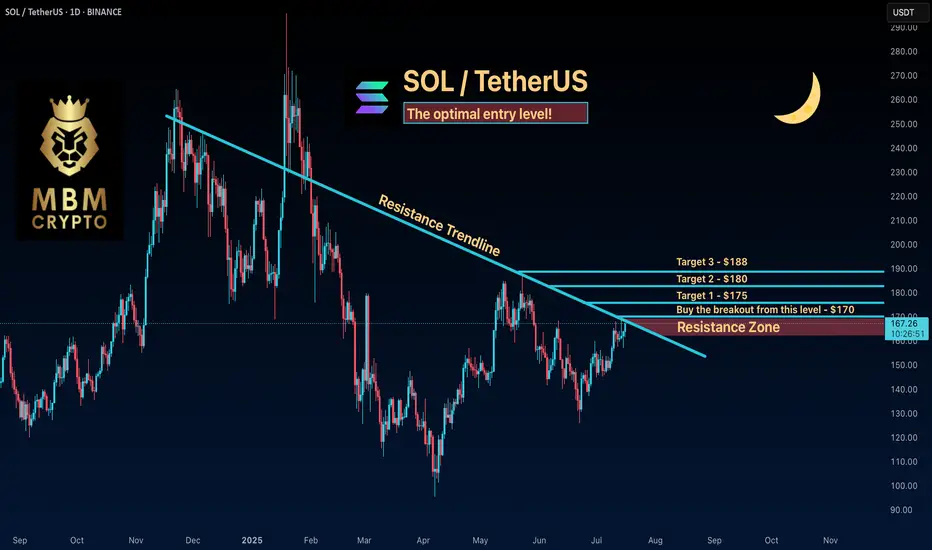
SOL: The optimal entry level! Keep an Eye on SOL
Now is the time to watch SOL. If the price breaks to the upside, we could see a significant move that might take it above $190!
Trading Setup
If you’re considering trading SOL, here’s a quick setup that may help you.
The idea is: Buy when the price breaks above $170 and take profits at the levels shown in the chart.
Targets:
1. $175
2. $180
3. $188
-------------------------------------------
About our trades:
Our success rate is notably high, with 10 out of 11 posted trade setups achieving at least their first target upon a breakout price breach (The most on TW!). Our TradingView page serves as a testament to this claim, and we invite you to verify it!
EUR/USD PULLS BACK TO BUY ZONE MORE UPSIDE AHEAD?Hey Traders so looking at Euro still looks bullish but again markets can change on a dime so always be cautious because we need to be good at defense just as much as offense in this game of trading.
Some say US Dollar may bottomed some say it's still going to weaken regardless of what do news says what can the charts show us?
I see a support level of 1.1573 holding for now I see new highs made at 1.1833.
Also I see higher lows and higher highs this all signals an uptrend but again trend changes happen.
However I still see enough to stay bullish for now so if your bullish consider buying here with a stop below support 1.1424
But if bearish I would wait for break below support at 1.1424 before selling into a rally. That way market confirms it wants to change trend.
Good Luck & Always use Risk Management!
(Just in we are wrong in our analysis most experts recommend never to risk more than 2% of your account equity on any given trade.)
Hope This Helps Your Trading 😃
Clifford

FLOKI: The optimal entry price! Trading Setup
If you’re considering trading FLOKI, here’s a quick setup that may help you.
The idea is: Buy when the price breaks above $0.000105 and take profits at the levels shown in the chart.
Targets:
1. $0.000108
2. $0.000112
3. $0.000117
-------------------------------------------
About our trades:
Our success rate is notably high, with 10 out of 11 posted trade setups achieving at least their first target upon a breakout price breach (The most on TW!). Our TradingView page serves as a testament to this claim, and we invite you to verify it!

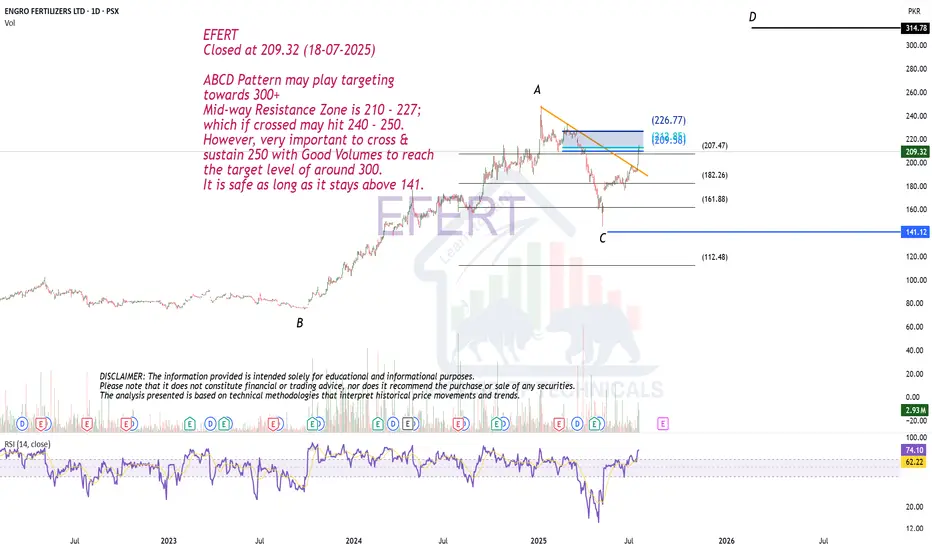
ABCD Pattern may play.EFERT
Closed at 209.32 (18-07-2025)
ABCD Pattern may play targeting
towards 300+
Mid-way Resistance Zone is 210 - 227;
which if crossed may hit 240 - 250.
However, very important to cross &
sustain 250 with Good Volumes to reach
the target level of around 300.
It is safe as long as it stays above 141.
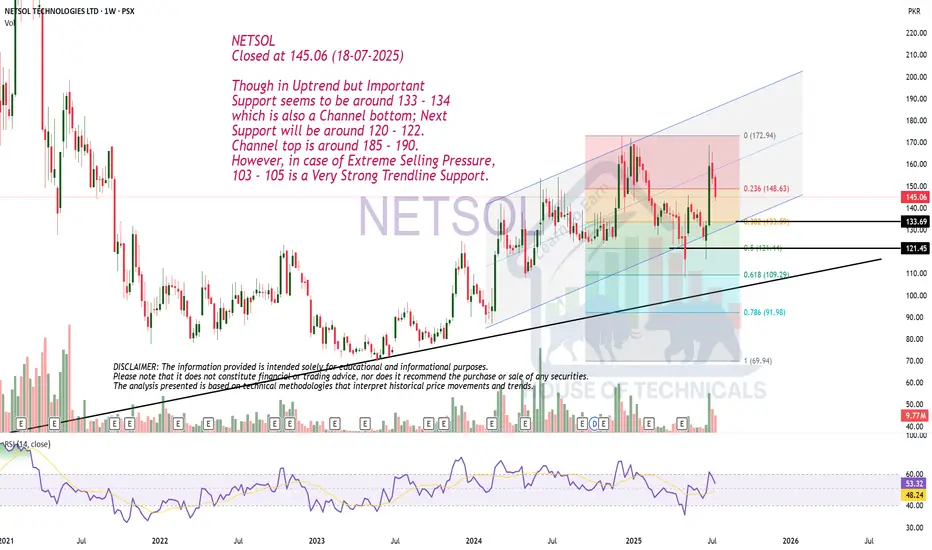
Though in Uptrend but..NETSOL
Closed at 145.06 (18-07-2025)
Though in Uptrend but Important
Support seems to be around 133 - 134
which is also a Channel bottom; Next
Support will be around 120 - 122.
Channel top is around 185 - 190.
However, in case of Extreme Selling Pressure,
103 - 105 is a Very Strong Trendline Support.
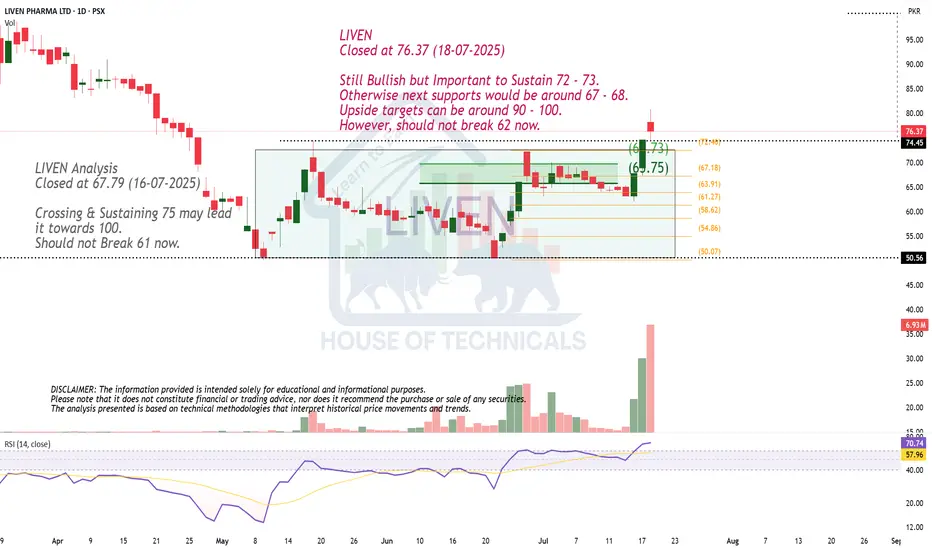
Still Bullish but ..LIVEN
Closed at 76.37 (18-07-2025)
Still Bullish but Important to Sustain 72 - 73.
Otherwise next supports would be around 67 - 68.
Upside targets can be around 90 - 100.
However, should not break 62 now.
Important Resistance !ISL
Closed at 97.96 (18-07-2025)
Important Resistance is around 98 - 104.
Once crossed with Good Volumes, we may
witness upside move towards 130 & then
around 150.
On the flip side, 94 - 96 & then around 80 - 83
are the Important Support Levels.

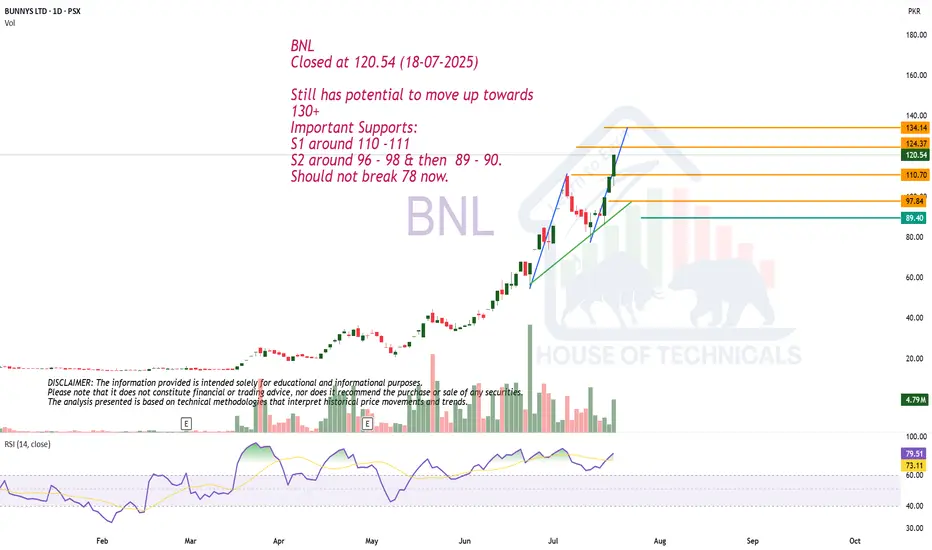
Play On LevelsBNL
Closed at 120.54 (18-07-2025)
Still has potential to move up towards
130+
Important Supports:
S1 around 110 -111
S2 around 96 - 98 & then 89 - 90.
Should not break 78 now.
XRP - RALLY!!! 2017 YEAR! LET'S RUN!🔍 Major observation:
Back in 2017, when Bitcoin reached its cycle top, XRP began a massive rally, which marked the beginning of the bear market.
📊 Currently, XRP's structure looks almost identical to 2017 — we've broken out of accumulation.
Is it time for the final rally?
📉 I'm betting that BTC won’t make a new all-time high, while XRP surges to $8+, kicking off the next bear market!

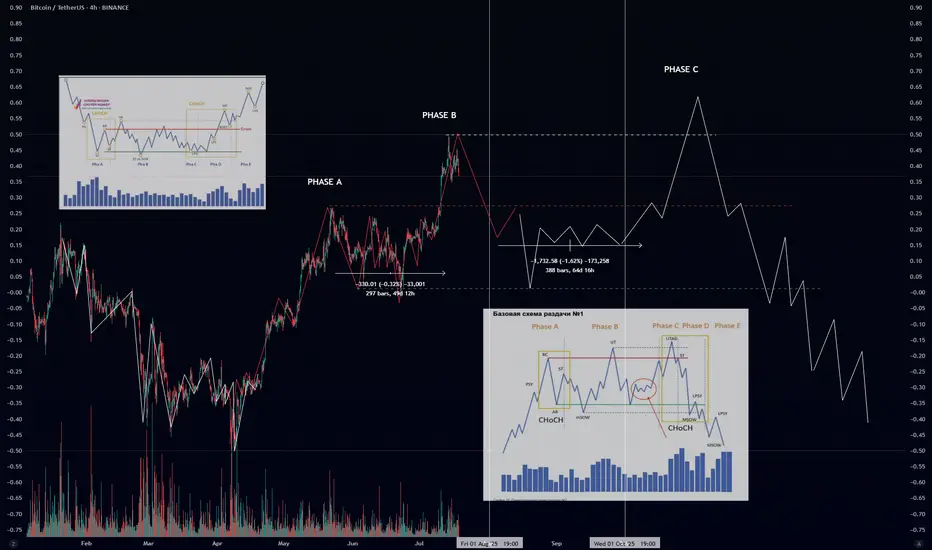
Wyckoff Distribution Schematic #1 – ExplainedIf you’ve ever wondered how smart money offloads their positions before a major downtrend — this is it. The Wyckoff Distribution Schematic #1 is the mirror opposite of accumulation. It reveals how institutions distribute (sell) to retail before the market collapses.
🔍 Phases Breakdown:
🟠 Phase A – Preliminary Supply & Buying Climax
PSY (Preliminary Supply): First signs of selling pressure.
BC (Buying Climax): Sudden surge in price with high volume – often traps late buyers.
AR (Automatic Reaction): Price drops as buyers lose momentum.
ST (Secondary Test): Retest of the top – often with lower volume.
🔄 CHoCH (Change of Character): Early warning sign that supply is increasing.
🟡 Phase B – Building the Cause
Sideways price action where large players distribute their holdings.
UT (Upthrust): Fake breakout above resistance.
mSOW (Minor Sign of Weakness): Slight breakdowns showing cracks in structure.
🔴 Phase C – The Trap
UTAD (Upthrust After Distribution): Final fakeout to trap bulls before the real drop.
Market often shows strength… right before the collapse.
Another CHoCH confirms the shift toward bearish control.
🔵 Phase D – Breakdown Begins
LPSY (Last Point of Supply): Final bounces with weak demand.
MSOW (Major Sign of Weakness): Strong breakdown on high volume — momentum shifts decisively.
⚫ Phase E – Downtrend
Distribution complete.
Price trends downward with weak rallies.
Retaiя is left holding the bag.
📊 Volume matters: look for volume spikes on upthrusts and breakdowns, and declining volume on bounces.
🔁 Compare with Accumulation:
Accumulation ends in Spring → Uptrend 📈
Distribution ends in UTAD → Downtrend 📉
Fantom/Sonic is kingFantom is giving off same signals as XLM in 2017. Ignore XLM and XRP of 2025 its all noise.

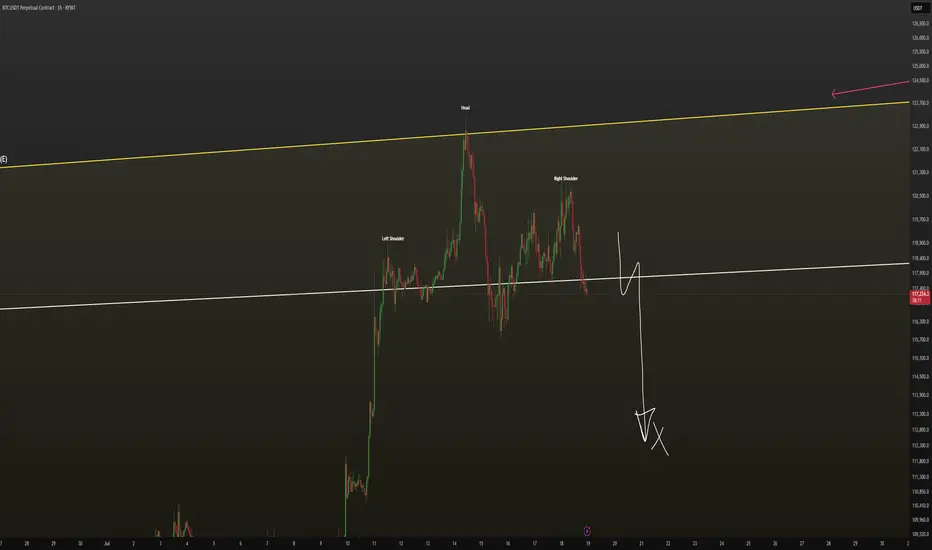
BTC - local situation (1h) SHORT🔻 Breaking down from a bearish pattern.
I expect a local decline to $114,000 - $112,000 on the 1h timeframe.
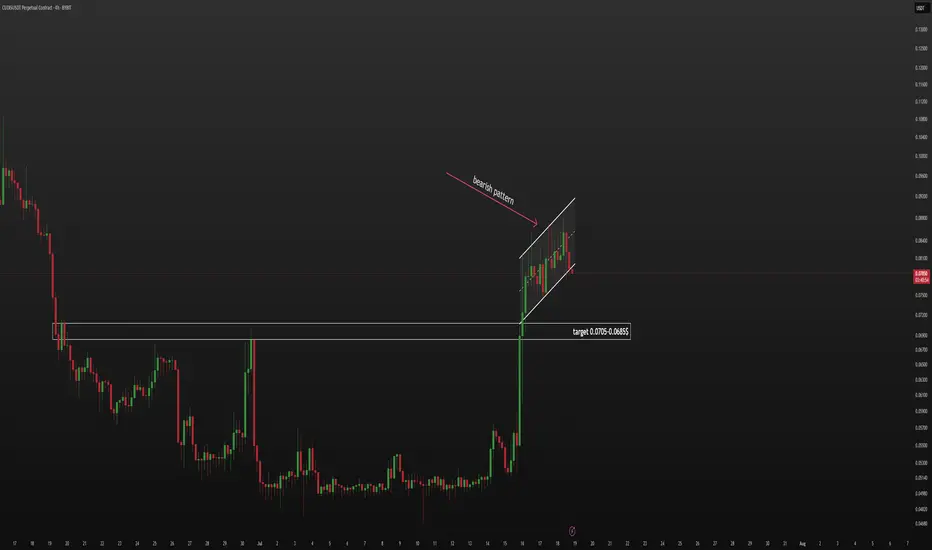
CUDIS - bearish pattern (short)🔻 Breaking down from a bearish pattern.
I’m opening a short position. Expecting a move down to the $0.0705–0.0685 range.
HYPE - bearish pattern (25-27$ soon...)🔻 Currently in a bearish pattern.
I'm expecting a drop to the $25–27 range. Opened a short position, with a stop above the all-time high (ATH).
