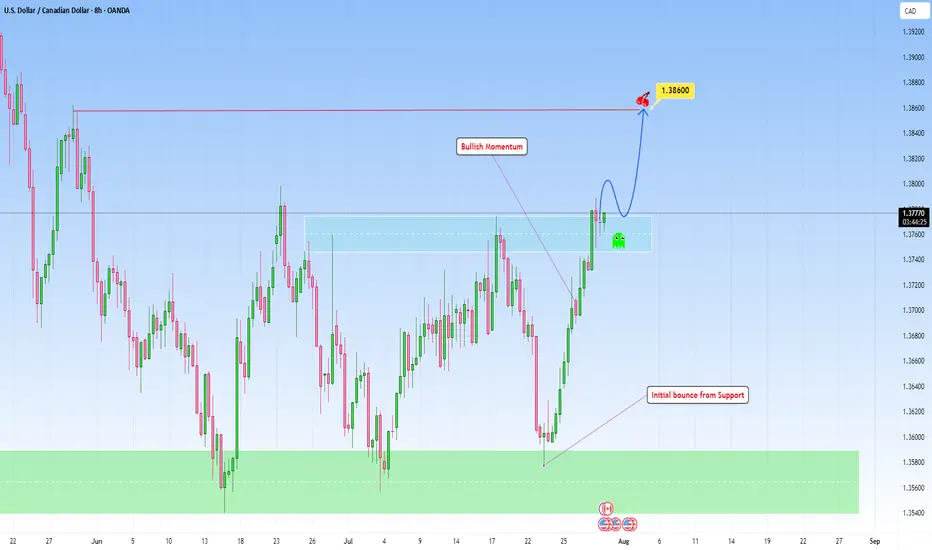
USDCAD bounced from Support and can continue higherLooking at the chart and the overall structure, I think we can favor the continuation setup with a emphasis on price action at key zones, particularly when price breaks out then can revisit this structure for a retest.
This bounce off support has been accomplished in my previous analysis:
Here, if price breaks with strength and dips back into the area and holds with bullish confirmation (likely a wick rejection or bullish engulfing on lower timeframes), that would be the cue to get in.
I am projecting the next target to 1.38600 that makes sense as a logical level for trend continuation and that I find achievable.
Harmonic Patterns
XAUUSD-4HXAU/USD – 4H Technical Analysis
Gold (XAU/USD) is currently testing the upper boundary of a descending channel on the 4-hour chart. The overall trend remains bearish, and this resistance zone may act as a potential reversal point.
If price fails to break above the channel resistance, a downward move toward the lower boundary is likely.
🔹 Trend: Bearish
🔹 Entry Zone: Near channel resistance
🎯 Target: 3250
🛑 Stop-Loss: 3221
Traders should watch closely for bearish price action signals at the top of the channel. A confirmed rejection could offer a shorting opportunity.

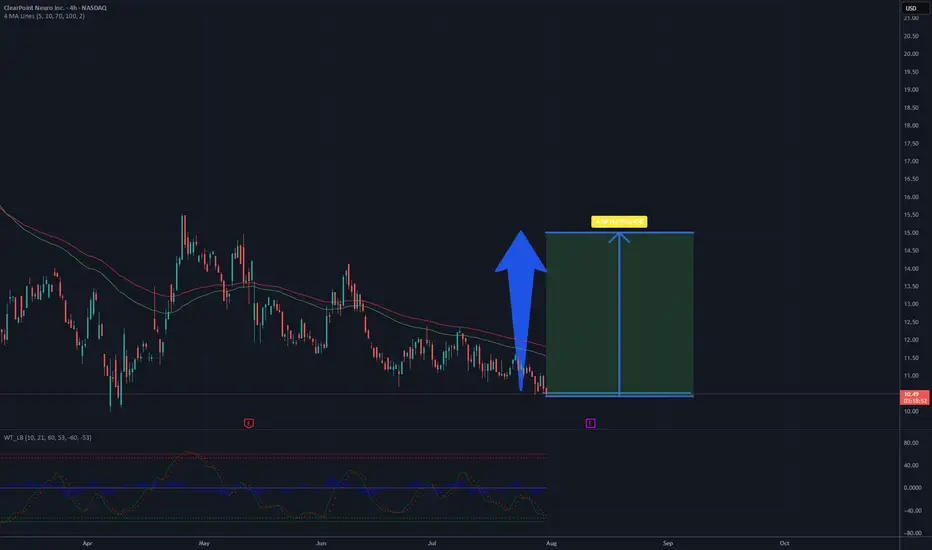
Is a time for CLPT? Around 50% profit - 15 USD targetThe chart depicts a 4-hour candlestick pattern for ClearPoint Neuro Inc. (CLPT) on NASDAQ, covering late 2024 to mid-2025. The stock has recently declined from a peak near 10.7 USD, with the price currently around 10.07 USD as of July 31, 2025. The moving averages (red and green lines) show a bearish crossover, indicating short-term downward momentum, but the price is close to a support level around 10 USD. The oscillator at the bottom suggests oversold conditions with a slight upward bounce, hinting at potential reversal. If buying volume increases and the support holds, a recovery to 15 USD appears feasible in the coming weeks, supported by historical resistance levels near that mark.
The continued expansion of clinical sites globally and the commercialization of the ClearPoint PRISM Neuro Laser Therapy System may broaden the company’s market reach, potentially boosting sales and partnerships in the neurosurgery and gene therapy sectors.
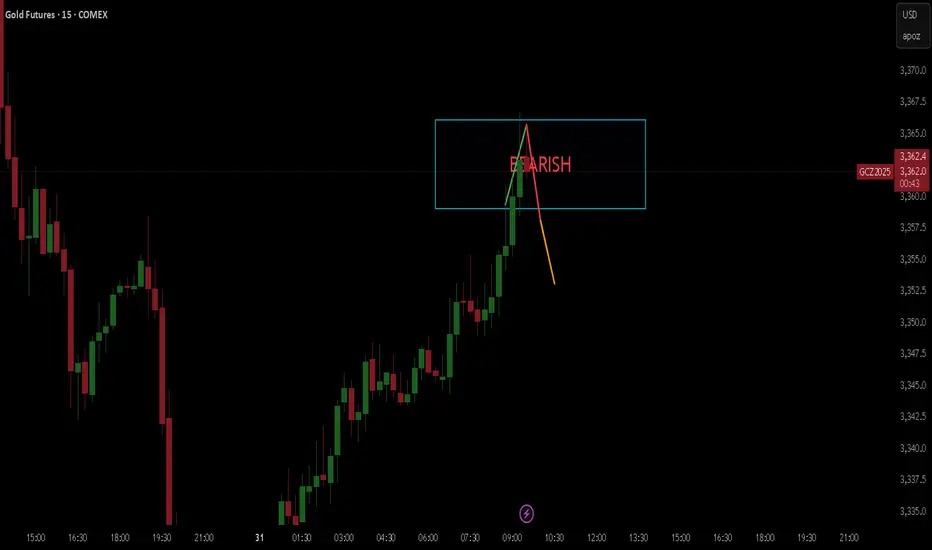
Repeated pattern?We have to wait and see whether gold is going to repeat the same pattern or if this time it manages to rise from that level.

Ethereum's futile attempt to go up.Ethereum’s pointless push and unnecessary insistence on going up — if it really wants to hit a new ATH, it needs to drop first, both to take a breather and to let buyers with lower buy orders get into the game.

GOLD BEARISHHello,
I hope you are well.
I have an excellent opportunity for you on gold.
I see a 90% chance that gold will start to fall, so get your strategies and money management ready!
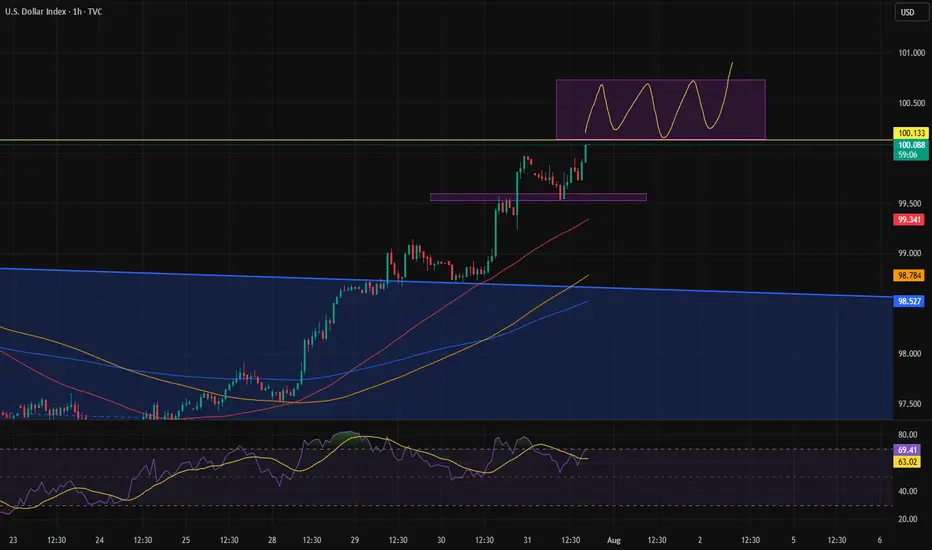
Range above 100.It seems like the dollar is trying to push back above the 100 level after a long time, and it's likely forming a range up there to establish stability in that zone.

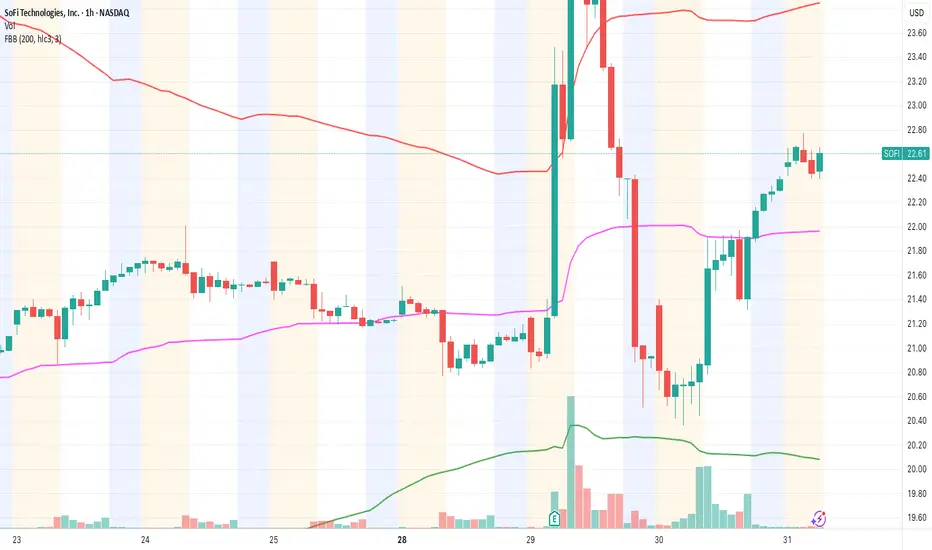
SOFI meets 25 out of 28 technical & fundamental criteria – SwingEntered at $22.55 after full validation through our 28-criteria system.
✅ Strong earnings (positive revenue growth & stable forward guidance)
✅ Dilution concerns cleared (no new share offering)
✅ Breakout confirmed above VWAP with clean pullback
✅ Accelerated momentum and rising premarket volume
✅ Healthy RSI (no overbought in 4h or daily chart)
✅ No major resistance until the $24.90–$25.20 zone
📍Key Levels:
🎯 Entry: $22.55
🛑 Stop Loss: $21.80
🎯 Target: $25.00
⏳ Expected duration: 1–2 days (swing)
🔁 Risk/Reward: 2.5:1
Fibonacci insight:
Price respected the 38.2% level during the pullback. The 161.8% extension points right to the $25 zone.
📊 Context:
Fintech sector is gaining strength, and SOFI is leading with strong fundamentals and bullish momentum.
If we open above $22.50 with strong volume, I expect a bullish continuation.
I'm tracking every trade as part of a new system currently under test.
If you want to follow this signal to the end, feel free to follow along. ✌️
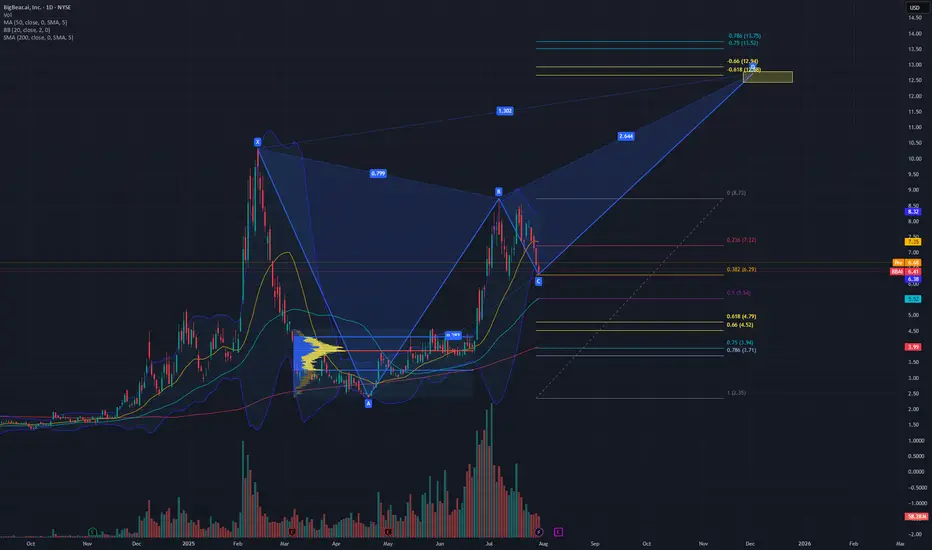
XABCD pattern playing out $12 targetBBAI is looking like it will play out the XABCD butterfly pattern if it continues to rally from the .382 of the pull back from previous $2.35 lows and 8.73 highs.
Breaking down and close below the $6.06 daily candle will potentially expose the previous consolidation POC at $3.87, which is a .75 pull back.
Using Fib time, I am expecting a $12 range around this year in December.
Will look to open a 7/12 bull call spread at Jan 2027 exp.
Injective (INJ): Getting Ready To Bounce | BullishINJ seems to be going for another upside movement here after a recent retest of the local support zone, where the price is now trying to break that middle line of Bollinger Bands, which is like a final stage for our upside movement here.
So that's what we are looking for: a break of the middle line of the Bollinger Bands and then a steep movement to upper zones.
Swallow Academy

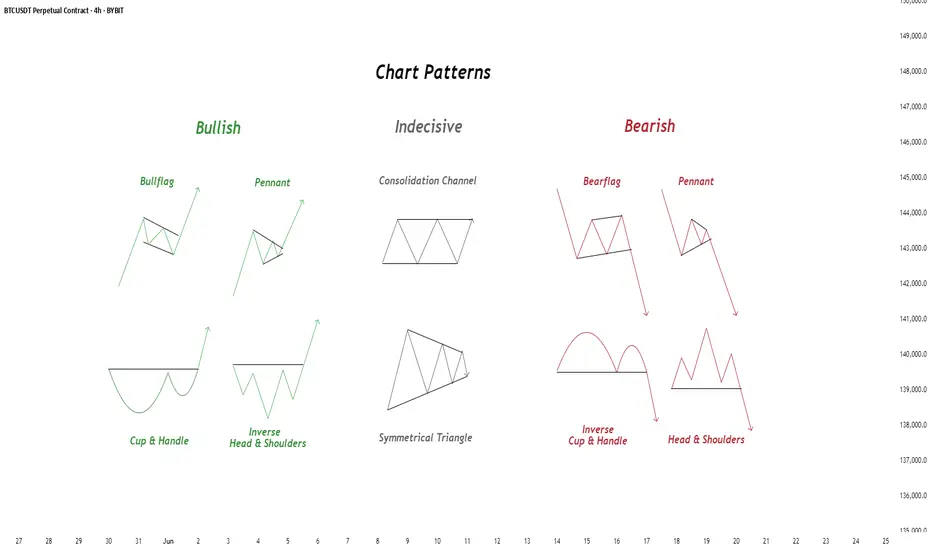
Chart Patterns - How to read them like a ProChart patterns are visual formations on price charts that help traders anticipate potential market movements.
These patterns fall into three main categories: bullish , bearish , and indecisive .
---
1. Bullish Chart Patterns
Bullish patterns often signal that price is likely to move upward.
1.1 Bull Flag
* What it looks like: A sharp upward move followed by a small downward-sloping rectangle (the flag).
* Meaning: After a strong rally, the price consolidates briefly before continuing higher.
* Key insight: A breakout above the flag typically signals a continuation of the trend.
1.2 Pennant (Bullish)
* What it looks like: A strong upward move followed by a small symmetrical triangle.
* Meaning: Similar to the bull flag, but the consolidation takes a triangular form.
* Key insight: Once price breaks above the pennant, the uptrend often resumes.
1.3 Cup & Handle
* What it looks like: A “U”-shaped curve (the cup) followed by a small downward drift (the handle).
* Meaning: This pattern suggests a period of accumulation before price breaks higher.
* Key insight: A breakout above the handle signals the beginning of a new bullish leg.
1.4 Inverse Head & Shoulders
* What it looks like: Three low points, with the middle low being the deepest.
* Meaning: This reversal pattern appears after a downtrend and signals a potential change to an uptrend.
* Key insight: A breakout above the “neckline” confirms the reversal.
---
2. Indecisive Chart Patterns
These patterns show market hesitation, where neither bulls nor bears are clearly in control.
2.1 Consolidation Channel
* What it looks like: Price moves within a horizontal channel.
* Meaning: Market is moving sideways with no strong trend.
* Key insight: A breakout in either direction often leads to a significant move.
2.2 Symmetrical Triangle
* What it looks like: Two converging trend lines forming a triangle.
* Meaning: This is a neutral pattern that can break out in either direction.
* Key insight: Traders wait for a breakout before taking a position.
---
3. Bearish Chart Patterns
Bearish patterns signal a high probability of downward price movement.
3.1 Bear Flag
* What it looks like: A sharp decline followed by a small upward-sloping rectangle.
* Meaning: After a strong drop, price consolidates before continuing lower.
* Key insight: A breakout below the flag suggests a continuation of the downtrend.
3.2 Pennant (Bearish)
* What it looks like: A sharp downward move followed by a small symmetrical triangle.
* Meaning: Similar to the bear flag, but the consolidation takes a triangular form.
* Key insight: A breakout downward typically resumes the bearish trend.
3.3 Inverse Cup & Handle
* What it looks like: An upside-down cup with a small upward drift forming the handle.
* Meaning: Indicates weakness after an uptrend, often followed by a drop.
* Key insight: A break below the handle usually signals a strong bearish move.
3.4 Head & Shoulders
* What it looks like: Three peaks, with the middle one being the highest.
* Meaning: A classic reversal pattern that indicates a potential shift from an uptrend to a downtrend.
* Key insight: A break below the “neckline” confirms the bearish reversal.
---
How to Use These Patterns
* Combine pattern recognition with support/resistance, volume, and indicators for stronger confirmation.
* Always wait for breakouts and avoid acting too early.
* Manage risk with stop-loss orders.

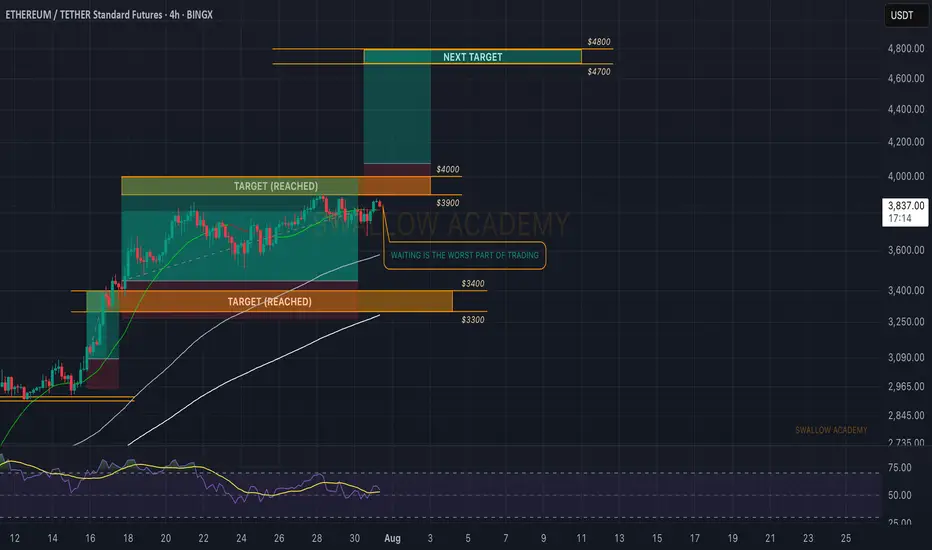
Ethereum (ETH): Waiting Is The Worst Part Of Trading | $4800ETH still looks good; we hit the target lately and now we are looking for the breakout to happen, which will give us another opportunity for a long position towards the $4800 zone.
Swallow Academy
A PICTURE IS WORTH A THOUSAND WORDS.The two charts are only separated by name, both are working out a correlated fractal structure.
The exact position of Solana compared to the Tesla fractal is much elusive. Two possible considerations of current structure in Solana fit equally into the past trend already completed by Tesla
The two possible scenarios are indicated on the chart above,
1. If the 21st July 2025 top in Solana corresponds to the 4th April 2022 point on Tesla, the price action will favourably follow the white line.
2. If the 21st July 2025 top in Solana rather aligns with the 17th July 2022 point on Tesla, then price will likely make a minor correction and move higher as indicated by the gold line.
Please note, the year dates below the lines are not to be considered, the lines are just for illustrations only. Also note that the extent of corrections or expansions in fractals are not necessarily the same, they only share similar structural forms.
Trade safe, good luck

XAUUSD Long Setup – 1HGold (XAUUSD) has shown strong bullish rejection from the lower volatility band after a sharp selloff. The appearance of a Heikin Ashi reversal candle, suggests a short-term reversal is forming. Price has reclaimed key structure and is now targeting a reversion back to the mean, supported by Fibonacci retracement levels.
Entry: 3293.55
Target Zone: 3308.91 → 3333.76 (Fib 38.2% – 100%)
Stop Loss: 3253.35
Confluences:
✅ Bullish engulfing + Heikin Ashi trend shift
✅ Oversold bounce from lower channel extremity
✅ Fib retracement aligns with key structural resistance zones
✅ Custom signal confirmation (green dot)
✅ Clean R:R toward upper band and previous POI
Short-term counter-trend long targeting liquidity grab and mean reversion toward the 3308–3333 zone. Risk tightly managed with SL below local swing low.

DXY ShortDXY is likely to fall from $99.8 upon reaching it, based on the Crab Pattern, potentially reaching targets TP #1 - TP #2.

AGTUSDT.P LONGLets see some strong bullish moments at our entries level and most important we need to retest it with bullish candles. If not spotted than BOTTOM level is our point.
Let me give you guys the brief why i have chosen these two entries level as we can all see its forming a W pattern at this level. If price shows bullish momentum at these level than probably we are forming W.
Rest DYOR.
Follow me and support me to post more analysis.
Thank you.

NOTUSDT.P LONGThe price is breaking the curve line and most of the time when we break the curve with bullish candles we get the demand sooner and without retesting.
Lets see how it plays. I dont think so the market will go till my second entry point lets wait and watch what price do and how the 4hr candle closes.
Follow me and support me please.

BTCUSDT.P LONGThe price is squeezed and its Sunday we might get a big move Positive Lets hope for the best and plan our trading.
I have marked 2 entries I think the more we wait the more we get.
So entry 2 in my opinion will be more beneficial to trail this trade. Anyhow if we see any bullish momentum on these level we are IN guys.
WHY? why i planned this trade as we can see the we are on sunday and price squeezed and we are already in bull run and we can see the price break the curve resistance so i hope the price will retest the level and if we see bullish candle patterns than only we will execute it.
If you like my previous ideas and analysis please don't forget to follow me. We all need encouragement. The more followers the more encouragement.

Gold trading analysis!Macro approach:
- Gold retreated this week, reversing early gains to trade near four-week lows amid renewed US dollar strength and caution ahead of the Fed's policy decision.
- The retreat was mainly pressured by stronger-than-expected US economic data and a tentative revival in risk appetite, offsetting pockets of safe-haven demand.
- Key drivers included robust US GDP growth for 2Q, a bounce in consumer confidence, and the Fed's steady rates with a more hawkish tone, suggesting cuts may be further out.
- Meanwhile, recent US-EU and US-China trade deals eased some global uncertainty, damping gold's appeal as a hedge.
- Market participants also eyed the labor market's continued cooling, but resilient consumer spending further buoyed the dollar.
- Gold may remain volatile, with potential upside if upcoming US PCE inflation and NFP reports disappoint expectations. Any escalation in trade tensions or signals of Fed policy easing could renew support for gold prices.
Technical approach:
- XAUUSD fluctuated within the range of 3285-3560, which is below the broken ascending trendline. The price between the two EMAs awaits an apparent breakout to determine the next trend.
- If XAUUSD breaks below the support at 3273, confluence with EMA78, the price may plunge to retest the following support at 3167.
- On the contrary, remaining above the support at 3273 may lead XAUUSD to retest the resistance at around 3560.

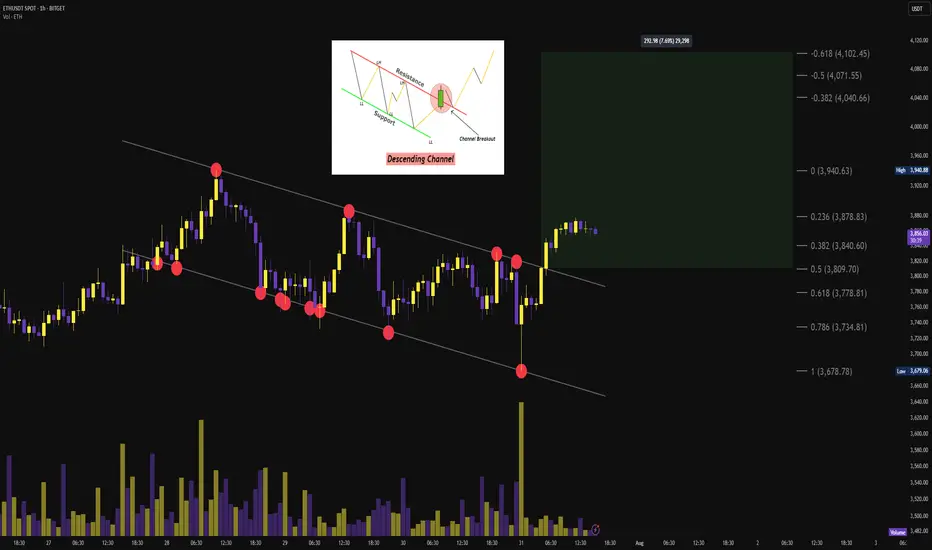
$ETH 1H Descending Channel Breakout🟩 Breakout Level: $3,770
🟩 Fib-Based Targets:
→ $3,878 (0.236)
→ $3,940 (0)
→ $4,040 (0.382)
🟥 Invalidation:
Break back inside the channel + loss of $3,678
Momentum Summary:
Perfect touchpoints across the descending channel. Final wick tagged demand with massive volume, followed by impulsive breakout and retest. Short-term structure favoring bullish continuation.
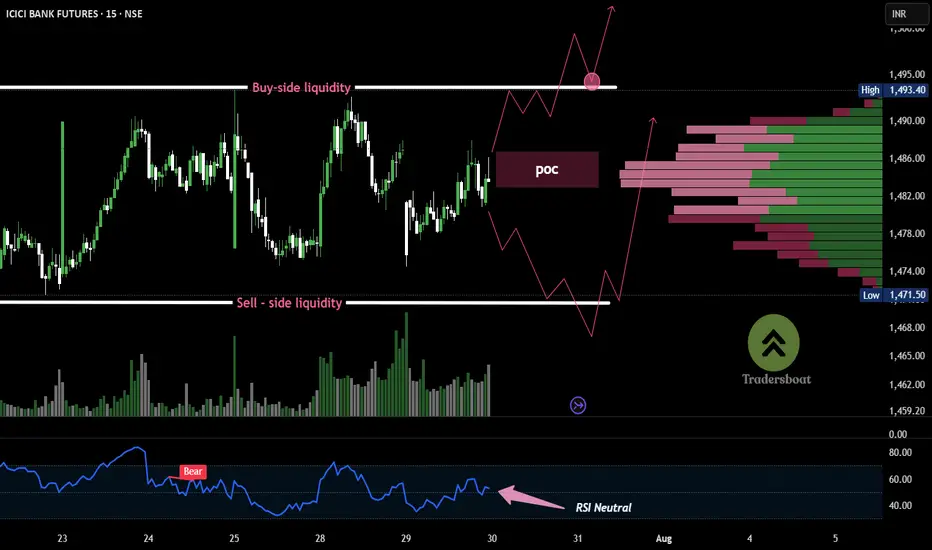
ICICI BANK -15MIN Volume bulge at ₹1485 = decision pointICICI Bank Futures is consolidating in a tight range between ₹1462 and ₹1493, building both buy-side and sell-side liquidity. This structure typically precedes a strong breakout.
The volume profile shows a concentration around ₹1484–₹1486, indicating it as a decision zone. RSI remains weak below 50, suggesting short-term bearish control, but a breakout in either direction could trigger momentum.