USD/JPY Bearish Setup - Breakout from Ascending ChannelUSD/JPY Bearish Setup – Breakout from Ascending Channel
Price action on USD/JPY has broken down from an ascending channel, signaling potential bearish momentum ahead. The breakdown suggests a possible continuation toward lower support levels.
1st Support Level: 144.800 – 144.200
2nd Support Level: 143.000 – 142.400
Watch for price consolidation or retests at the 1st support level. A clean break below this zone could open the path toward the 2nd support level.
Key Notes:
Bearish volume increase post-breakout
Ichimoku cloud starting to thin, showing weakening bullish momentum
Structure favors selling rallies below the channel
📉 Bias: Bearish
💡 Plan: Wait for confirmation on lower timeframes before entering short positions
Harmonic Patterns

Ethereum: Smart Money Reversal After Stop Hunt?In the previous update, we warned that Ethereum might drop lower before any meaningful bounce — especially if it failed to hold the midline of the ascending channel. That scenario played out exactly as anticipated.
🟡 Price action summary:
ETH broke below the midline of the weak ascending channel, hunted the liquidity below recent lows, and tapped into the key bullish order block near $3,490 – $3,520. Price is now reacting to this zone with early signs of a reversal.
📌 Key observation:
Midlines of weak or low-momentum channels often act as liquidity traps in smart money models. Buying at these levels can be extremely risky — especially during corrective or distribution phases.
⸻
📚 Educational Note:
Never enter long positions solely at the midline of a weak ascending channel, especially when there’s a high probability of liquidity sweep below. Smart entries usually occur at order blocks formed after stop hunts.
⸻
🎯 Next steps:
Wait for confirmation (such as internal BOS or FVG closure) before entering longs. The structure suggests a potential move back toward the upper boundary of the channel if this OB holds.
⸻
🔗 Save this analysis and share it with fellow traders.
💬 Thoughts? Drop your view in the comments.

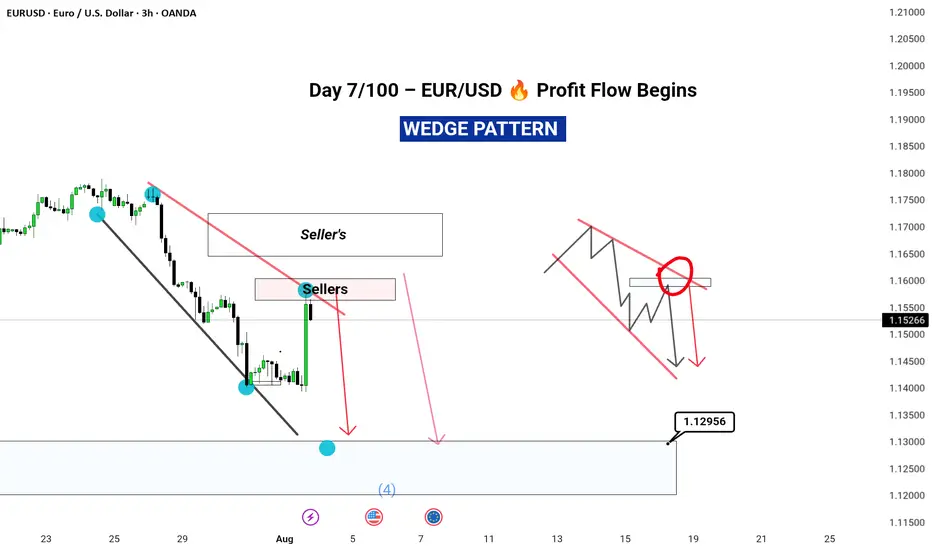
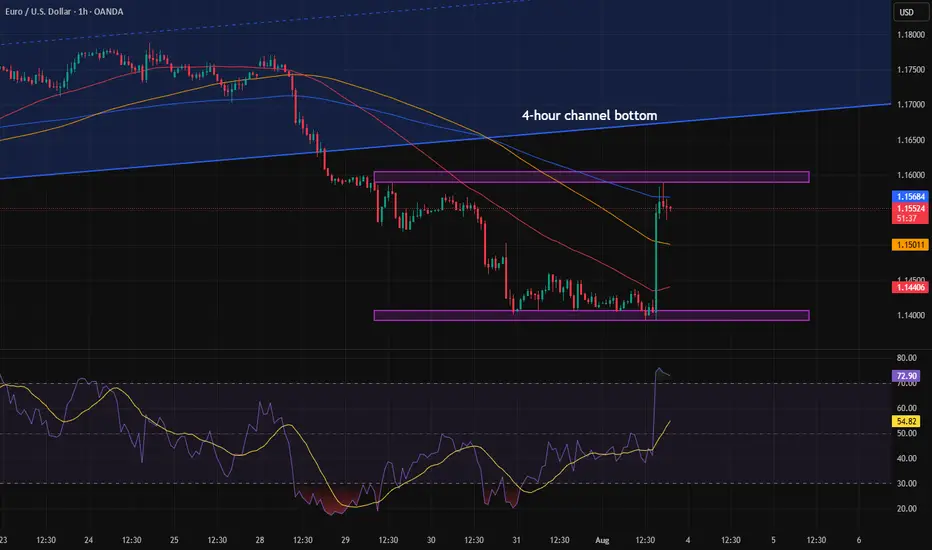
“Exactly What I Saw” promises value and transparency.
In today's analysis, I’ve identified a clear completion of Wave D, securing a 3% ROI across just two trades – all before the move unfolded.
🔍 What’s inside this breakdown?
• Multi-timeframe analysis: Weekly ➝ Daily ➝ 4H ➝ 1H
• Elliott Wave structure with confluence zones
• Trade psychology at key turning points
• Exact entry & exit insights explained
• Risk management for consistent returns
---
⚡ Highlights:
Precise reversal spotted before it was obvious
No indicator clutter – just clean, confident price action
Part of my 100-day breakdown series: real, raw, and repeatable setups
---
👣 Day 7 of 100 is just the beginning.
Tap Follow to stay ahead of the market – one wave at a time.
#EURUSD #ForexAnalysis #ElliottWave #Forex #TradingViewUK #SwingTrading #PriceAction #RiskReward #FXMindset #ForexTradersIndia #ForexEducation
127-128k incoming ( altcoins round ? )Hi, Bitcoin seems to have completed its short term Elliott wave 4 correction and the price action analysis also confirms that this time Bitcoin will be able to break the 120-119 resistance, I predict Bitcoin to make a new high around 127-128. Altcoins have not grown that much yet and if the price can make a reliable consolidation above 120k, altcoins will start to rise.

Gold Surges on Non-Farm Data; 3330 Key Next WeekGold was strongly boosted by the significantly bullish non-farm payroll data, surging sharply like a rocket 🚀, with gains that completely "wiped out" all the weekly losses. The current gold trend, as if injected with super momentum, has completely broken the previous long-short stalemate. Starting from the 3300 level, it has been breaking through obstacles all the way up to 3350. At present, 3330 is like a critical "battleground" ⚔️ fiercely contested by both long and short sides.
This week, when gold was still "lingering" below 3300, I emphasized repeatedly that a rebound was inevitable – we just needed to stay calm and wait for the opportunity. As it turns out, our judgment was spot on, and we successfully took profits around 3340, reaping good gains 💴. Now, gold prices are oscillating back and forth in the 3340-3350 range. Based on a comprehensive analysis of the current trend, I boldly predict that gold is likely to pull back to around 3330 next week, so everyone can prepare in advance 🤗
⚡️⚡️⚡️ XAUUSD ⚡️⚡️⚡️
🚀 Sell@ 3350
🚀 TP 3330 - 3320 - 3310
🚀 Buy@ 3300 -3310
🚀 TP 3320 - 3330 - 3340
Daily updates bring you precise trading signals 📊 When you hit a snag in trading, these signals stand as your trustworthy compass 🧭 Don’t hesitate to take a look—sincerely hoping they’ll be a huge help to you 🌟 👇

Let's buy BTCUSD on correction!I found interesting opportunity in BTCUSD right now.
It has been moving in consolidation channel after recorded its all time high.
Based on Elliot Wave count, the price right now is making it's wave 4.
The next possible target is 120-125k.
CHEEEERRRSSS..!!!

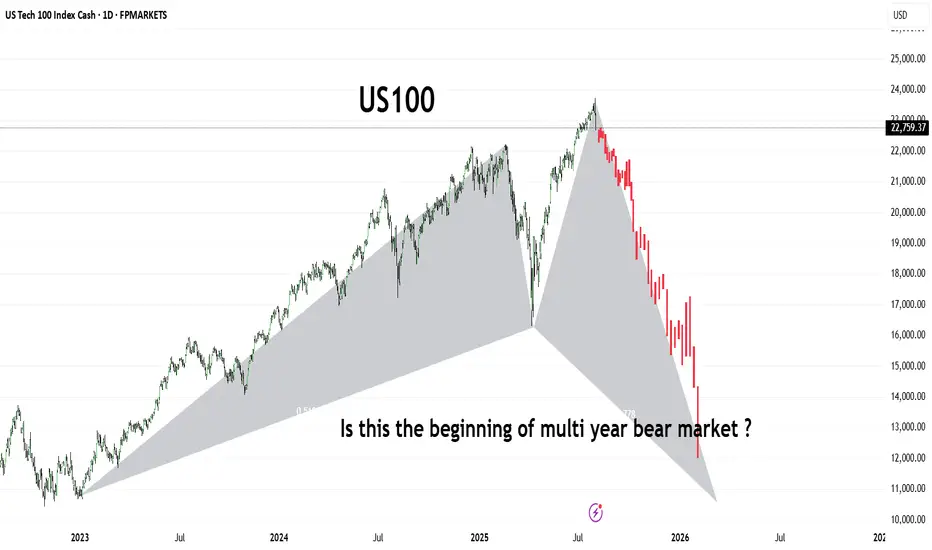
US100The US100 (Nasdaq 100) has shown a dramatic shift in trend, forming what appears to be a large-scale bearish harmonic pattern or potential M-top structure. After reaching its peak in mid-2025, the index has entered a sharp downward trajectory, shedding significant value in a short span.
This chart raises a critical question for long-term investors and traders:
Are we witnessing the early phase of a prolonged bear market that could stretch into 2026 and beyond?
🔻 Key Observations:
Bearish structure developing with aggressive selling pressure.
Potential breakdown from long-term support trendlines.
Momentum suggests institutional risk-off behavior.
Stay alert for macroeconomic cues, interest rate policy, and earnings season signals. A break below 13,000 could confirm a deeper bear cycle
GBPUSD is in Bearish Reversal Head & ShoulderGBPUSD is showing clear bearish head & shoulder pattern on daily chart it will retrace for some time to get close to the price 1.33788 at that point short sell will be good

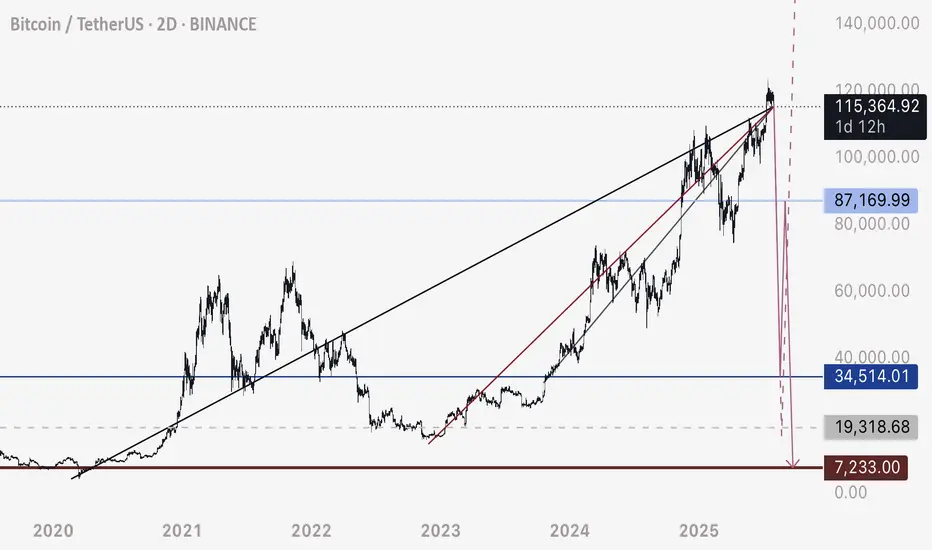
BTC - Not the End of the DropRather the beginning. Bitcoin has fallen below this bearish intersection. Anticipating price to fall rapidly on one of these two pathways to the Uber low liquidity levels.
DXY is retesting a major bearish breakdown - this is the conduit that will justify a flash crash of this magnitude prior to a 3-5 year bull run.
Happy trading.
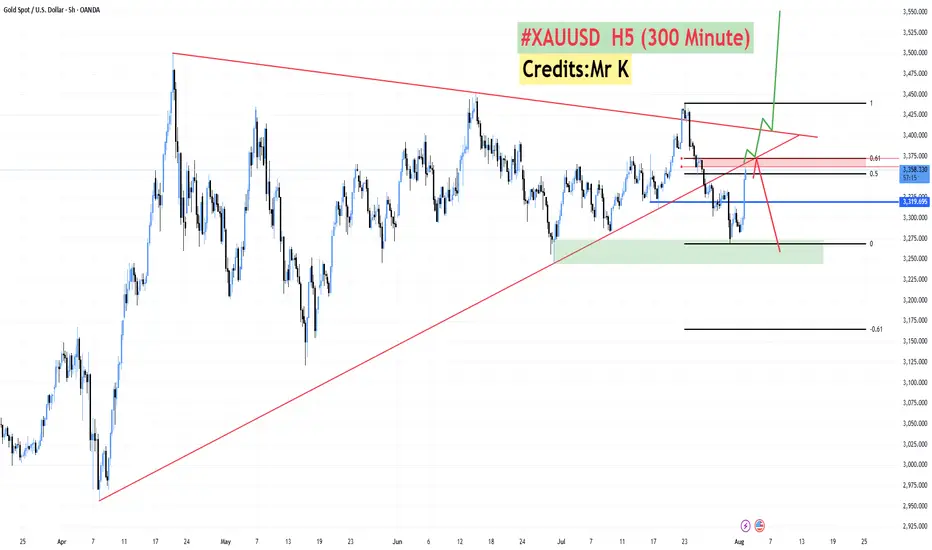
**#XAUUSD H5 Higher Timeframe Analysis**
📊 **#XAUUSD H5 Higher Timeframe Analysis**
What we witnessed today was a **tremendous recovery in Gold 🟡** after **3–4 consecutive bearish sessions 📉**.
📅 **Today’s candle** has **completely flipped the weekly structure**, turning a fully **bearish weekly candle into a bullish one 📈** — thanks to the **NFP data** that came in **favor of Gold and against the Dollar 💵❌**.
🔍 However, price is now approaching a **critical confluence zone**:
* 🧭 A **long-running trendline** (since April)
* 🔴 An **H4 Bearish Order Block**
* 📐 The **Fibonacci Golden Zone (0.50–0.618)** at **3362–3372**
📌 **From this level, we have two possible scenarios:**
1️⃣ **Sharp Rejection 🔻:**
Price may **reverse sharply** from the 3362–3372 zone and **resume the bearish trend**.
2️⃣ **Breakout & Trap Theory 🔺:**
If price **sustains above this zone**, it may signal that the recent **3–4 day drop was a fake breakdown**, designed to **trap sellers** and grab liquidity for a **further upside move**.
✅ **Confirmation will come if we get an H4–H6 bullish candle close above the trendline** and back inside the **buying zone of 3375–3390**.
🔓 **A breakout above the triangle pattern** will likely lead to a **strong bullish continuation 📈🚀**.
We might be changing the trend in the coming months!I found this indicator extremely accurate for the past tops. We are focusing on the histogram today and looking once that green candles starts growing momentum taking BTC down the hill. If this idea proves right we might be bottoming around 400 days perhaps August 2026 ~45k

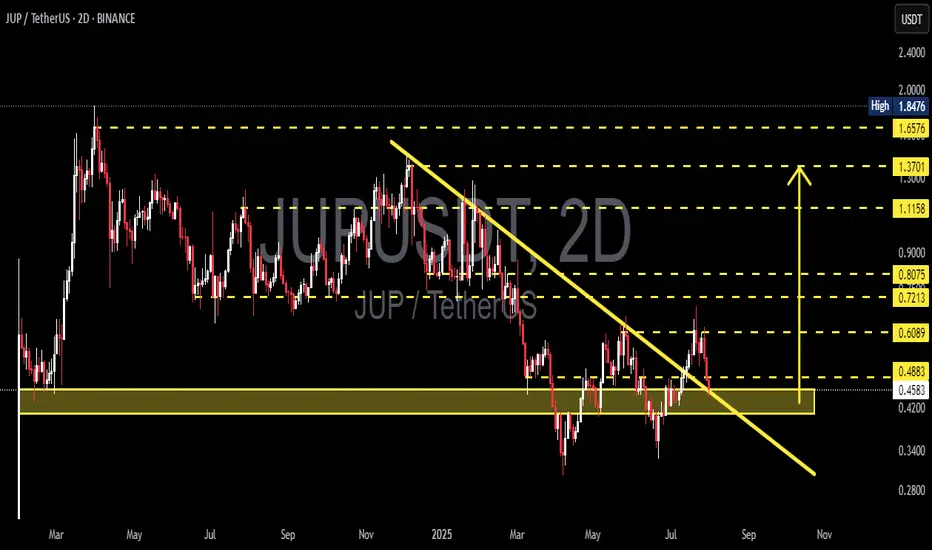
JUP/USDT Retests Key Support! Bounce Incoming or Breakdown Ahead📉 Complete Technical Analysis:
The JUP/USDT pair is currently showing a critical price action after breaking out from a medium-term descending trendline (yellow diagonal line). However, the price is now retesting a major demand zone around $0.4200–$0.4574.
📌 Pattern Identified:
Descending Trendline Breakout: Price successfully broke above a long-standing bearish trendline.
Retest of Breakout Zone: The current move is a classic retest, often seen before a trend reversal continuation.
Strong Demand Zone: The yellow zone ($0.4200–$0.4574) has historically served as a strong accumulation and bounce area.
---
📈 Bullish Scenario:
If the price holds and bounces from the $0.4200–$0.4574 zone, bullish momentum could resume with upside targets:
Short-term target: $0.6089
Next resistances: $0.7213 – $0.8075
A confirmed higher low above support would strengthen the bullish structure.
---
📉 Bearish Scenario:
If the price breaks down below $0.4200, bearish pressure could return, leading to further downside.
Potential decline toward deeper support levels around $0.35–$0.30.
Breakdown with increasing volume would confirm seller dominance.
---
🎯 Key Levels to Watch:
Support Zone: $0.4200 – $0.4574 (Critical Retest Area)
Immediate Resistance: $0.4883, $0.6089
Major Resistance Levels: $0.7213, $0.8075, $1.1158, up to $1.6576
---
🧠 Conclusion:
JUP/USDT is currently at a crucial decision point. The reaction at this support zone will define whether the breakout holds or fails. Traders should watch this level closely for confirmation of the next major move.
#JUPUSDT #CryptoAnalysis #AltcoinUpdate #TechnicalAnalysis #CryptoBreakout #SupportAndResistance #TradingView #Cryptocurrency #ChartPattern #BullishSetup #BearishCase
GOLD OUTLOOKMy view on Gold ..
More likely to retrace to the bearish PRZ from where i'll be looking for Sell setup on the lower time frames

Microvision Inc (MVIS).Stock on triggering Explosive Level.
🦈 Shark Harmonic shap Target price above 14$ .
Any breaking up Resistance level 1.21$ , Buying signal triggering, Explosive level = 1.95$
Highly recommended for Buying now 👌

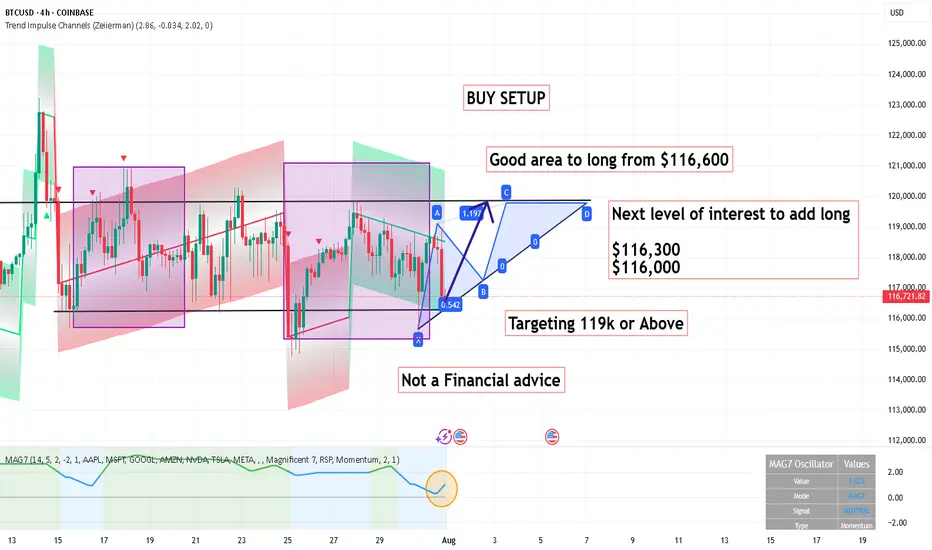
BUY SETUP ,Good area to long from $116,600BUY SETUP
Good area to long from $116,600
Next level of interest to add long
$116,300
$116,000
Targeting 119k or Above
Its not a Financial advice
Pattern targetIn the previous analysis, we spotted a head and shoulders pattern and mentioned that if it gets activated, it will hit the pattern target — and that’s exactly what happened.
A clean and beautiful setup.
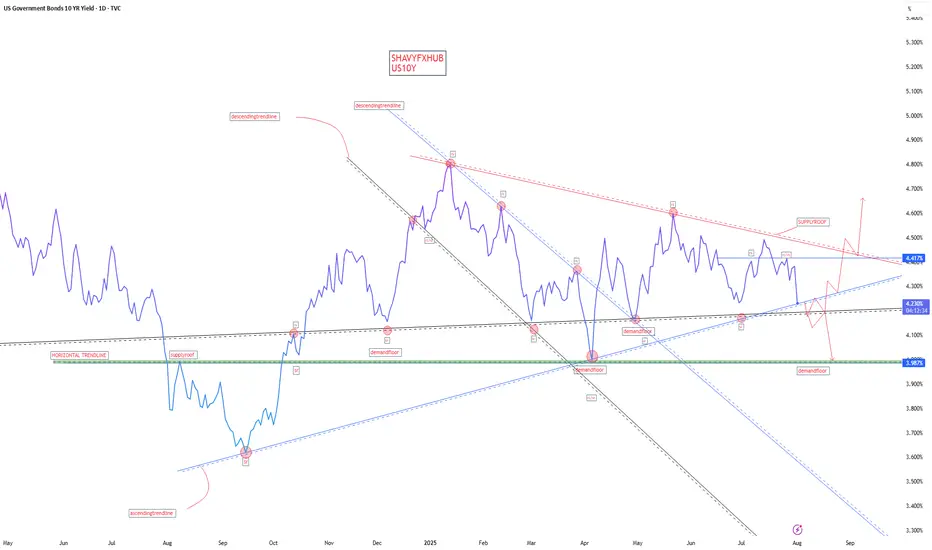
US10Y1. Labor Market Data
Average Hourly Earnings m/m:
Actual: 0.3%
Forecast: 0.3%
Previous: 0.2%
Interpretation: In-line with forecast and slightly above the prior period, indicating stable wage growth. This suggests inflationary pressures from labor costs remain steady, not accelerating unexpectedly.
Non-Farm Employment Change:
Actual: 73,000
Forecast: 106,000
Previous: 14,000
Interpretation: A clear downside surprise; job gains are well below expectations, and while up from a low previous period, this points to softening labor demand—an early sign of slack in the job market.
Unemployment Rate:
Actual: 4.2%
Forecast: 4.2%
Previous: 4.1%
Interpretation: Matches the forecast but marks a slight uptick, reinforcing mild labor market weakness.
Fed View: The Fed will interpret softer than expected job growth and a higher unemployment rate as evidence of easing labor market pressures—a dovish signal that could support future policy easing if the trend continues.
2. Manufacturing and Industry
Final Manufacturing PMI (S&P Global):
Actual: 49.8
Forecast: 49.7
Previous: 49.5
Interpretation: Slightly above forecast but still below the 50 threshold, indicating contraction persists but is less severe.
ISM Manufacturing PMI:
Actual: 48.0
Forecast: 49.5
Previous: 49.0
Interpretation: Below both forecast and prior; contraction in the manufacturing sector is deepening.
ISM Manufacturing Prices:
Actual: 64.8
Forecast: 69.9
Previous: 69.7
Interpretation: Lower than both forecast and previous, signaling input price pressures are easing—positive for the Fed’s inflation outlook.
Fed View: Ongoing contraction in manufacturing and lower input prices support the argument that inflation risks are cooling from the supply side, allowing for a more dovish stance.
3. Consumer and Construction
Revised UoM Consumer Sentiment:
Actual: 61.7
Forecast: 62.0
Previous: 61.8
Interpretation: Slightly below forecast, little change—consumer confidence remains relatively subdued.
Construction Spending m/m:
Actual: -0.4%
Forecast: 0.0%
Previous: -0.4%
Interpretation: Same as previous, misses forecast—ongoing weakness in construction and real estate investment.
Fed View: Weak consumer sentiment and persistent soft construction data reinforce slower demand-side dynamics, an argument in favor of pausing or even cutting rates.
4. Inflation Expectations
Revised UoM Inflation Expectations:
Actual: 4.5%
Forecast: Not directly listed (prior 4.4%)
Interpretation: Ticks up slightly, indicating that consumers expect inflation to remain higher. This could temper the Fed’s willingness to cut rates too soon—if expectations become unanchored, the Fed may have to stay hawkish.
Overall Fed Interpretation
Labor market: Softer than forecast, unemployment up—dovish for rates.
Manufacturing/industry: Slight improvement in PMI, but ISM shows contraction; input prices are easing—dovish.
Consumer/construction: Little improvement, still weak—dovish.
Inflation expectations: Up slightly—potential hawkish caution.
Net result: The data is mostly dovish—except for the higher inflation expectation which remains a concern. The Fed will likely see this data as supporting a “watchful pause” and adopt a more flexible stance: no immediate rate cut, but the case for easing is growing unless inflation expectations keep drifting higher. Sustained weak jobs or further easing in prices would increase the chances of a rate cut in coming months. Elevated inflation expectations will keep the Fed cautious about acting too quickly.
#DOLLAR #US10Y #STOCKS #BONDS #YIELD
Trend decision after the newsAfter the news, the price nearly reached the bottom of the higher time frame channel and paused. We need to see whether the price can break into the channel or not. Personally, I don’t think that will happen. I believe a range will form within the marked zone, and then the price will drop further.
HBARSimiliar scenario to BYBIT:BTCUSDT.P just have to wait for the daily close.
I marked out a potential entry are with the red line, which is a 4H order block which COULD be tapped
Again I will update you on my entry ASAP
Do not forget to follow and like, it helps me alot.
Stay blessed

ETHUSDTDISTRIBUTION +ACCUMULITON= RE ACCUMULITON
Accumulation begins and reaccumulation is being completed and the Wyckoff structure is completed
Composite Academy and Analysis
Professor Ramtia Siddiqui
Aram Pizbin Professor
BINANCE:ETHUSDT

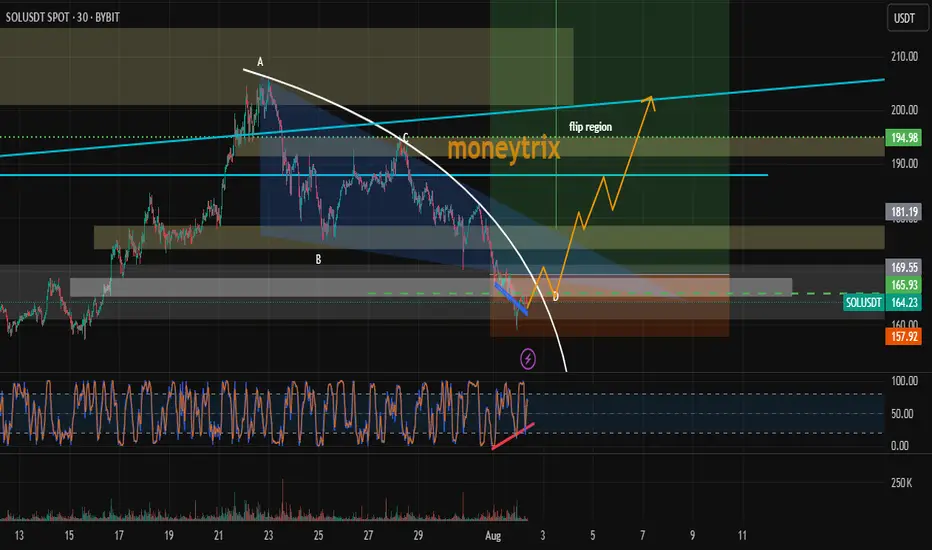
due to rsi divergence and fib zone long sol nowdue to rsi divergence and fib zone long sol now
fib golden zone triggered
demand zone triggred
rsi divergence and many other +ve sentiments
so we longged
its infinit market idea may be wrong so use sl 155$
#dyor too, im not financial advisor
VETUSDT is BullishPrice was in a downtrend, however the bullish divergence with a double bottom reversal pattern hints the control of bulls. If previous lower high is broken with good volume then we can expect a bullish reversal as per Dow theory. Targets are mentioned on the chart.

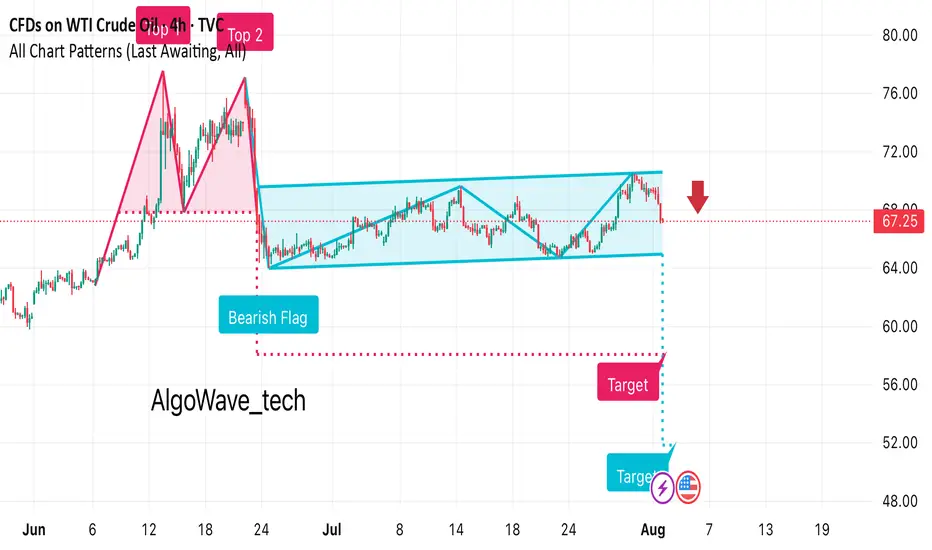
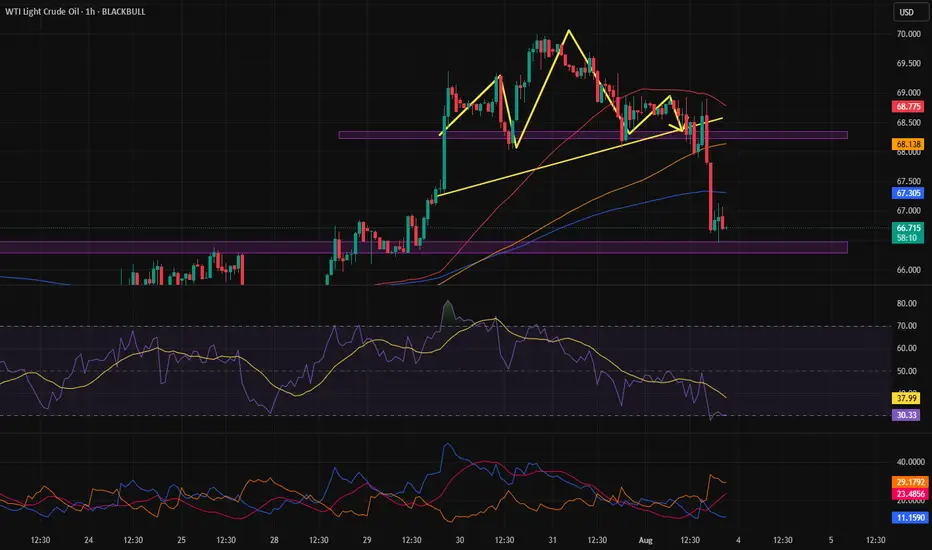
It looks like this chart for WTI Crude Oil is showing a bearish • Previous Move: There’s a strong downward leg before the flag formation, indicating bearish momentum.
• Flag Pattern: Price consolidates in an upward-sloping channel after the drop.
• Breakout: The chart suggests a bearish breakout below the channel, marked with a red arrow at around $67.25.
• Target Projection: The measured move target appears to be around the $53–54 range, based on the flagpole height.