BNB/USD Trend Summary
1. Recent Price Action & History
BNB is consolidating around $660–$690, recently hitting a 52‑week high near $793 in May, with a 24‑hour range between $668–$687
Nasdaq
+14
TradingView
+14
CoinDCX
+14
.
Over the past month, it’s gained ~2–3%, with an uptick of ~4% in late June
CoinLore
+3
TradingView
+3
changelly.com
+3
.
2. Technical Setups Supporting Uptrend
Descending wedge breakout on 4‑hour chart, with targets around $697–710, then resistance at $728
TradingView
+2
CoinDCX
+2
tradinglounge.com
+2
.
Bullish flag & inverse H&S patterns suggest continuation toward $750–800+ .
Elliott Wave count shows corrective Wave ② ending near $633, projecting a Wave ③ rise; invalidation if drops below $597
TradingView
+2
tradinglounge.com
+2
TradingView
+2
.
Support zones holding firm at $648–637 and $608–592 .
3. Key Indicators
Price is above short‑ & mid‑term EMAs, waiting for hold above the 100/200‑day EMA confluence (~$612)
tradinglounge.com
+3
Iconomi
+3
CoinDCX
+3
.
The Stochastic RSI is overbought, risks a short consolidation before next leg .
🎯 Trade Analysis & Recommendation
You mentioned TP = 781, SL = 610. Here's an aligned plan:
Aspect Details
Entry After retracement into $648–660 or break above $690
Stop Loss (SL) Place around $610–$597 (key support/invalidation zone)
Take Profit (TP) Primary: $750–781 zone; beyond that, targets near $800–$830 plausible
Risk Management Risk ~5%, expect consolidation before breakout
🧭 Summary
Bullish stance justified — price structure supports uptrend, with clear technical triggers and historical momentum. Watch $648–637 and $610–597 as critical levels for pullback and stop placement. If BNB stays above those, chance of hitting your $781 TP is solid, with upside potential beyond.
Bottom Line:
Go long on consolidation pullback or breakout above ~$690
SL: ~$610 (or conservative $597)
TP: initial $781, trailing into $800+ if momentum continues
Tailor position size for acceptable risk and monitor EMA/RSI for signs of exhaustion.
Harmonic Patterns

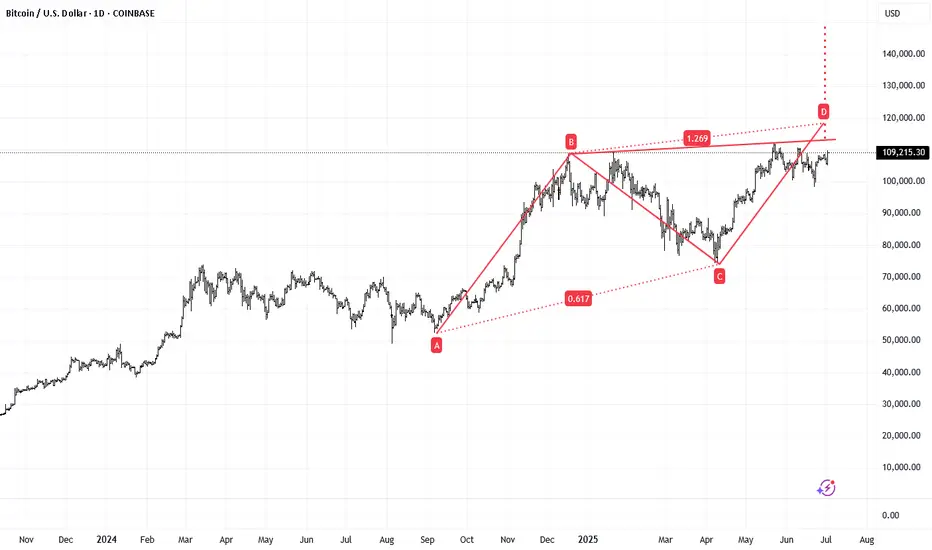
BTCUSD Bullish Medium-termBTCUSD is about to start the bull run.
Break of 113000 will target 118,000 before 150,000 in the coming 4 months.
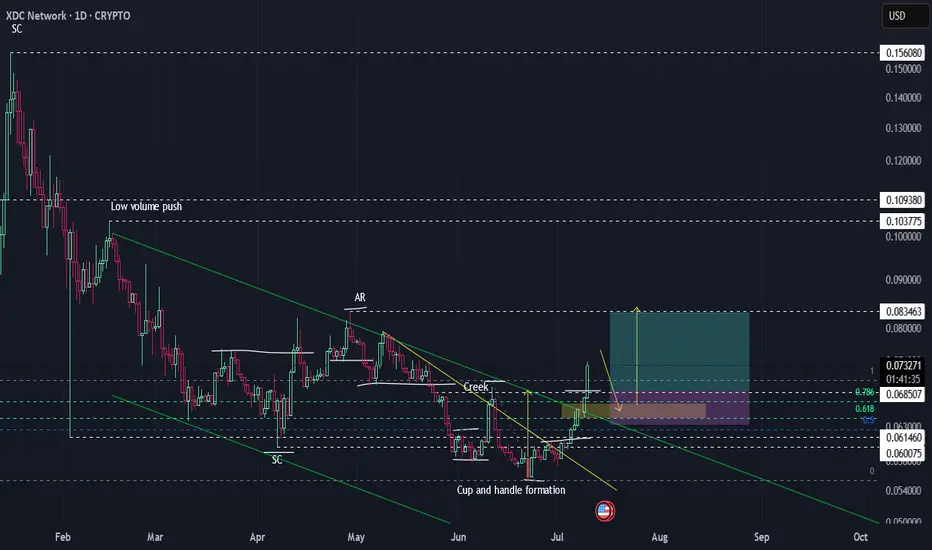
Wyckoff Accumulation + Cup & Handle | XDCUSD DailyClassic accumulation structure in play after months of channeling, with textbook Wyckoff signals: SC (Selling Climax), AR (Automatic Rally), and successful creek breakout. The current move shows a powerful expansion candle off a rounded “cup” base, with early FOMO buyers piling in.
DO NOT CHASE.
Best R:R comes from waiting for a pullback into the prior resistance zone, now potential support—watch the 0.618–0.786 retrace for a “reload” opportunity. This lines up with both Wyckoff’s “Back Up to the Creek” and the classic cup-and-handle handle formation.
Measured move targets above, but patience is key: history shows the first expansion leg often gets a sharp retrace. If price pulls back into the reload zone, look for confirmation and manage risk with clear invalidation below the recent low.
Stay stoic, ignore FOMO—let the setup come to you.
Key Levels:
0.618/0.786 retrace = watch for entry
Measured move target = green box
Invalid if closes back below the cup base
Chart markup: Accumulation, cup & handle, retrace zone, measured target.
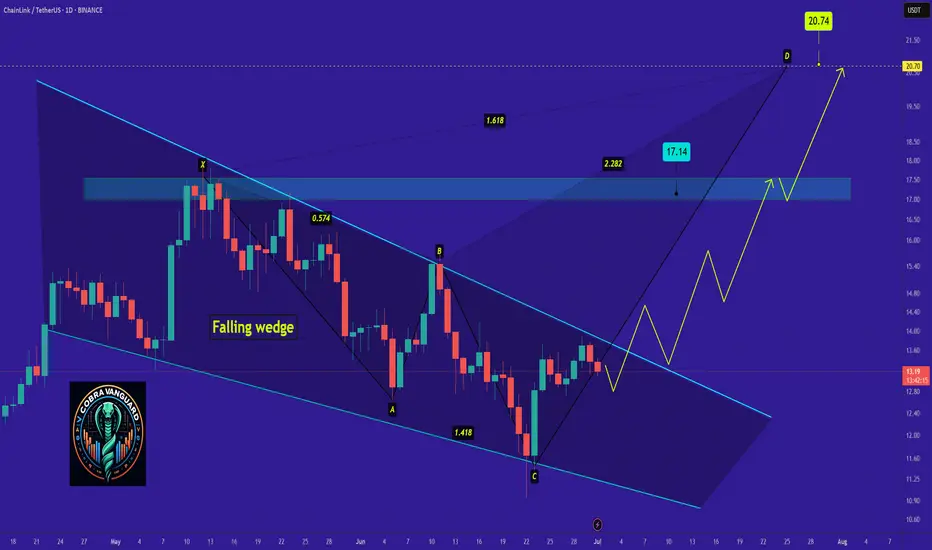
"LINK - Time to buy again!"So if you pay attention to the LINK chart you can see that the price has formed a Ascending wedge which means it is expected to price move as equal as the measured price movement.( AB=CD )
NOTE: wait for break of the WEDGE .
Best regards CobraVanguard.💚
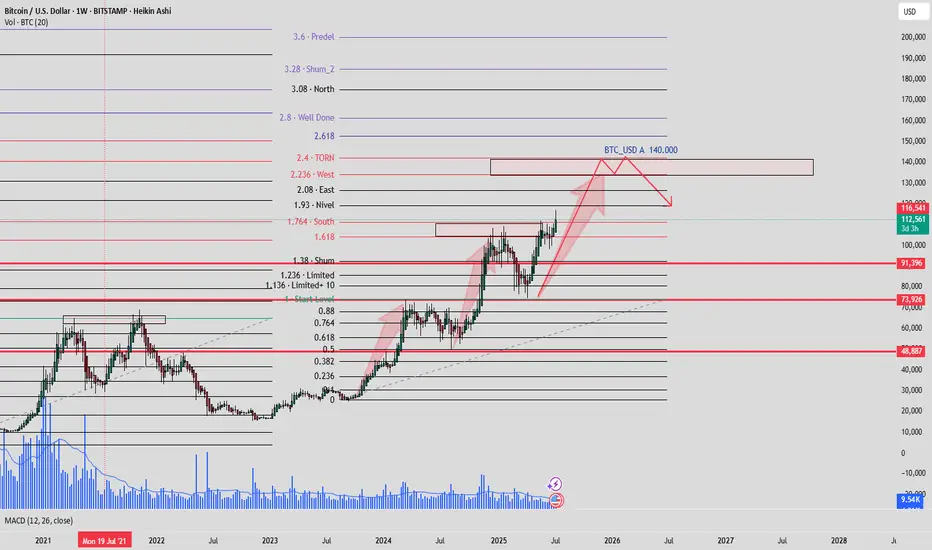
#BTC ALMAZOV PROJECTION#BTCUSD ALMAZOV PROJECTION WEEKLY
Price projection according to Almazov's theory, Bitcoin should at least touch $140,000, before pulling back or continuing to go long if its dimensionality decreases.
ETHER PERFECT SELL FROM $2780 ,Targeting $2610 or Below ETHER PERFECT SELL FROM $2780
Targeting $2610 or Below
Next level to consider for targets $2580-70 (According to market situation)
Not a Financial advice

PENGU SHORT UPDATE Added more Shorts from $0.017000 (Dump time PENGU SHORT UPDATE
Added more shorts from $0.017000
Expecting huge drop soon
Dumping time soon
Target $0.012600 0r Down
Not a Financial advice

PENGU SHORT UPDATE ,Anything above $0.015 is a Perfect shortPENGU SHORT UPDATE
Anything above $0.015
is a Perfect short
Targeting $0.012500 or Down
Not a Financial advice

PENGU SELL SETUP ,Sold From $0.013500PENGU SELL SETUP
Currently $0.013600
Sold From $0.013500
(Trading plan If PENGU go up to $0.014600
will add more shorts)
Expecting target $0.012050 OR DOWN
In the event of an early exit,
this analysis will be updated.
Its not a Financial advice


Is Pepe growing? Read the caption, it's important.Hello friends🙌
✔Some factors caused the price to fall, but in a support area that we have drawn for you with several Fibonacci waves, you can see that a classic double bottom pattern has been formed and buyers have entered.
🔊Now there is no more news of a fall and buyers have raised the price to the point where it has created a higher ceiling and floor, and this is very important and signals a change in trend.
📈Now that the price has broken the specified resistance line and is well supported by the specified support line, we can expect the price to move to the specified areas, but do not forget that the most important thing to observe in trading is capital management⚠
🔥Follow us for more signals🔥
*Trade safely with us*

CAKE : Are we left behind?Hello friends🙌
😉We came with a good currency analysis from the decentralized exchange Pancake Swap.
So you see that we have a good price support that buyers supported the price well after each collision.
🔊Now, considering the collision with this support, we can expect growth to the specified areas. Of course, don't forget that capital management and risk are the priority of trading.
🔥Follow us for more signals🔥
*Trade safely with us*

TRUMP BUY ???Hello friends🙌
🔊As you can see in the picture, we have brought you two Trump charts:
1_TRUMP/USDT, in which we see an upward trend.
2_TRUMP/BTC, in which we see a downward trend.
✔Now what is the conclusion? When this negative divergence occurs, it means that money flows from Bit to Tether, and we can expect good growth from it to the specified targets, given the price reaching important support and its return📈
🔥Join us for more signals🔥
Trade safely with us.

BTCUSDT - going to 113866.19$My analysis is based on numerology, all the numbers you see on the chart are from the same place. There is a certain numerological symbolism, which tells me that the price has already put the bottom 49(13) and will make a reversal from the zone 52260+- and then will fly strongly upwards with the target first 89k bucks, and after 113k. It's time to look for a good entry point.

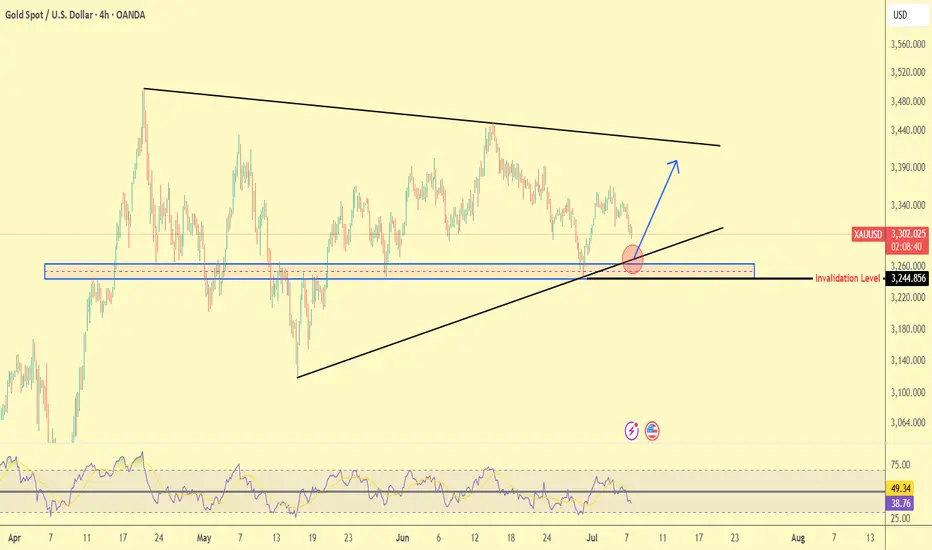
Gold Trade plan 07/07/2025Dear Trader,
✅ Symbol: Gold vs. US Dollar (XAUUSD)
✅ Timeframe: 4H
✅ Date: July 7, 2025
✅ Technical Overview:
🔹 Price is forming a Symmetrical Triangle pattern.
🔹 A key support zone lies between $3245–3260, marked by the blue area.
🔹 Price has bounced from this zone and the ascending trendline (black), as shown by the red circle.
🔹 Main scenario: A potential bullish bounce toward the upper triangle resistance or even breakout (blue arrow).
🔻 Invalidation Level: $3,244.85
If this level breaks to the downside, the bullish setup will be invalidated, with possible targets at $3200 and $3100.
📉 RSI is currently between 38 and 49, not oversold yet, but near dynamic support.
✍️ Conclusion:
Holding above the current support area could trigger an upward move.
A break below $3245 would likely lead to further downside.
The current price area offers a favorable risk-reward for bullish positions.
Regards,
Alireza!
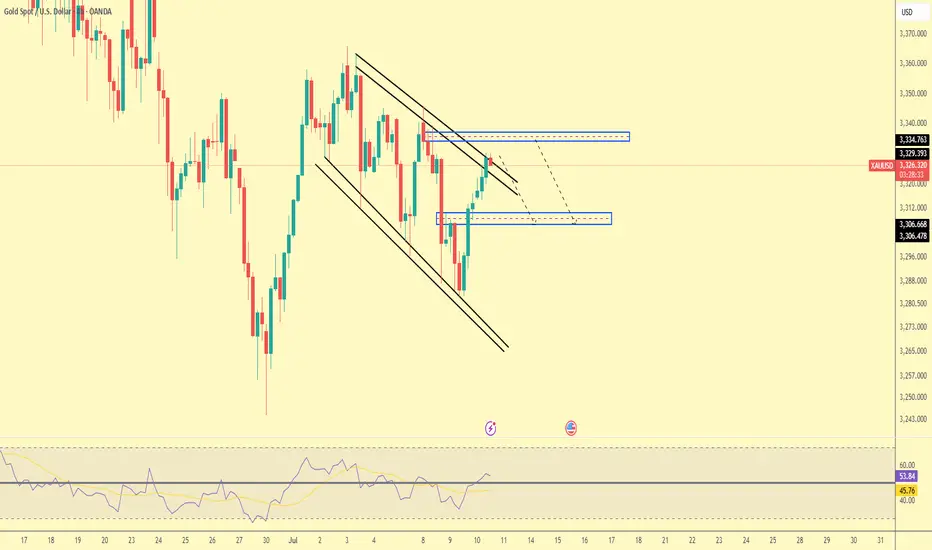
Gold Trade Plan 10/07/2025Dear Traders,
Technical Analysis of XAUUSD (Gold vs USD) – July 10, 2025
Price has recently broken out of a falling channel (black lines) and is now testing a key resistance zone (marked in blue):
Resistance Zone: 3329 to 3334 – price is reacting to this area, and it might reverse downward.
Support Zone: 3306 – if price declines, this is a potential target.
📉 Possible Scenario:
If price gets rejected from 3329–3334, it may head back down toward the 3306 support zone.
If price breaks and holds above 3334, the bullish trend could continue.
📊 The RSI is around 54, in neutral territory. No major divergence is seen, but the move out of oversold territory suggests growing buyer strength.
Regards,
Alireza!
Beware of bottoming out!Gold short-term analysis; The recent fluctuations of 1-200 US dollars have greatly increased the difficulty of trading for retail investors. It seems that there are many opportunities in a day, but in fact, the big market mainly appears in a few times. If you can't keep up in time, you can only watch the price jump up and down. The most feared thing is not to keep up with the market, but the price returns to the same point, but the principal is gradually reduced.
The gold four-hour line starts to exert force from above the moving average, directly breaks through the support line, and the big negative line directly crushes it. The moving average has a clear downward turn, and the bulls' dream is directly shattered. At present, the big negative line continues to explore, and the high point is also constantly falling. It is also an obvious head and shoulders top pattern. The upper resistance levels are 3330 and 3345, which are also the positions for short entry.

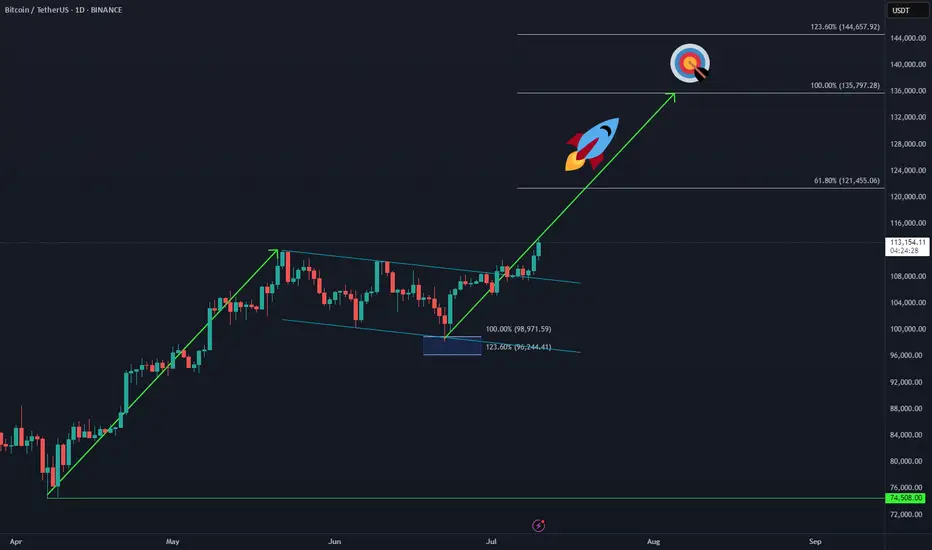
Bitcoin Makes New ATH – Next Sequence in Play 🚀 CRYPTO:BTCUSD has officially broken into new all-time highs, confirming the next bullish sequence is underway.
The upside projection now opens toward the $135K–$144K zone, aligning with long-term Fibonacci extensions and cycle projections.
📌 As always, it won’t be a straight line—expect step-by-step progress, with consolidations and pullbacks along the way. But the structure remains bullish, and the path is unfolding.
Ethereum Breakout Is Imminent!🚀 CRYPTO:ETHUSD is approaching the June peak, and a breakout would confirm a bullish sequence in play.
Upside targets are set at $3,600 – $3,960, aligning with key Fibonacci levels and challenging the 2024 highs.

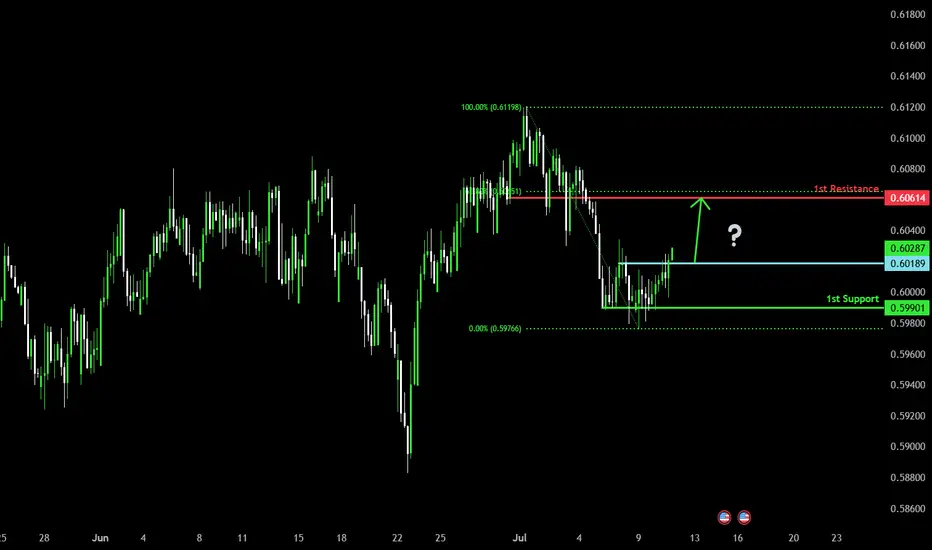
Potential bullish rise?The Kiwi (NZD/USD) is reacting off the pivot and could rise from this level to the 1st resistance.
Pivot: 0.6018
1st Support: 0.5990
1st Resistance: 0.6061
Risk Warning:
Trading Forex and CFDs carries a high level of risk to your capital and you should only trade with money you can afford to lose. Trading Forex and CFDs may not be suitable for all investors, so please ensure that you fully understand the risks involved and seek independent advice if necessary.
Disclaimer:
The above opinions given constitute general market commentary, and do not constitute the opinion or advice of IC Markets or any form of personal or investment advice.
Any opinions, news, research, analyses, prices, other information, or links to third-party sites contained on this website are provided on an "as-is" basis, are intended only to be informative, is not an advice nor a recommendation, nor research, or a record of our trading prices, or an offer of, or solicitation for a transaction in any financial instrument and thus should not be treated as such. The information provided does not involve any specific investment objectives, financial situation and needs of any specific person who may receive it. Please be aware, that past performance is not a reliable indicator of future performance and/or results. Past Performance or Forward-looking scenarios based upon the reasonable beliefs of the third-party provider are not a guarantee of future performance. Actual results may differ materially from those anticipated in forward-looking or past performance statements. IC Markets makes no representation or warranty and assumes no liability as to the accuracy or completeness of the information provided, nor any loss arising from any investment based on a recommendation, forecast or any information supplied by any third-party.
Bullish reversal?The Cable (GBP/USD) has bounced off the pivot and could rise to the 38.2% Fibonacci resistance.
Pivot: 1.3529
1st Support: 1.3457
1st Resistance: 1.3633
Risk Warning:
Trading Forex and CFDs carries a high level of risk to your capital and you should only trade with money you can afford to lose. Trading Forex and CFDs may not be suitable for all investors, so please ensure that you fully understand the risks involved and seek independent advice if necessary.
Disclaimer:
The above opinions given constitute general market commentary, and do not constitute the opinion or advice of IC Markets or any form of personal or investment advice.
Any opinions, news, research, analyses, prices, other information, or links to third-party sites contained on this website are provided on an "as-is" basis, are intended only to be informative, is not an advice nor a recommendation, nor research, or a record of our trading prices, or an offer of, or solicitation for a transaction in any financial instrument and thus should not be treated as such. The information provided does not involve any specific investment objectives, financial situation and needs of any specific person who may receive it. Please be aware, that past performance is not a reliable indicator of future performance and/or results. Past Performance or Forward-looking scenarios based upon the reasonable beliefs of the third-party provider are not a guarantee of future performance. Actual results may differ materially from those anticipated in forward-looking or past performance statements. IC Markets makes no representation or warranty and assumes no liability as to the accuracy or completeness of the information provided, nor any loss arising from any investment based on a recommendation, forecast or any information supplied by any third-party.

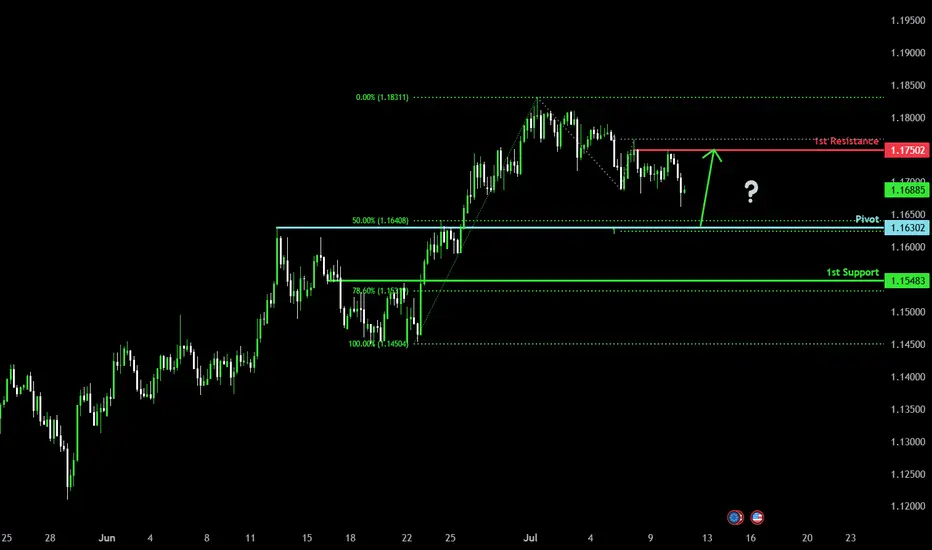
Bullish bounce off major support?EUR/ISD is falling towards the pivot which is a pullback support that lines up with the 50% Fibonacci retracement and could bounce to the 1st resistance,
Pivot: 1.1688
1st Support: 1.1548
1st Resistance: 1.1750
Risk Warning:
Trading Forex and CFDs carries a high level of risk to your capital and you should only trade with money you can afford to lose. Trading Forex and CFDs may not be suitable for all investors, so please ensure that you fully understand the risks involved and seek independent advice if necessary.
Disclaimer:
The above opinions given constitute general market commentary, and do not constitute the opinion or advice of IC Markets or any form of personal or investment advice.
Any opinions, news, research, analyses, prices, other information, or links to third-party sites contained on this website are provided on an "as-is" basis, are intended only to be informative, is not an advice nor a recommendation, nor research, or a record of our trading prices, or an offer of, or solicitation for a transaction in any financial instrument and thus should not be treated as such. The information provided does not involve any specific investment objectives, financial situation and needs of any specific person who may receive it. Please be aware, that past performance is not a reliable indicator of future performance and/or results. Past Performance or Forward-looking scenarios based upon the reasonable beliefs of the third-party provider are not a guarantee of future performance. Actual results may differ materially from those anticipated in forward-looking or past performance statements. IC Markets makes no representation or warranty and assumes no liability as to the accuracy or completeness of the information provided, nor any loss arising from any investment based on a recommendation, forecast or any information supplied by any third-party.
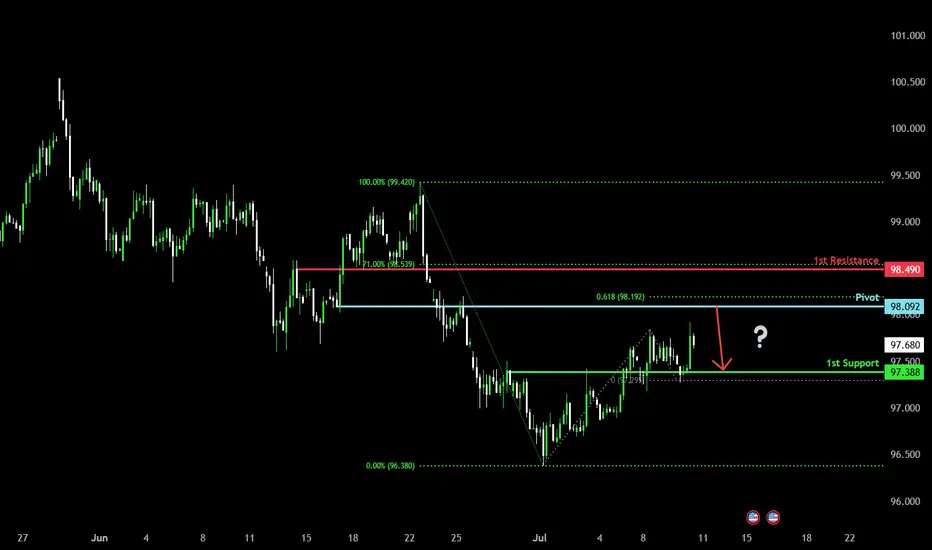
Could the price reverse from here?US Dollar Index (DXY) is rising towards the pivot and could reverse to the 1st support which acts as an overlap support.
Pivot: 98.09
1st Support: 97.38
1st Resistance: 98.49
Risk Warning:
Trading Forex and CFDs carries a high level of risk to your capital and you should only trade with money you can afford to lose. Trading Forex and CFDs may not be suitable for all investors, so please ensure that you fully understand the risks involved and seek independent advice if necessary.
Disclaimer:
The above opinions given constitute general market commentary, and do not constitute the opinion or advice of IC Markets or any form of personal or investment advice.
Any opinions, news, research, analyses, prices, other information, or links to third-party sites contained on this website are provided on an "as-is" basis, are intended only to be informative, is not an advice nor a recommendation, nor research, or a record of our trading prices, or an offer of, or solicitation for a transaction in any financial instrument and thus should not be treated as such. The information provided does not involve any specific investment objectives, financial situation and needs of any specific person who may receive it. Please be aware, that past performance is not a reliable indicator of future performance and/or results. Past Performance or Forward-looking scenarios based upon the reasonable beliefs of the third-party provider are not a guarantee of future performance. Actual results may differ materially from those anticipated in forward-looking or past performance statements. IC Markets makes no representation or warranty and assumes no liability as to the accuracy or completeness of the information provided, nor any loss arising from any investment based on a recommendation, forecast or any information supplied by any third-party.