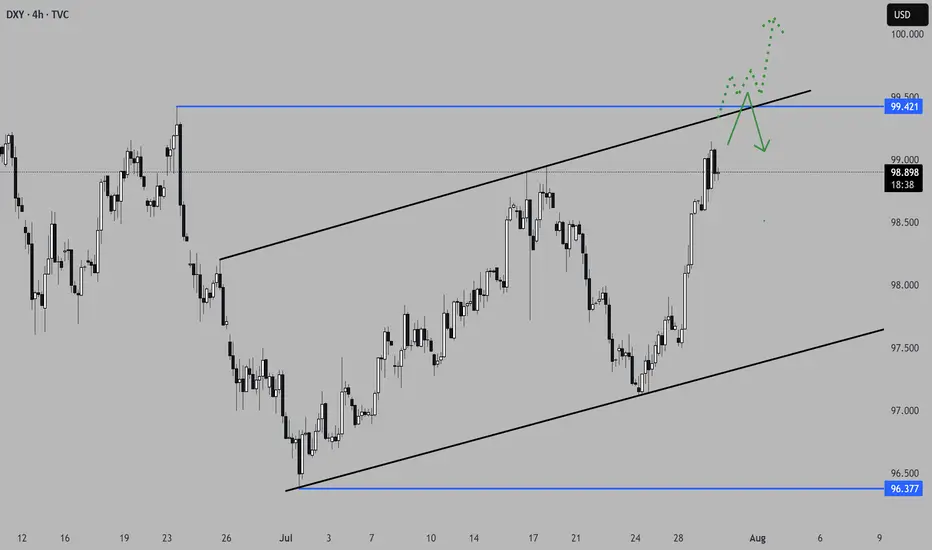
Interesting few days ahead... USD pairs approaching key levelsDXY is finishing a HTF consolidation and is approaching medium-term key areas. Other USD pairs are also in areas where they could aggressively turn around. EURUSD just finished a H4 3-touch continuation flag and is starting to stall on the 3rd touch, suggesting indecision in the markets.
Considering the news events in the next 3 days, starting today with USD advanced GDP data, we could see volatility kicking in on these key levels. We do need a catalyst to push price into a larger directional move, and we are prime positioned for the next leg. Technically, a breakout in both directions would make sense in these areas. Time to set alarms and be vigilant but not jump into trades too early, considering NFP on Friday as well.
*** **** ****
📈 Simplified Trading Rules:
> Follow a Valid Sequence
> Wait for Continuation
> Confirm Entry (valid candlestick pattern)
> Know When to Exit (SL placement)
Remember, technical analysis is subjective; develop your own approach. I use this format primarily to hold myself accountable and to share my personal market views.
The pairs I publish here are usually discussed in detail in my Weekly Forex Forecast (WFF) and are now showing further developments worth mentioning.
⚠ Ensure you have your own risk management in place and always stick to your trading plan.
*** **** ****
Harmonic Patterns
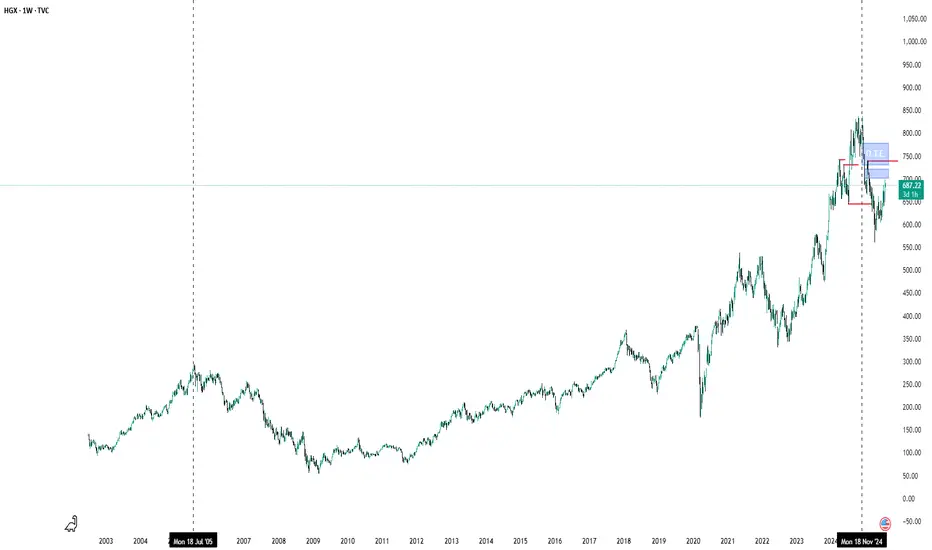
Housing Index, That There Look Identical Weak housing sector looking to return to Optimal trade Entry and then giving up the ghost.
AAVE 1H – Triple Tap Support + Bullish Divergence Incoming?AAVE is painting a compelling reversal setup on the 1H timeframe. After a sharp selloff last week, price has tapped the $278–282 demand zone multiple times — each time printing higher local lows on the Stochastic RSI and showing signs of exhaustion from sellers.
This zone has now been tested three separate times, forming what looks like a triple-bottom structure. During the latest retest, Stochastic RSI is deeply oversold and beginning to curl up — suggesting that momentum may shift in favor of the bulls soon.
We’re also approaching the apex of a descending trendline, meaning compression is reaching its limit. A clean break and reclaim above $290 could be the first real sign of trend reversal, with a potential target near the previous range highs around $335 if momentum follows through.
📊 Why This Setup Matters:
– Strong historical support zone with visible reactions
– Repeated seller failure to break the zone cleanly
– RSI bullish divergence building beneath structure
– Clear invalidation level below support
– Risk-reward skewed in favor of a bounce play
This isn’t confirmation yet — but it’s definitely a chart worth watching closely over the next session. If bulls step in with volume, this could catch momentum fast.

AUDUSD - BullishAUDUSD is Bullish on Fundamental Bias and Seasonal aslo support long position. Divergence can also be observed on RSI. Forming an Harmonic pattern so it looks like buyers are in a strong position

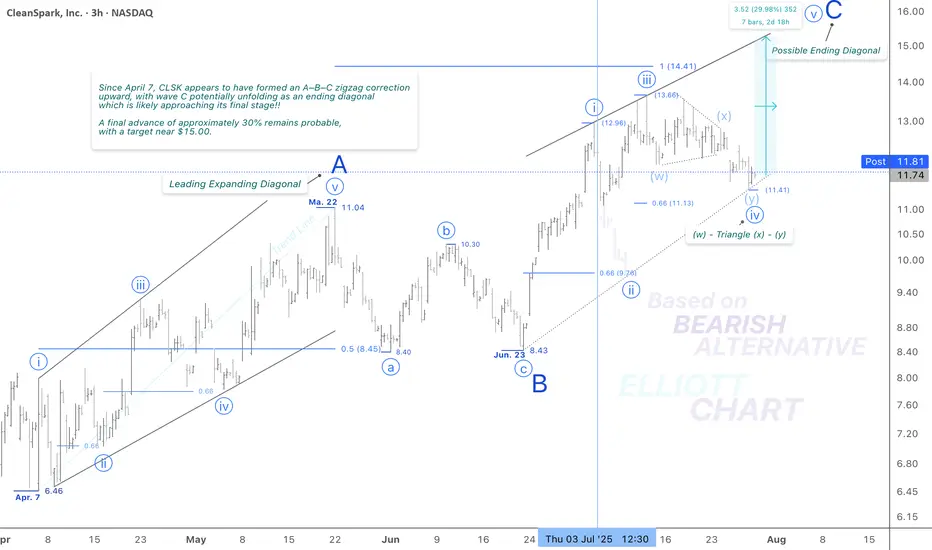
CLSK / 3hThe modest and unexpected 2.5% decline in NASDAQ:CLSK today suggests a potential shift in the wave iv (circled) corrective structure—from the previously identified to a more complex combination.
This adjustment still fits within the context of the ending diagonal pattern in Minor wave C and reflects a deeper, yet corrective, move down. The overall outlook and wave structure remain unchanged.
Wave Analysis >> As illustrated in the 3h-frame above, Minor wave C—completing the corrective upward move of wave (B)—appears to be unfolding as an ending diagonal, now likely in its final stages. Within this structure, the Minute wave iv (circled) has formed a correction. A final push higher in Minute wave v (circled) is now expected, which would complete the ending diagonal pattern of wave C, and in turn, conclude the countertrend advance of wave (B).
Trend Analysis >> Upon completion of the potential ending diagonal in Minor wave C, the broader trend is anticipated to reverse to the downside, initiating the final decline in Intermediate wave (C). This bearish phase may extend through the remainder of the year.
#CryptoStocks #CLSK #BTCMining #Bitcoin #BTC
NASDAQ:CLSK CRYPTOCAP:BTC BITSTAMP:BTCUSD MARKETSCOM:BITCOIN
XRP should be PumpedXRP pullback is ending. If the price does not break above $3, growth is likely go to 4$.

AUD/JPY Poised for Breakout After Liquidity Trap? 🔍 Key Observations:
🔻 Trendline resistance holding strong, forming lower highs.
📉 Sell-side liquidity resting just below horizontal support (marked zone).
💧 Price dipped into liquidity grab zone twice — sign of stop hunt.
🔁 Classic accumulation schematic forming — repeated sweeps before potential breakout.
📊 Volume divergence: Selling pressure weakening while liquidity is swept.
📉 RSI shows bullish divergence (price making lower lows, RSI making higher lows).
🔁 Rejection at RSI 40-level could indicate a bounce.
📈 Expectation:
One more fake breakdown below 96.500 could trigger aggressive buying — setting up a potential parabolic move toward 97.200+ if breakout occurs.

ALT-COINS MOST IMPORTANT CHART -2027-2028Hi
Not many charts out there about watch the total3 versus bitcoin
but this chart had signaled the last 2021 boom for altcoins
this could happen again into the following years to come
this is a long ride
for the patient
and the active trader or investor manager
yes retail at some point will be very small comparing to institutional smart money inflows
into some top 100 altcoins from 2030-2040
but
we don t know for now what altcoins will perform long term
we may guess the winners more than the losers hopefully
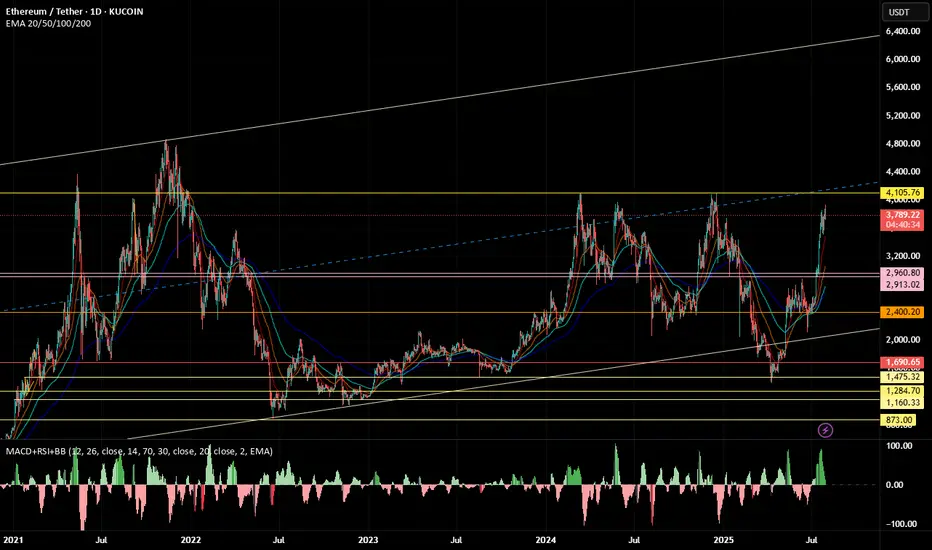
the first sign would be ETH outperforming BTC
i may update this chart in the next 6mo- to see the reversal signal -into the bullmarket
territory possible sooner than later could be q42025 or early 2026
i anticipate a cycle peak around mid 2027 thro early 2028
also a prolonged cycle could emerge and take us thro 2031
each of the fib target on this chart may experience a bigger or lager pullback
that is why a win win could be to sell something on each target and DCA back into alts later
smart money may also rotate from traditional market like Sp500 and from safe heaven assets risk off into more volatile beta assets with risk on tags. as long as they dont break ATHs again

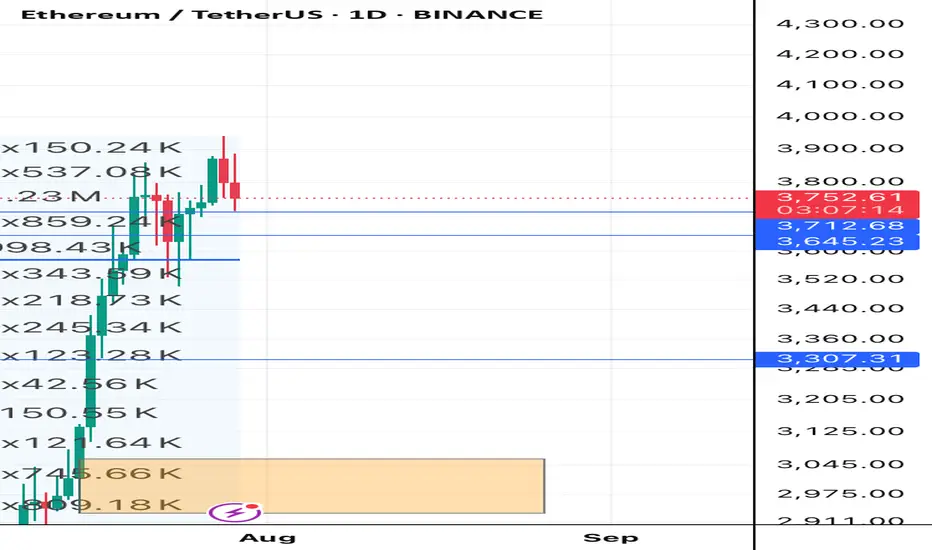
eth buyI think Ethereum is ready for a historic bull run, it has collected almost all the lower stops and has done everything right in terms of the right trend pattern. But from a fundamental perspective, with the arrival of President Trump and the launch of Ethereum ETFs, we can see a historic growth for Ethereum from a fundamental perspective, but we have to wait for the right pattern for the entry point. I will specify a few ranges for you, and my expectation is that Ethereum will be at $20,000.

Lord Jesus Christ, Son of God, have mercy on us sinnersare you ready... ?
In the name of the Father, and of the Son, and of the Holy Spirit. Amen.
Glory to Thee, our God, glory to Thee.
O Heavenly King, O Comforter, the Spirit of Truth, who art in all places and fillest all things; Treasury of good things and Giver of life, come and dwell in us and cleanse us from every stain, and save our souls, O gracious Lord.
Holy God, Holy Mighty, Holy Immortal, have mercy on us.
Glory to the Father, and to the Son, and to the Holy Spirit: now and ever and unto ages of ages. Amen.
All-holy Trinity, have mercy on us. Lord, cleanse us from our sins. Master, pardon our iniquities. Holy God, visit and heal our infirmities for Thy name's sake.
Lord, have mercy.
Glory to the Father, and to the Son, and to the Holy Spirit: now and ever and unto ages of ages. Amen.
Our Father, who art in the heavens, hallowed be Thy name: Thy kingdom come; Thy will be done on earth, as it is in heaven. Give us this day our daily bread; and forgive us our trespasses, as we forgive those who trespass against us; and lead us not into temptation, but deliver us from the evil one.
For Thine is the kingdom, and the power, and the glory, of the Father, and of the Son, and of the Holy Spirit: now and ever and unto ages of ages. Amen.
In one, holy, catholic, and apostolic Church

ethereumI think Ethereum is ready for a historic bull run, it has collected almost all the lower stops and has done everything right in terms of the right trend pattern. But from a fundamental perspective, with the arrival of President Trump and the launch of Ethereum ETFs, we can see a historic growth for Ethereum from a fundamental perspective, but we have to wait for the right pattern for the entry point. I will specify a few ranges for you, and my expectation is that Ethereum will be at $20,000.
Sell Analysis – 30M Smart Money Concept Sell Analysis – 30M Smart Money Concept
📊 Chart Context:
Timeframe: 30M
Market: Gold (XAUUSD)
Bias: Bearish – Scalp Sell
---
🔍 Key Observations:
Premium Zone Rejection:
Price tapped into a premium supply zone formed after a clear break of structure (BoS) to the downside. This confirms seller dominance at higher pricing levels.
FVG (Fair Value Gap) Fill:
The price filled a previous FVG imbalance and showed rejection without closing above the origin of the impulse. This shows liquidity grab behavior typical in smart money moves.
Bearish Order Block Confirmation:
A bearish OB was respected and reacted to. The latest candle shows strong rejection with a long upper wick and volume tapering — an early confirmation of potential entry trigger for scalp short.
---
🧨 Entry Strategy (Scalp Sell):
Entry Zone:
Inside the reaction to the OB and FVG (just below the premium zone)
✅ 3325 ~3330
Stop Loss:
Just above the last high or FVG origin
✅ 3340
Take Profit:
TP1: Towards the equilibrium of the recent impulse leg
✅ 3300
TP2: Below the discount zone, targeting liquidity under recent lows
✅ 3280
---
⚠️ Risk Note:
This is a scalping setup, not a swing trade. Higher timeframes still show mixed signals, so risk management is key. Avoid over-leveraging.
---
🏁 Summary:
> A high-probability scalp sell setup confirmed by smart money concepts: BOS → FVG Fill → OB Rejection → Liquidity Grab → Bearish Continuation.

ETH to $6500?Have had this chart created for a while since before 2020, now loading it back up looks like everything is going as planned. ETH has to reach its ATH again around 4800 then it shoots to prices discovery, it will forsure run through 5000$ so $6500 becomes a target afterwards.
Key Resistance ZoneMarked near 1.15800, just below the upper boundary of the channel.
A red arrow and label indicate this as a potential sell zone.
Price is expected to retest this area before dropping again.
Projected Move (Bearish):
Price may:
1. Push up into the resistance zone.
2. Reject strongly and fall back.
3. Continue downward with minor pullbacks, following the blue arrows.

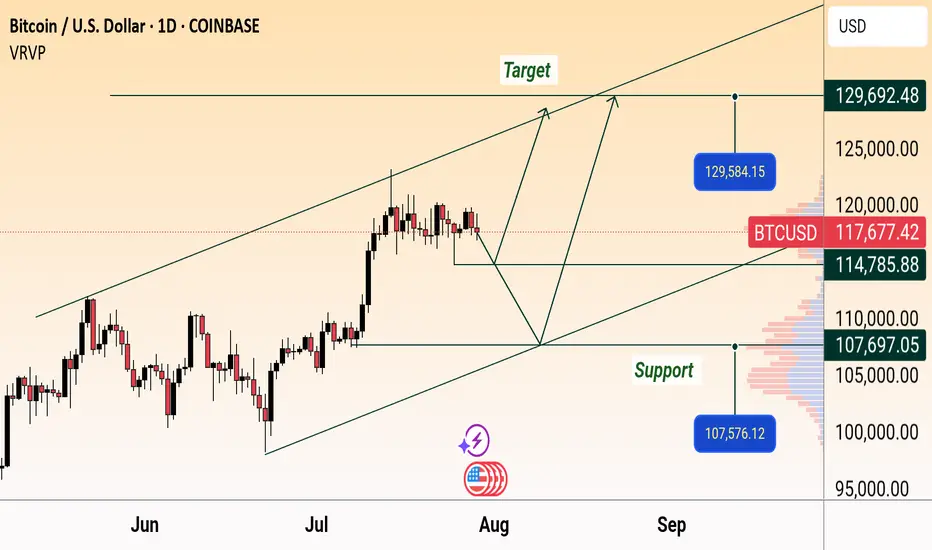
BTC/USD Daily Outlook: Support & Target Levels IdentifiedBitcoin (BTC/USD) Daily Chart Analysis:
Price is currently at $117,758.70, showing a slight decline. Key support levels are marked at $114,785.88 and $107,576.12, while targets are projected near $129,584.15 and $129,692.48. Chart suggests a possible upward channel, with both bullish and bearish scenarios mapped.
SPX Listed on Binance - 3$ Very SoonBinance to begin deposits of SPX tomorrow June 19, expect movement, this will be the #1 Memecoin this cycle! The following is too strong, all holders believe in something. I don’t see how it doesn’t touch $50-$100 this cycle

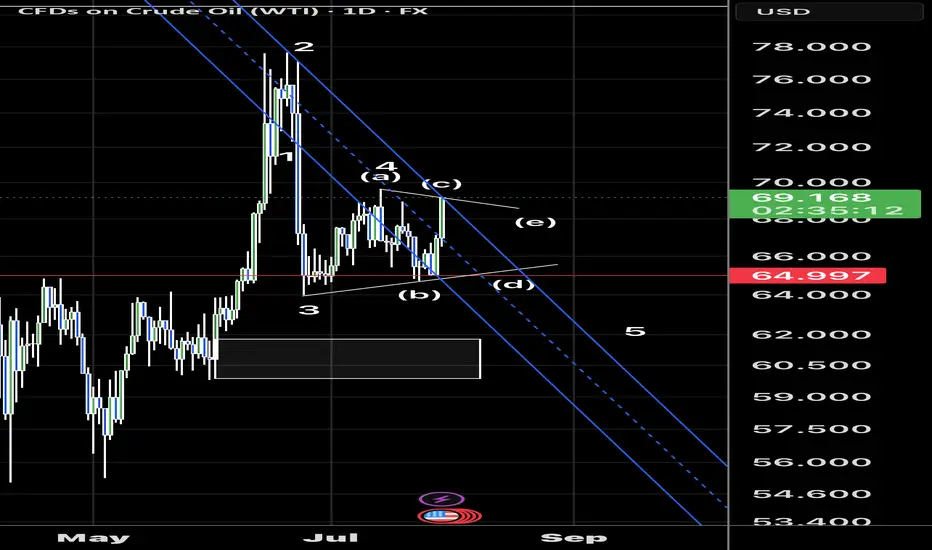
After 35 daysOil finally broke out of the range after 35 days, and now it’s time to wait for a trigger to enter and follow the trend.

SPX6900 to $3.30 NextSPX has been leading the path of the memcoin supercycle which in fact didnt even begin yet, yes we are 4x already from 2 months ago but this coin with the constant push by Murad and other personalities this has the potential to 50x from here. $3.30 should be easily hit

Gold Eyes Rebound Toward $3,438 TargetGold (XAU/USD) is trading near $3,314, approaching support along the rising trend line. A potential bounce could target the $3,438 resistance area, as marked in the chart.

Crude hit the c wave finish of a triangle ? Crude finishing up the c wave of a triangle? Let’s see if we turn this lower in a d wave of a possible 4th wave triangle
SEI : The best future belongs to this coin.Hello friends🙌
Given the rapid growth that this coin has had and I think it will continue, now that the price is correcting, there is a good opportunity to buy in stages with risk and capital management and move with it to the specified goals.
🔥Follow us for more signals🔥
*Trade safely with us*

Potential bearish drop?The Aussie (AUD/USD) is rising toward the resistance level, which is a pullback resistance that is slightly above the 23.6% Fibonacci retracement and could reverse from this level to our take profit.
Entry: 0.6532
Why we like it:
There is a pullback resistance that is slightly above the 23.6% Fibonacci retracement.
Stop loss: 0.6580
Why we like it:
There is a pullback resistance that is slightly above the 61.8% Fibonacci retracement.
Take profit: 0.6467
Why we like it:
There is a swing low support.
Enjoying your TradingView experience? Review us!
TradingView (www.tradingview.com)
Please be advised that the information presented on TradingView is provided to Vantage (‘Vantage Global Limited’, ‘we’) by a third-party provider (‘Everest Fortune Group’). Please be reminded that you are solely responsible for the trading decisions on your account. There is a very high degree of risk involved in trading. Any information and/or content is intended entirely for research, educational and informational purposes only and does not constitute investment or consultation advice or investment strategy. The information is not tailored to the investment needs of any specific person and therefore does not involve a consideration of any of the investment objectives, financial situation or needs of any viewer that may receive it. Kindly also note that past performance is not a reliable indicator of future results. Actual results may differ materially from those anticipated in forward-looking or past performance statements. We assume no liability as to the accuracy or completeness of any of the information and/or content provided herein and the Company cannot be held responsible for any omission, mistake nor for any loss or damage including without limitation to any loss of profit which may arise from reliance on any information supplied by Everest Fortune Group.

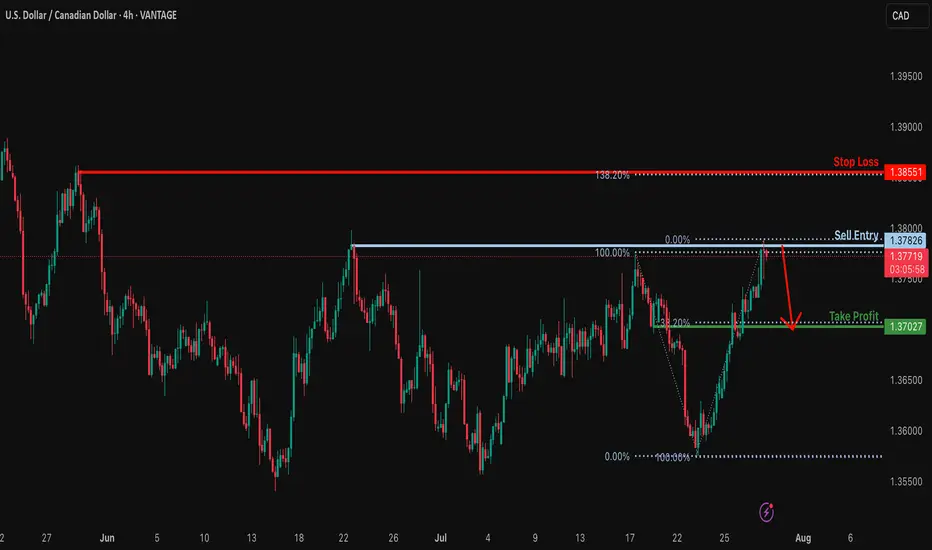
Bearish reversal off multi swing high resistance?USD/CAD is reacting off the resistance level, which is a multi-swing high resistance and could drop from this level to our take profit.
Entry: 1.3782
Why we like it:
There is a multi-swing high resistance.
Stop loss: 1.3855
Why we like it:
There is a swing high resistance that lines up with the 138.2% Fibonacci extension.
Take profit: 1.3702
Why we like it:
There is a pullback support that aligns with the 48.2% Fibonacci retracement.
Enjoying your TradingView experience? Review us!
TradingView (www.tradingview.com)
Please be advised that the information presented on TradingView is provided to Vantage (‘Vantage Global Limited’, ‘we’) by a third-party provider (‘Everest Fortune Group’). Please be reminded that you are solely responsible for the trading decisions on your account. There is a very high degree of risk involved in trading. Any information and/or content is intended entirely for research, educational and informational purposes only and does not constitute investment or consultation advice or investment strategy. The information is not tailored to the investment needs of any specific person and therefore does not involve a consideration of any of the investment objectives, financial situation or needs of any viewer that may receive it. Kindly also note that past performance is not a reliable indicator of future results. Actual results may differ materially from those anticipated in forward-looking or past performance statements. We assume no liability as to the accuracy or completeness of any of the information and/or content provided herein and the Company cannot be held responsible for any omission, mistake nor for any loss or damage including without limitation to any loss of profit which may arise from reliance on any information supplied by Everest Fortune Group.