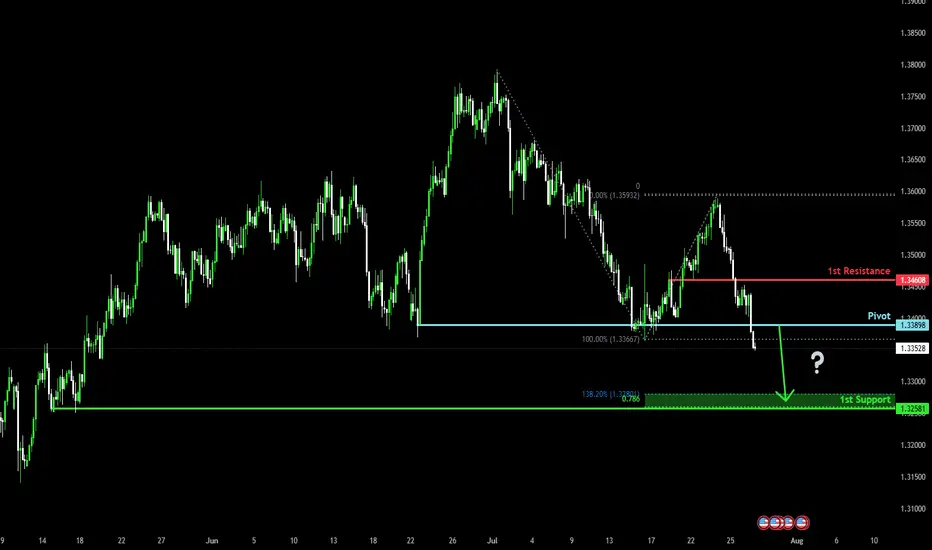
Potential bearish drop?The Cable (GBP/USD) has broken below the support level, which is a multi-swing low support. A potential pullback to the pivot, followed by a rejection, could lead the price to drop to the 1st support.
Pivot: 1.3389
1st Support: 1.3258
1st Resistance: 1.3460
Risk Warning:
Trading Forex and CFDs carries a high level of risk to your capital and you should only trade with money you can afford to lose. Trading Forex and CFDs may not be suitable for all investors, so please ensure that you fully understand the risks involved and seek independent advice if necessary.
Disclaimer:
The above opinions given constitute general market commentary, and do not constitute the opinion or advice of IC Markets or any form of personal or investment advice.
Any opinions, news, research, analyses, prices, other information, or links to third-party sites contained on this website are provided on an "as-is" basis, are intended only to be informative, is not an advice nor a recommendation, nor research, or a record of our trading prices, or an offer of, or solicitation for a transaction in any financial instrument and thus should not be treated as such. The information provided does not involve any specific investment objectives, financial situation and needs of any specific person who may receive it. Please be aware, that past performance is not a reliable indicator of future performance and/or results. Past Performance or Forward-looking scenarios based upon the reasonable beliefs of the third-party provider are not a guarantee of future performance. Actual results may differ materially from those anticipated in forward-looking or past performance statements. IC Markets makes no representation or warranty and assumes no liability as to the accuracy or completeness of the information provided, nor any loss arising from any investment based on a recommendation, forecast or any information supplied by any third-party.
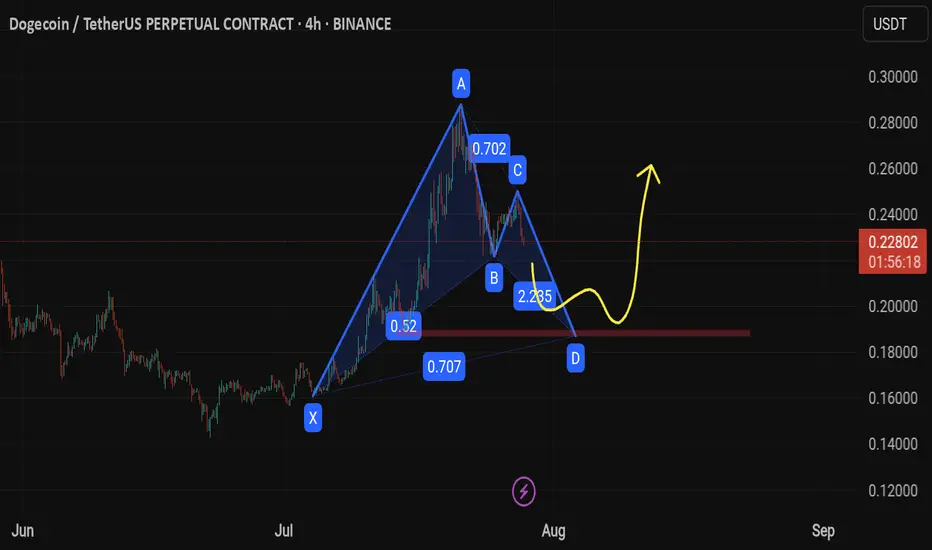
Harmonic Patterns
EURAUD THE CURRENT PRICEACTION OF EURAUD IS WATCHED.
EU10Y=2.689%
ECB RATE 2.0%
AU10Y= 4.348%
RBA RATE =3.85%
RATE AND BOND YIELD DIFFERENTIAL FAVOR AUD .
The recent fluctuations in the EUR/AUD exchange rate are primarily driven by factors including:
Monetary Policy and Interest Rate Differentials:
Decisions and outlooks from the European Central Bank (ECB) and the Reserve Bank of Australia (RBA) strongly impact EUR/AUD. Hawkish (tightening) or dovish (easing) policy stances influence demand for each currency, affecting the exchange rate. For example, higher interest rates or hawkish tones usually strengthen a currency, while easing weakens it. Differences in inflation rates and inflation expectations also play a part, as central banks adjust rates accordingly.
Economic Indicators and Growth Outlooks:
Economic performance disparities between the Eurozone and Australia—such as GDP growth, trade balances, and industrial versus commodity exports—drive currency strength or weakness. The Eurozone’s economy is more industrial and technological, while Australia's economy is strongly commodity-driven, especially by prices of iron ore and gold. Changes in global commodity prices or demand can cause the AUD to fluctuate vs the EUR.
Commodity Prices, Especially Gold:
Since Australia is a major gold producer, AUD tends to correlate positively with gold prices. Rising gold prices support AUD strength, which may lower EUR/AUD rates, and vice versa.
Global Risk Sentiment and Geopolitical Events:
Global market sentiment—whether investors seek risk or safe-haven assets—affects both currencies. The Euro and AUD react differently to geopolitical developments and trade tensions. For instance, increased risk appetite can strengthen AUD vs EUR and vice versa depending on circumstances.
In summary, the recent EUR/AUD fluctuations reflect the interplay of ECB and RBA policies, divergent economic data between Europe and Australia, commodity price movements (notably gold), and shifting global risk sentiment.
This explains why EUR/AUD rates move as they do: when the Eurozone outlook improves or ECB signals tightening while Australian commodity prices weaken or RBA signals easing, EUR tends to strengthen against AUD, and the pair rises. Conversely, stronger Australian growth, rising commodity prices, or hawkish RBA moves can push the pair lower.
#EURAUD

Bullish bounce off pullback support?The Fiber (EUR/USD) is falling towards the pivot, which is a pullback support and could bounce to the 1st resistance.
Pivot: 1.1537
1st Support: 1.1456
1st Resistance: 1.1655
Risk Warning:
Trading Forex and CFDs carries a high level of risk to your capital and you should only trade with money you can afford to lose. Trading Forex and CFDs may not be suitable for all investors, so please ensure that you fully understand the risks involved and seek independent advice if necessary.
Disclaimer:
The above opinions given constitute general market commentary, and do not constitute the opinion or advice of IC Markets or any form of personal or investment advice.
Any opinions, news, research, analyses, prices, other information, or links to third-party sites contained on this website are provided on an "as-is" basis, are intended only to be informative, is not an advice nor a recommendation, nor research, or a record of our trading prices, or an offer of, or solicitation for a transaction in any financial instrument and thus should not be treated as such. The information provided does not involve any specific investment objectives, financial situation and needs of any specific person who may receive it. Please be aware, that past performance is not a reliable indicator of future performance and/or results. Past Performance or Forward-looking scenarios based upon the reasonable beliefs of the third-party provider are not a guarantee of future performance. Actual results may differ materially from those anticipated in forward-looking or past performance statements. IC Markets makes no representation or warranty and assumes no liability as to the accuracy or completeness of the information provided, nor any loss arising from any investment based on a recommendation, forecast or any information supplied by any third-party.

Bullish bounce off swing low support?The Bitcoin (BTC/USD) is falling towards the pivot and could bounce to the 1st resistance.
Pivot: 115,415.51
1st Support: 113,466.96
1st Resistance: 120,573.43
Risk Warning:
Trading Forex and CFDs carries a high level of risk to your capital and you should only trade with money you can afford to lose. Trading Forex and CFDs may not be suitable for all investors, so please ensure that you fully understand the risks involved and seek independent advice if necessary.
Disclaimer:
The above opinions given constitute general market commentary, and do not constitute the opinion or advice of IC Markets or any form of personal or investment advice.
Any opinions, news, research, analyses, prices, other information, or links to third-party sites contained on this website are provided on an "as-is" basis, are intended only to be informative, is not an advice nor a recommendation, nor research, or a record of our trading prices, or an offer of, or solicitation for a transaction in any financial instrument and thus should not be treated as such. The information provided does not involve any specific investment objectives, financial situation and needs of any specific person who may receive it. Please be aware, that past performance is not a reliable indicator of future performance and/or results. Past Performance or Forward-looking scenarios based upon the reasonable beliefs of the third-party provider are not a guarantee of future performance. Actual results may differ materially from those anticipated in forward-looking or past performance statements. IC Markets makes no representation or warranty and assumes no liability as to the accuracy or completeness of the information provided, nor any loss arising from any investment based on a recommendation, forecast or any information supplied by any third-party.

WULF / 3hNASDAQ:WULF traded sideways today, as expected, with no significant change to the broader outlook. The ongoing consolidation continues to support the current wave structure—specifically, a developing triangle in wave iv (circled), which may be forming ahead of the anticipated final advance in wave v (circled).
The Fibonacci extension target >> 6.93 remains valid.
Trend Analysis >> Upon completion of Minor degree wave C, the countertrend advance of Intermediate degree wave (B), which has been unfolding since April 9, is likely to give way to a decline in wave (C) of the same degree. This downtrend might begin in the coming days and potentially extend through the end of the year!!
NASDAQ:WULF CRYPTOCAP:BTC BITSTAMP:BTCUSD MARKETSCOM:BITCOIN
#CryptoStocks #WULF #BTCMining #Bitcoin #BTC

CLSK / 3hNASDAQ:CLSK has been trading with a slight upward bias ahead of a potentially final advance, projected to gain approximately 25% with a target near $15.00.
Wave Analysis >> As illustrated in the 3h-frame above, Minor wave C—completing the corrective upward move of wave (B)—appears to be unfolding as an ending diagonal, now likely in its final stages. Within this structure, the Minute wave iv (circled) has formed a correction. A final push higher in Minute wave v (circled) is now expected, which would complete the ending diagonal pattern of wave C, and in turn, conclude the countertrend advance of wave (B).
Trend Analysis >> Upon completion of the potential ending diagonal in Minor wave C, the broader trend is anticipated to reverse to the downside, initiating the final decline in Intermediate wave (C). This bearish phase may extend through the remainder of the year.
#CryptoStocks #CLSK #BTCMining #Bitcoin #BTC
NASDAQ:CLSK CRYPTOCAP:BTC BITSTAMP:BTCUSD MARKETSCOM:BITCOIN

Bullausdt.pThe price is respecting the trendline. As soon we break it down and see some bearish candles lets short this coin..
The 50% which means the first TP and the last box Tp2. Always book some profit at 50% of the tp. And bring s.l to the entry..
Lets wait to enter in. The last candle is a bearish engulfing candle but for confirmation we need the price to close and retest the trendline from down.
DYOR

GOLD BUY In the XAU/USD 2025 Forecast, FXStreet analyst Eren Sengezer suggests Gold’s 2025 outlook depends on Federal Reserve (Fed) policy, Donald Trump’s decisions and geopolitics. A bearish scenario could unfold if geopolitical tensions ease, inflation remains persistent and United States-China trade tensions weaken China’s economy, reducing Gold demand. A hawkish Fed could also pressure prices.
On the bullish side, continued global policy easing, a recovering Chinese economy or escalating geopolitical conflicts could boost safe-haven flows into Gold, supporting its resilience and pushing prices higher.
Gold's technical outlook suggests weakening bullish momentum, with the RSI at its lowest since February and XAU/USD. Key support lies at $2,530-$2,500, with further declines potentially targeting $2,400 and $2,300. On the upside, resistance at $2,900 could limit gains, with additional barriers at $3,000-$3,020 and $3,130 if Gold attempts a new record high.
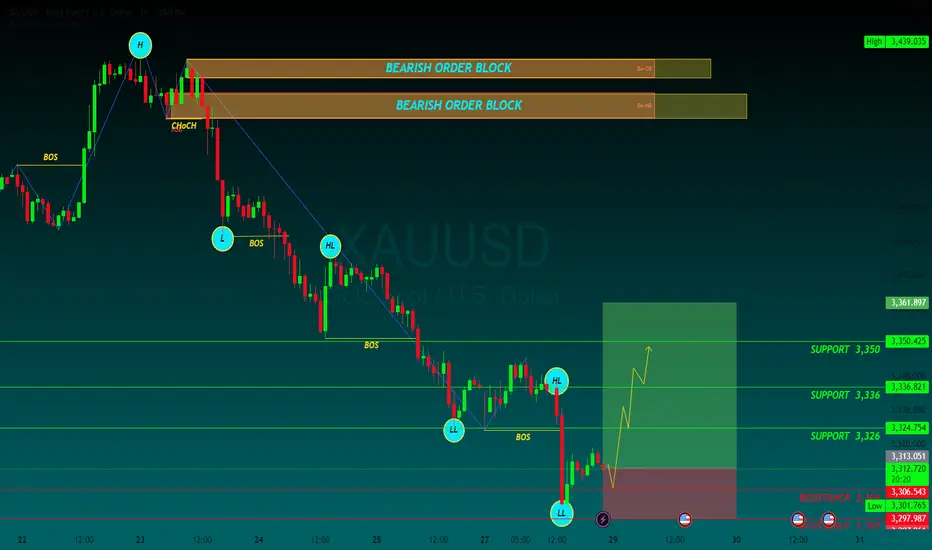
SUPPORT 3,326
SUPPORT 3,336
SUPPORT 3,350
RESISTANCE 3,306
RESISTANCE 3297
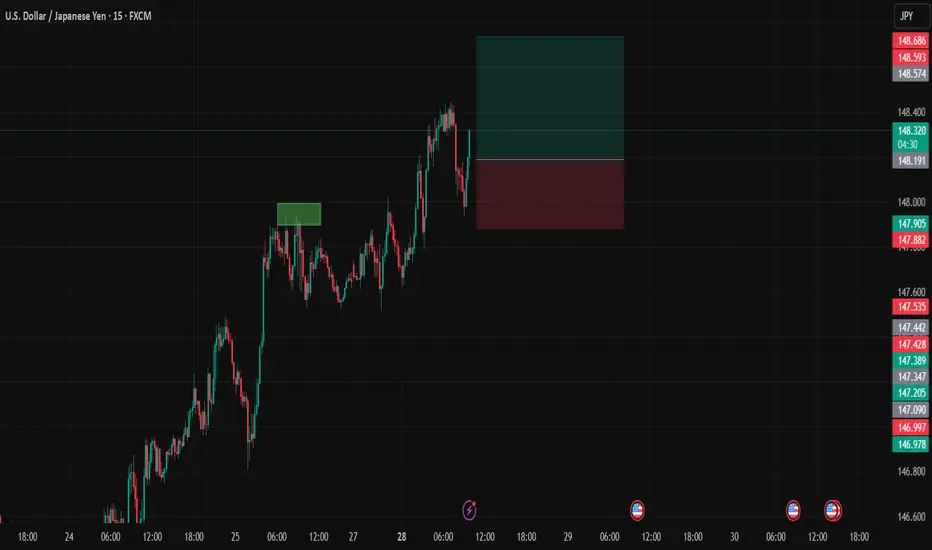
USDJPYDate:
July 28,2025
Session:
London and New York Session
Pair:
USDJPY
Bias:
Long
Looks like Sundays liquidity pool from last NYC open has been swept and it looks like price action wants to follow/continue its trend long.
Entry: 148.197
Stop Loss: 147.884
Target: 148.740
RR: 1.77
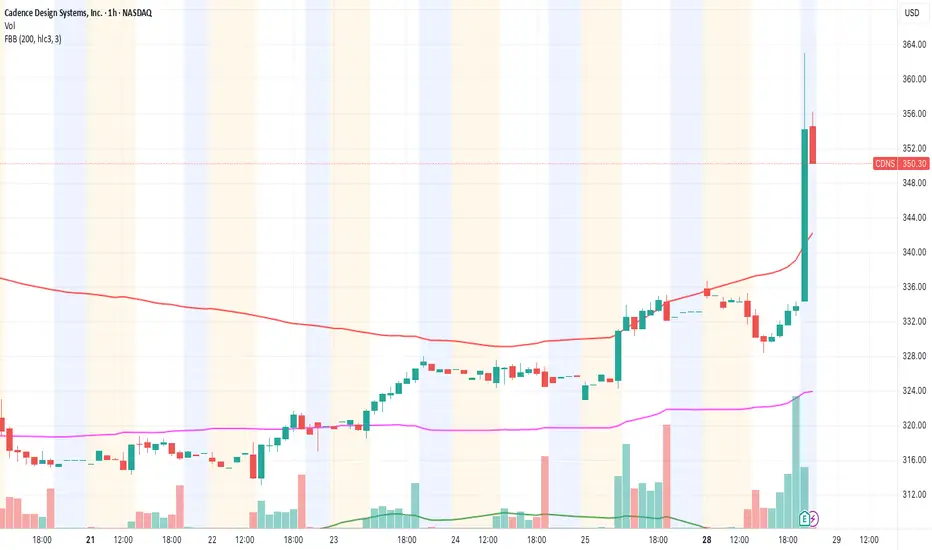
Cadence Design Systems (CDNS) – Keep an eye on tomorrow’s earninCadence ( NASDAQ:CDNS ) is reporting earnings tomorrow before the market opens, and honestly… this one might surprise.
Last quarter they not only beat expectations but also raised guidance — that’s no small thing. Since then, the stock has been consolidating nicely around the $160 zone. The chart looks solid: low volume pullbacks, RSI cooling off, and MACD looks ready to flip bullish.
If they deliver again (or just hold strong forward guidance), we could see a clean breakout toward $170+.
🟢 My game plan:
— Entry if it breaks $162 with volume
— Stop at $158
— Target $170–$175
Not financial advice — just what I’m seeing. The setup looks good and the risk is well-controlled.
What’s your take?
Ethereum - Finally new all time highs!🔬Ethereum ( CRYPTO:ETHUSD ) will break out now:
🔎Analysis summary:
For more than four years, Ethereum has overall been moving sideways. However now Ethereum is once again retesting previous all time highs and preparing a bullish breakout. Multiple retests are generally considered bullish so the breakout is very likely to happen any time soon.
📝Levels to watch:
$4.000
🙏🏻#LONGTERMVISION
SwingTraderPhil

NASDAQ Channel Up to be rejected soon.Nasdaq (NDX) has been trading within a Channel Up since the start of the month. The primary Support level has been the 4H MA50 (blue trend-line), which hasn't closed a 4H candle below it since July 14.
Right now the index is on its latest Bullish Leg, which can technically extend by +2.35% (max such Leg within the Channel Up).
We expect a rejection targeting the 4H MA50 again at 23200, which would represent a -1.25% decline, the weakest such Bearish Leg we had within the Channel Up.
-------------------------------------------------------------------------------
** Please LIKE 👍, FOLLOW ✅, SHARE 🙌 and COMMENT ✍ if you enjoy this idea! Also share your ideas and charts in the comments section below! This is best way to keep it relevant, support us, keep the content here free and allow the idea to reach as many people as possible. **
-------------------------------------------------------------------------------
Disclosure: I am part of Trade Nation's Influencer program and receive a monthly fee for using their TradingView charts in my analysis.
💸💸💸💸💸💸
👇 👇 👇 👇 👇 👇

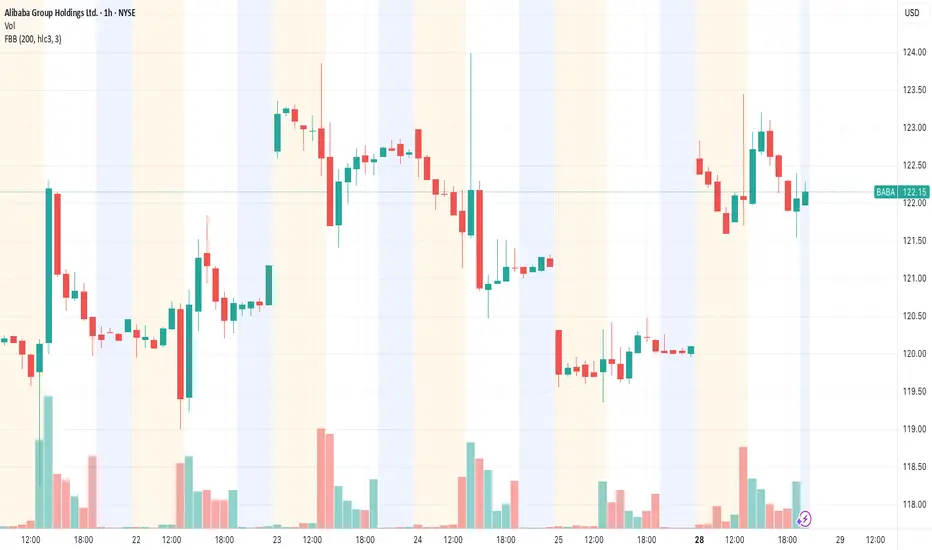
BABA looks ready to drop.It’s been hitting the $125 wall since May and just can’t break it. This last bounce? Weak volume. No real buyers stepping in. RSI is already stretched and there’s no accumulation from big players.
If it loses $120 with conviction, we might see $110 or lower.
And let’s be real — China’s still struggling and the narrative isn’t exciting anyone anymore.
I’m eyeing a PUT. If it breaks $125 clean, I’ll flip my view. Until then… watch out.
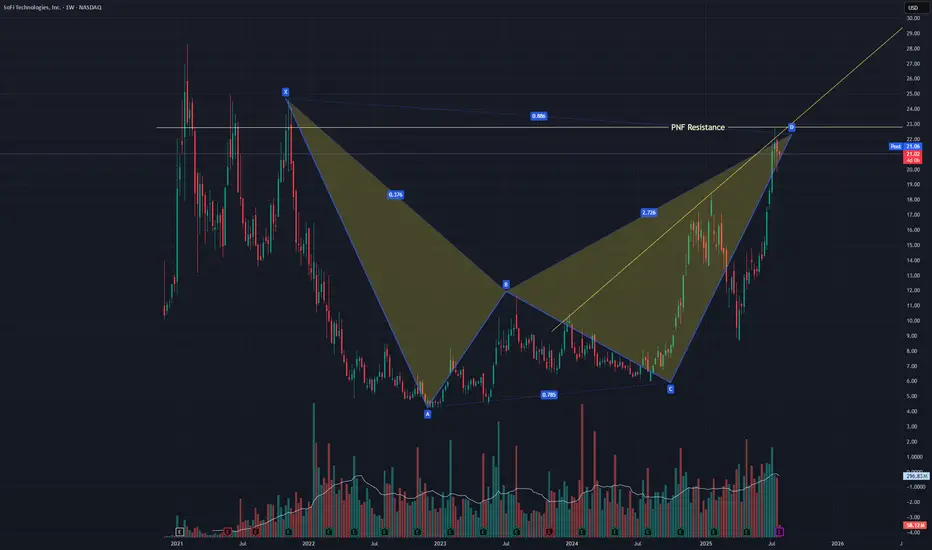
SOFI Pullback most likely comingNASDAQ:SOFI just finished a bearish bat harmonic and failed to break a resistance line I have from a PNF chart. It also failed a back test of a trendline of resistance in this uptrend. A pullback is likely but in this irrational market any thing could happen. I did a strangle +-5% just in case. I would not be surprised if I can close both with 20%+ profit.
Should we place a sell limit or not?We can take a position based on the range strategy.
Note: When you have proper risk management, you can enter positions easily and with peace of mind.
Potential BullsFrom the EW concepts, it looks like a w5 of a leading diagonal is the next print out on a D1 Time frame, and currently is a w4 correction.
By Harmonics, looks like a BAT Pattern finalising H1, and therefore looks like it's time to warm the engines of the chopper ready to fly. Until then we're expecting a bullish move.

Excitement or Euro sell-off?Today is Monday. After the market opened, the dollar suddenly surged while the euro dropped — even though there was no scheduled news on Forex Factory. Personally, I searched everywhere but couldn't find any fundamental reason behind this move. We’ll have to wait and see whether this trend continues or reverses.

EURUSD Will the 1D MA50 hold?The EURUSD pair has been trading within a Channel Up pattern since the April 21 2025 High. The price is right now on a strong pull-back and is about to test the 1D MA50 (blue trend-line) for the first time since May 12.
As long as the 1D candle closes above the 1D MA50, it will be a buy signal, targeting 1.19250 (a standard +3.20% rise).
If the candle closes below the 1D MA50, the buy will be invalidated and we will switch to a sell, targeting the 1D MA100 (green trend-line) at 1.14100.
-------------------------------------------------------------------------------
** Please LIKE 👍, FOLLOW ✅, SHARE 🙌 and COMMENT ✍ if you enjoy this idea! Also share your ideas and charts in the comments section below! This is best way to keep it relevant, support us, keep the content here free and allow the idea to reach as many people as possible. **
-------------------------------------------------------------------------------
Disclosure: I am part of Trade Nation's Influencer program and receive a monthly fee for using their TradingView charts in my analysis.
💸💸💸💸💸💸
👇 👇 👇 👇 👇 👇

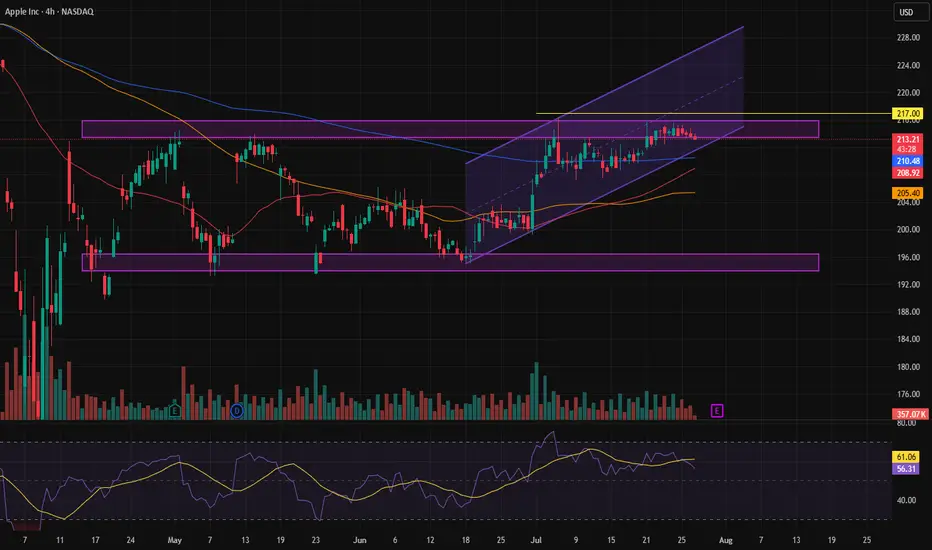
End of correction or a drop?In the long-term trend of Apple stock, we all know it's clearly bullish. However, it has been going through a correction for a while now, and signs are starting to suggest that the correction may be ending. Once a trigger is confirmed, we can consider trading this stock and going for a buy.
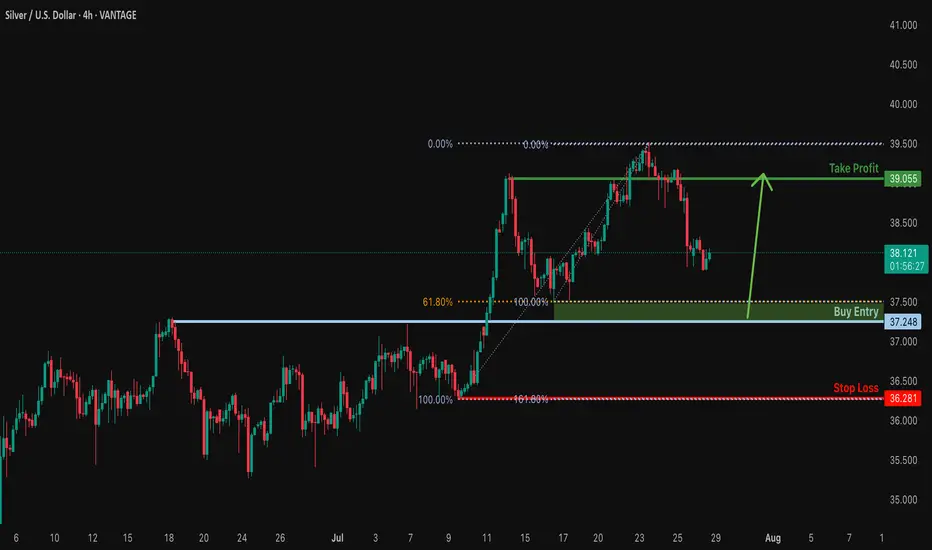
Bullish bounce for the Silver?The price is falling towards the support level whch i anoverlap support that is slighly below the 61.8%Fibonacci retraecment and could bounce from this level to our takeprofit.
Entry: 37.24
Why we like it:
There is an overlap support that is slightly below the 61.8% Fibonacci retracement.
Stop loss: 36.28
Why we like it:
There is a swing low support that aligns with the 161.8% Fibonacci extension.
Take profit: 39.05
Why we like it:
There is a pullback resistance.
Enjoying your TradingView experience? Review us!
Please be advised that the information presented on TradingView is provided to Vantage (‘Vantage Global Limited’, ‘we’) by a third-party provider (‘Everest Fortune Group’). Please be reminded that you are solely responsible for the trading decisions on your account. There is a very high degree of risk involved in trading. Any information and/or content is intended entirely for research, educational and informational purposes only and does not constitute investment or consultation advice or investment strategy. The information is not tailored to the investment needs of any specific person and therefore does not involve a consideration of any of the investment objectives, financial situation or needs of any viewer that may receive it. Kindly also note that past performance is not a reliable indicator of future results. Actual results may differ materially from those anticipated in forward-looking or past performance statements. We assume no liability as to the accuracy or completeness of any of the information and/or content provided herein and the Company cannot be held responsible for any omission, mistake nor for any loss or damage including without limitation to any loss of profit which may arise from reliance on any information supplied by Everest Fortune Group.
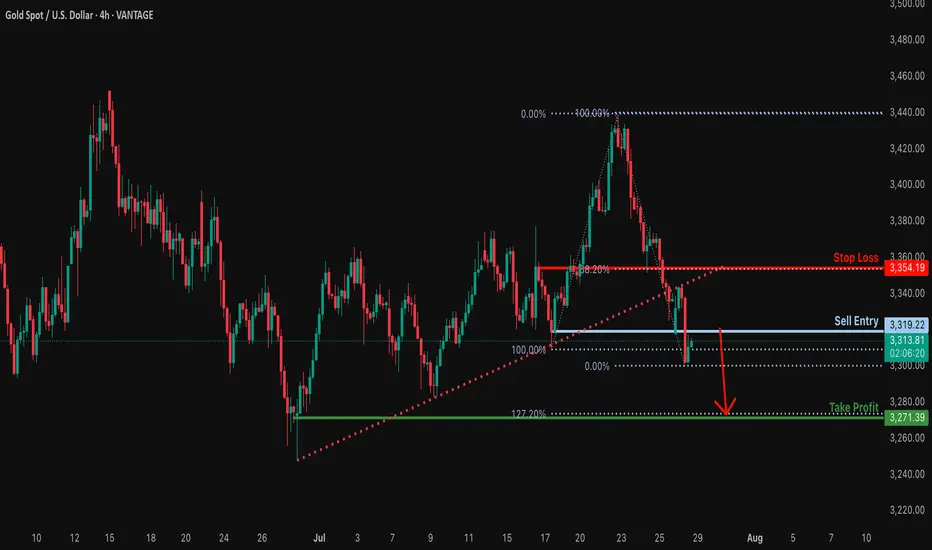
Bearish reversal?XAU/USD is rising towards the resistance level, which serves as a pullback resistance and could drop from this level to our take-profit target.
Entry: 3,319.22
Why we like it:
There is a pullback resistance.
Stop loss: 3,354.19
Why we like it:
There is a pullback resistance that aligns with the 38.2% Fibonacci retracement.
Take profit: 3,271.39
Why we like it:
There is a swing low support that lines up with the 127.2% Fibonacci extension.
Enjoying your TradingView experience? Review us!
Please be advised that the information presented on TradingView is provided to Vantage (‘Vantage Global Limited’, ‘we’) by a third-party provider (‘Everest Fortune Group’). Please be reminded that you are solely responsible for the trading decisions on your account. There is a very high degree of risk involved in trading. Any information and/or content is intended entirely for research, educational and informational purposes only and does not constitute investment or consultation advice or investment strategy. The information is not tailored to the investment needs of any specific person and therefore does not involve a consideration of any of the investment objectives, financial situation or needs of any viewer that may receive it. Kindly also note that past performance is not a reliable indicator of future results. Actual results may differ materially from those anticipated in forward-looking or past performance statements. We assume no liability as to the accuracy or completeness of any of the information and/or content provided herein and the Company cannot be held responsible for any omission, mistake nor for any loss or damage including without limitation to any loss of profit which may arise from reliance on any information supplied by Everest Fortune Group.
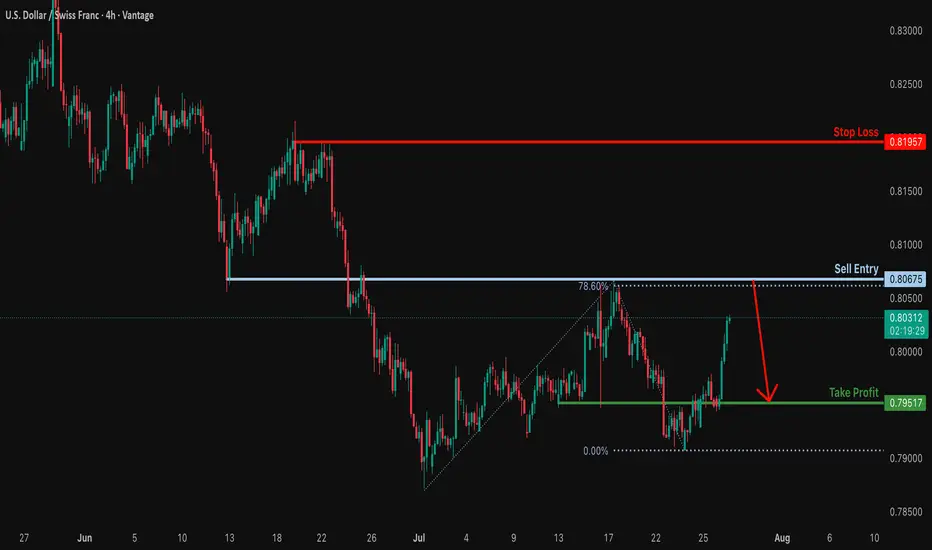
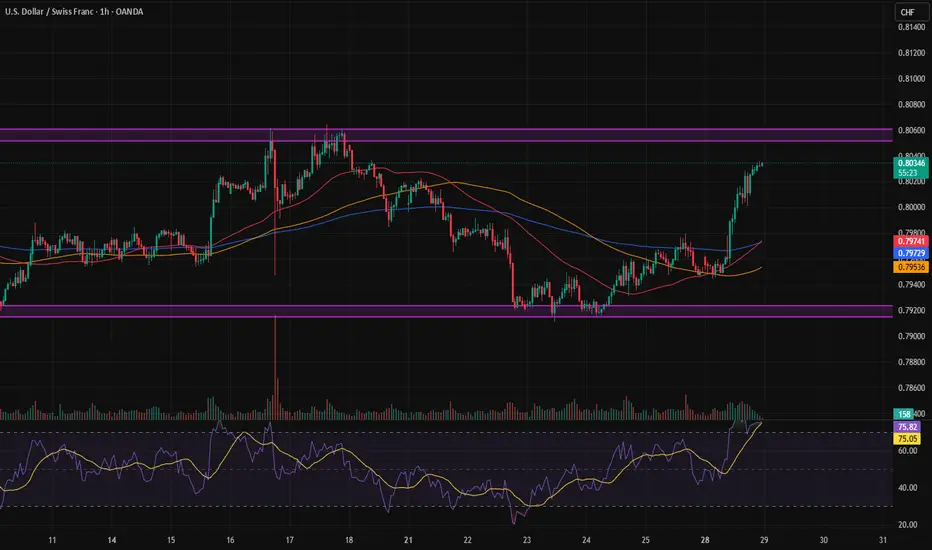
Heading into overlap resistance?The USD/CHF is rising towards the resistance level, which is an overlap resistance that aligns with the 78.6% Fibonacci projection and could potentially reverse from this level to our take-profit.
Entry: 0.8067
Why we like it:
There is an overlap resistance that aligns with the 78.6% Fibonacci projection.
Stop loss: 0.8195
Why we like it:
There is a swing high resistance.
Take profit: 0.7951
Why we like it:
There is a pullback support.
Enjoying your TradingView experience? Review us!
Please be advised that the information presented on TradingView is provided to Vantage (‘Vantage Global Limited’, ‘we’) by a third-party provider (‘Everest Fortune Group’). Please be reminded that you are solely responsible for the trading decisions on your account. There is a very high degree of risk involved in trading. Any information and/or content is intended entirely for research, educational and informational purposes only and does not constitute investment or consultation advice or investment strategy. The information is not tailored to the investment needs of any specific person and therefore does not involve a consideration of any of the investment objectives, financial situation or needs of any viewer that may receive it. Kindly also note that past performance is not a reliable indicator of future results. Actual results may differ materially from those anticipated in forward-looking or past performance statements. We assume no liability as to the accuracy or completeness of any of the information and/or content provided herein and the Company cannot be held responsible for any omission, mistake nor for any loss or damage including without limitation to any loss of profit which may arise from reliance on any information supplied by Everest Fortune Group.