HBAR movement up?Hbar gains loading
Current price $0.28
Next resistance $0.31 and $0.38
Rsi = Avg bullish
Stoch rsi = Avg bullish
Macd = Avg bullish
Harmonic Patterns

$300M Bitcoin Options Play by Trump Media Sparks DebateIn a surprising and bold move, Trump Media & Technology Group (TMTG), the company behind the social media platform Truth Social, has announced a $300 million investment in Bitcoin options. The decision has stirred strong market reactions and raised concerns among analysts and regulators about potential conflicts of interest.
According to sources close to the company, the investment is structured through derivatives contracts, focusing on long-term option positions, signaling TMTG’s confidence in Bitcoin’s future price appreciation. The move comes amid growing institutional interest in digital assets and reflects the company’s broader vision of “financial decentralization” and independence from traditional platforms.
However, critics are pointing to a potential conflict of interest. Donald Trump, the face of the company and a highly visible political figure, has previously voiced strong opposition to cryptocurrencies, calling them “fraudulent” and “dangerous.” Now, the very company in which he holds a substantial stake is investing heavily in the asset he once condemned. This contradiction has raised questions about transparency, underlying motives, and the possible use of corporate decisions for political or personal gain.
Financial analysts are split on the matter. Some view the investment as a diversification strategy and a hedge against market uncertainty. Others argue it adds unnecessary risk to a company with an already volatile business model, especially considering its recent public listing via a SPAC merger. The impact on the firm’s financial statements remains to be seen, particularly as the valuation of crypto assets fluctuates rapidly.
From a regulatory perspective, the situation may escalate. The U.S. Securities and Exchange Commission (SEC) has already shown interest in TMTG’s activities, and further scrutiny could follow if political influence over investment strategies becomes evident.
Despite the risks, markets initially reacted positively. Shares of Digital World Acquisition Corp — the SPAC partner of TMTG — saw a short-term spike following the investment news. This suggests that investors, while aware of the uncertainties, remain intrigued by the company’s aggressive posture toward emerging financial technologies.
Ultimately, Trump Media’s Bitcoin investment could be seen as a pivot toward the digital economy. However, given Donald Trump’s increasing political activity and his central role in the 2024 election cycle, this move requires close monitoring by investors and regulators alike. Whether it represents visionary strategy or political entanglement remains to be seen.

Solana (SOL) Revs Up Again — Fresh Breakout Above $200 in Sight?After months of consolidation, Solana (SOL) is once again showing signs of bullish momentum, trading near $176 and rapidly approaching a potential breakout level of $200. Investors and analysts alike are paying close attention, as on-chain activity and ecosystem development provide a compelling case for a renewed upward trajectory.
With growing demand for high-throughput blockchain infrastructure and new institutional integrations, Solana is positioning itself as more than just an Ethereum alternative—it’s emerging as a core infrastructure layer for high-performance Web3 applications.
Institutional Momentum Gathers Pace
In the last three weeks, several high-profile announcements have bolstered confidence in the Solana ecosystem. Fidelity Digital Assets revealed it is piloting tokenized bond products on Solana’s network, citing its fast settlement time and composability.
Meanwhile, Visa expanded its USDC settlement pilot on Solana across five countries, reinforcing the blockchain’s real-world financial use cases.
“Solana is no longer just retail-driven,” said Karla Nunez, digital asset strategist at ApexBridge. “Institutions are beginning to build directly on it—and that changes the dynamic.”
Ecosystem Growth and Developer Activity
The number of active developers on Solana has surged 38% quarter-over-quarter, according to Electric Capital’s Developer Report. Projects in DeFi, gaming, and NFTs continue to attract users, helped by extremely low transaction costs and sub-second finality.
Notably, the Solana Foundation recently launched a $100 million grant fund for AI-integrated crypto applications, which could catalyze the next wave of user adoption.
Technical Indicators Support Breakout Narrative
SOL has outperformed major altcoins this month, rising 21% in July. The token is now trading above its 50-day and 100-day moving averages, and momentum indicators suggest a potential breakout above the key psychological barrier at $200.
A confirmed break would likely open the door to $240–$260, with minimal historical resistance in that zone.
Macro Factors Provide Tailwind
The broader crypto market is recovering as inflation metrics cool and expectations for central bank easing rise. Solana, with its high beta to market movements, often leads altcoin rallies during bullish pivots.
Furthermore, the recent dip in Ethereum gas prices has had limited impact on Solana’s user base, suggesting its appeal is increasingly based on performance, not cost arbitrage.
Conclusion
While risks remain—from network outages to broader market volatility—Solana’s resurgence appears fundamentally supported. With institutional interest rising, technical signals aligning, and ecosystem momentum building, a clean break above $200 could mark the beginning of a new cycle for SOL.
For investors seeking exposure to high-speed smart contract platforms with real-world traction, Solana may be nearing another defining moment.

Sell eurgbpStrong sell expected as euro ready to weak across all cross pairs
Weekly daily overbought pair
Ready for the bearish correction

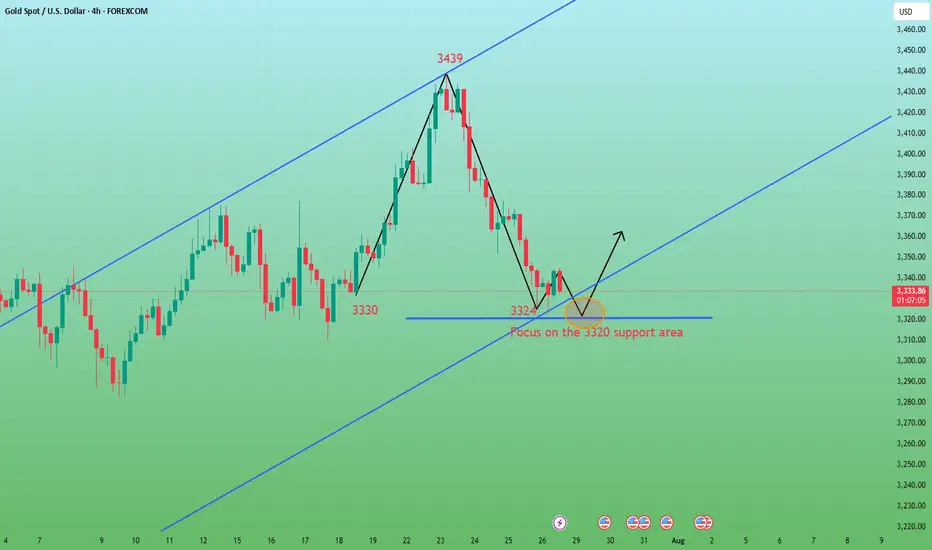
After continuous decline, oversold rebound opportunity.Last week, gold showed a trend of rising and falling. The weekly line closed with an inverted hammer and a long upper shadow, continuing the cross-line pattern of the previous week. The short-term rise was obviously blocked. Although the trend line connecting the daily lows of 3247-3282-3309 has been substantially broken, it may continue to fall after testing and sorting. In the short term, we need to focus on the 3348 suppression level and the 3324 support level. If they fall below, they may fall to the 3300/3285 support area. From the current trend, the overall bearish and lack of rebound momentum, the weak pattern may continue, and only when the price falls to a specific position to complete the bottoming will it attract entry.
Therefore, it is recommended to maintain a bearish mindset. The hourly line shows that the long and short conversions are relatively frequent. The upward trend channel was maintained in the first three days, but all gains were given up in the next two days and the downward channel was rebuilt. Given that both the 4-hour and daily lines have fallen below the key support level, 3348 has become the key point for today's bearishness, and it is necessary to change the mindset in time and go short.
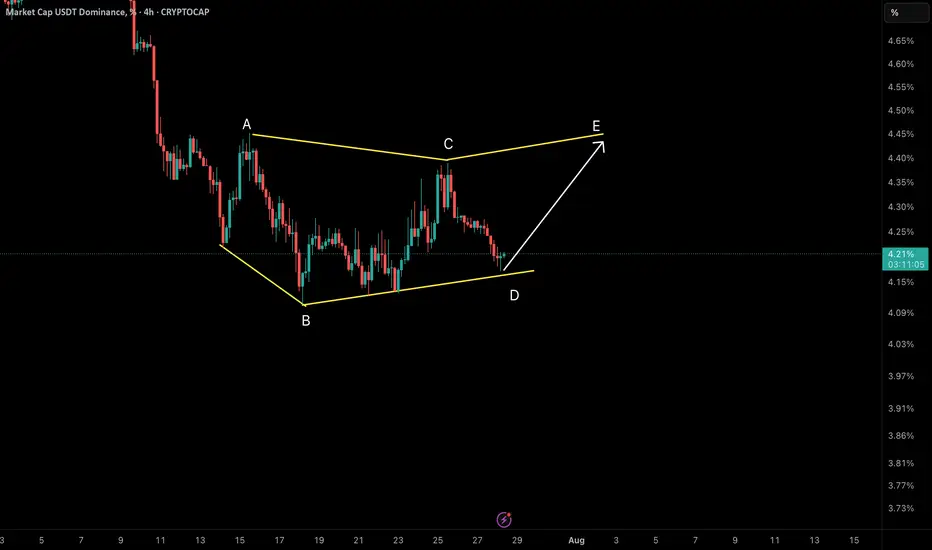
NeoWave Analysis – USDT Dominance (4H Timeframe)We are currently observing a Symmetrical Diametric correction pattern unfolding in the USDT Dominance chart. The wave structure labeled A–B–C–D–E shows clear evidence of this complex formation.
✅ Reasons for Diametric Labeling:
• Wave A and B initiated the pattern with a sharp drop (A), followed by wave B extending lower than A’s starting point – an early sign of a non-classical corrective structure.
• Waves C and D developed with alternating strength and duration, reflecting the expanding and contracting rhythm typical of diametric formations.
• Time and Price Alternation between segments is clearly visible, especially the extended duration between waves B and D compared to the earlier legs.
• The current price action is sitting right at the D wave bottom, which acts as a key structural support zone.
🔄 What’s Next?
• From this support, we expect wave E to initiate. In symmetrical diametrics, wave E typically reaches or slightly exceeds the top of wave C.
• A break below the D wave low doesn’t immediately invalidate the diametric scenario but may call for a re-evaluation toward an Expanded or Terminal Diametric.
• Confirmation of wave E may come with a bullish BOS (Break of Structure) on lower timeframes.
📌 Conclusion: We are likely at the early stage of wave E. If this interpretation holds, a bullish move should develop soon.
📡 Analysis by CryptoPilot – navigating the market with precision.
#CryptoPilot #USDT.D #Elliot #NeoWave #MarketStructure #TrendChannel #BOS #Altcoins #CryptoTrading
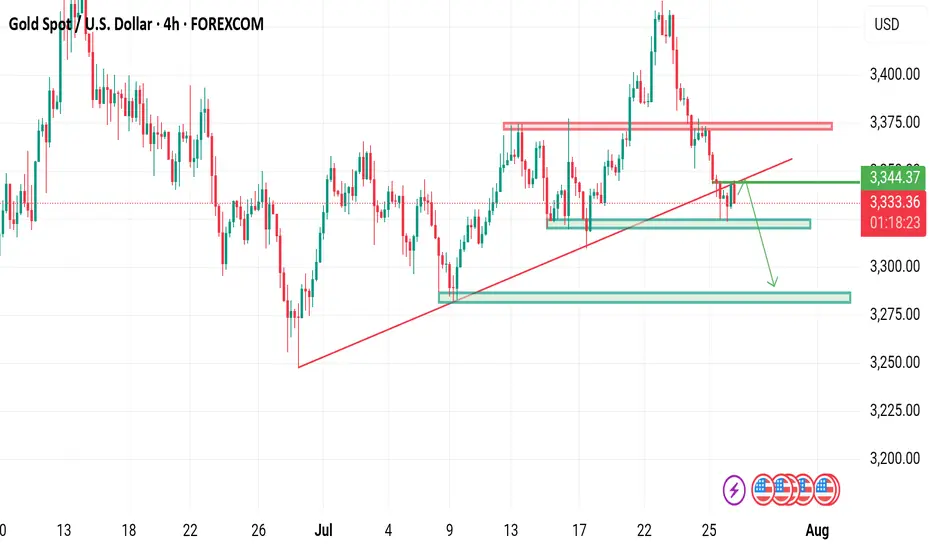
XAUUSD below trend Gold is currently below rising channel
What's possible scanarios we have?
▪️if H4 closed above 3345 ,I will be on bullish side till 3370-3380.
▪️if H4 candle closing below 3330 this Parallel moves upside will be invalid and we have targets at 3290 on mark I'm expecting selling move
#XAUUSD
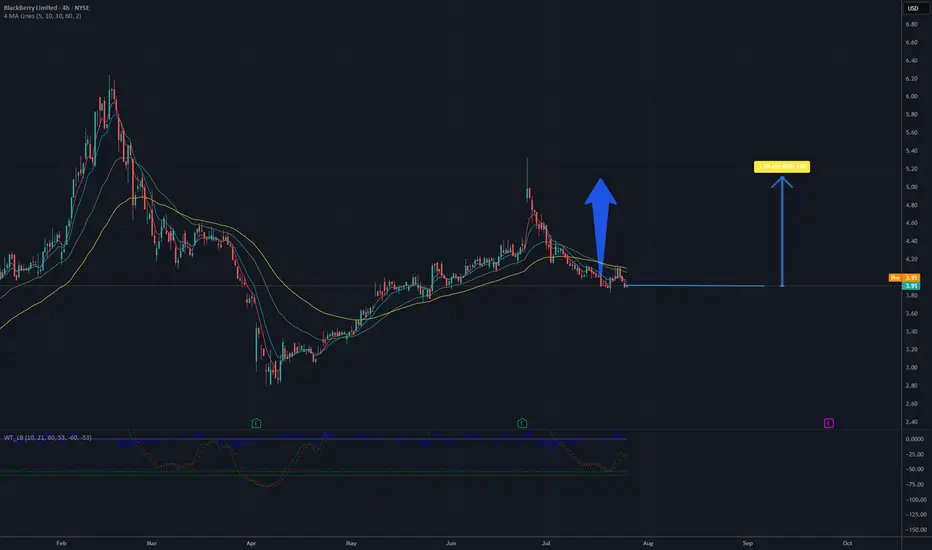
Is it a time for BlackBerry? Potential 30% profit - 5.20 USD
The analysis of the BlackBerry Limited (BB) chart suggests a potential price increase to the 5.20 USD level. The current price is approximately 3.91 USD, and the chart shows a recent bounce from support in the 3.70-3.80 USD range, which may indicate the start of a new upward trend. The moving averages (MA) point to a previous upward impulse, and the current levels could serve as a launchpad for further growth. If demand holds, the price may break through the resistance around 4.50 USD and head toward 5.20 USD, aligning with previous peaks. However, it’s important to monitor volume and the reaction at the 4.50 USD level to confirm the trend's strength. Additionally, in 2025, there have been speculations about the brand’s potential return to the mobile market with new smartphones featuring physical QWERTY keyboards and modern features such as AMOLED screens, 12 GB RAM, and 5G connectivity, sparking interest and hope among fans (information from March 2025). Furthermore, recent data indicates a rise in stock performance, with the price reaching 7.53 USD, reflecting a 36.66% increase since the beginning of the year (as of February 12, 2025).
Potential TP: 5.20 $
[XAUUSD] Gold Price Analysis July 28Symmetrical Channel Structure and High-Probability Trading Strategies
In today’s trading session (July 28), the XAUUSD 15-minute chart reveals a clear symmetrical channel pattern, indicating a technical correction after a previous strong uptrend.
1. Trend Structure
Phase 1 (July 18–23): Price moved within an ascending channel, forming higher highs and higher lows — a clear bullish structure.
Phase 2 (July 23–26): After peaking, price reversed into a descending channel, establishing a bearish sequence of lower highs and lower lows.
Currently, price is consolidating near the lower boundary of the descending channel, testing short-term support.
2. Key Support and Resistance Levels
Price Level
Technical Significance 3,360 – 3,365
Key resistance zone – top of descending channel 3,345
Dynamic resistance – EMA21 on M15 3,320 – 3,315
Crucial support zone – lower boundary of channel 3,300
Psychological support & prior swing low (July 10)
3. Price Action and Indicators
Volume has gradually decreased, signaling potential weakening of selling momentum.
RSI on M15 has rebounded from the oversold zone, currently moving above 40, suggesting a short-term technical bounce.
EMA21 & EMA50 are still sloping downward, confirming short-term bearish pressure.
4. Intraday Trade Scenarios
✅ Scenario 1: Rebound Play from Channel Support
Entry: 3,320 – 3,325 (after bullish confirmation candle)
Stop Loss: Below 3,312
Take Profit: 3,345 – 3,355 (resistance zone & mid-channel)
⚠️ Scenario 2: Trend-Following Short from Resistance
Entry: 3,345 – 3,350 (if price rejects at EMA21 or channel resistance)
Stop Loss: Above 3,360
Take Profit: 3,320 – 3,310
5. Strategy Outlook
XAUUSD remains in a corrective bearish phase after a strong rally. As long as the 3,312 level holds, there’s potential for a technical rebound during the London–New York session. However, sellers remain in control unless price breaks and closes above 3,360.
Follow for more real-time gold strategies. Save this post if you found it helpful!

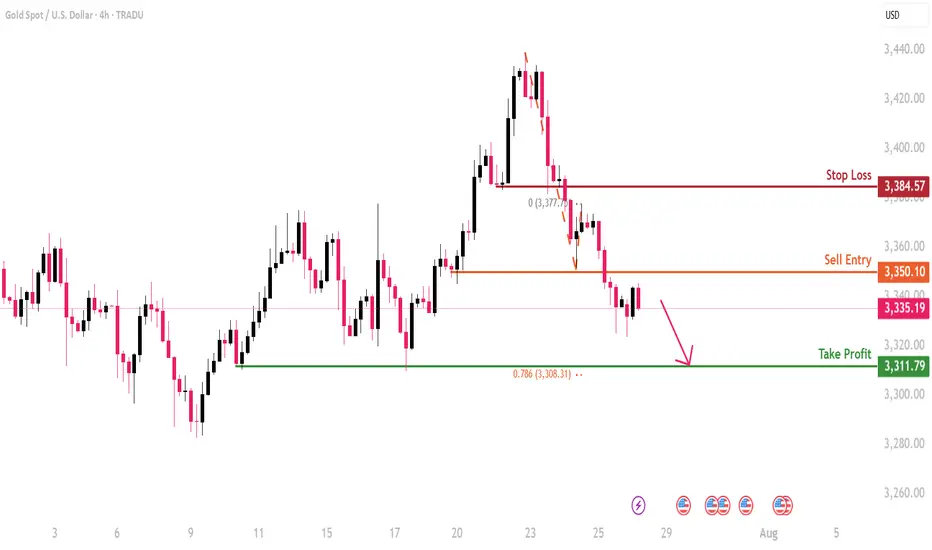
XAUUSD- Bearish Reversal OffBased on the H4 chart analysis, we can see that the price is rising toward our sell entry at 3350.10, which is a pullback resistance.
Our take profit will be at 3311.79, a swing low support level.
The stop loss will be placed at 3384.57, a pullback resistance.
CRVUSDT SHORTI think the CRV has reached the classic target and is in an important area. It could experience a price correction.
TP1: 0.93$ Accessible
TP2: 0.82$ Possible
TP3: 0.73$ Possible

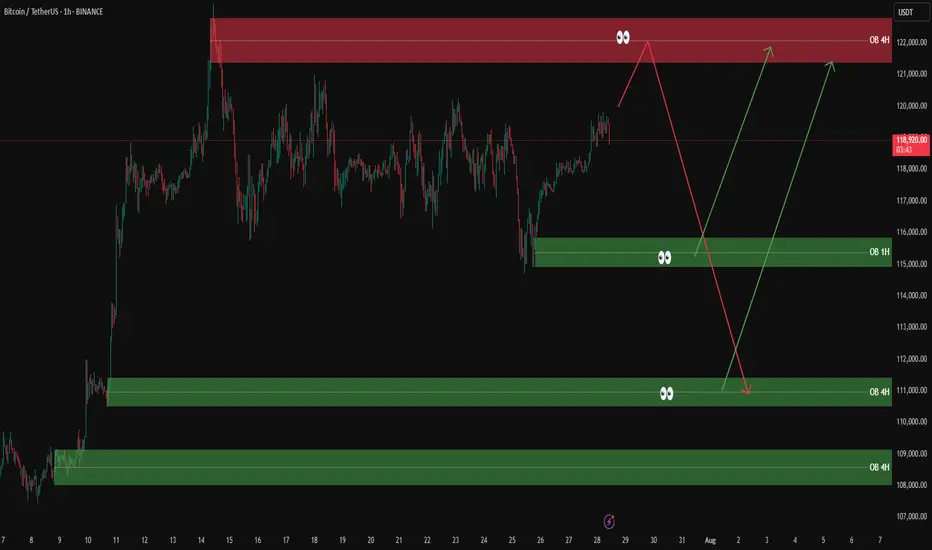
BTCUSDT analysis – 1H & 4H OB setups✅ The overall market trend is still bullish on the 1H and 4H timeframes. However, we’re watching the red 4H supply zone (around 122,000) closely for a possible short-term sell setup.
🟥 If price reaches this red OB, we’ll look for a light short position only with confirmation on the 5M or 3M timeframe.
🟩 On the downside, we are mainly interested in buy setups from the following key green OB zones:
🔹 OB 1H around 115,000
🔹 OB 4H around 111,000
🔹 OB 4H around 108,000
📌 Possible scenarios:
1️⃣ Price reaches the red OB → short with confirmation
2️⃣ Price pulls back to lower green OB zones → long with confirmation
3️⃣ Market bias remains bullish unless proven otherwise.
❌ No entry without confirmation.
XAU/USD 4H Bearish📉 XAU/USD 4H Bearish Setup
Gold is showing signs of continued downside after a failed breakout near the 3,367 resistance zone.
🔹 Entry: 3,336.38
🔹 Stop Loss: 3,367.51
🔹 Target: 3,246.50
🔹 Risk/Reward: 2.86
📊 Analysis Highlights:
Price rejected the value area high with a clean bearish engulfing setup.
MACD crossed down, and histogram momentum continues to decline.
Volume profile shows strong supply above 3,350 and thin demand below 3,300.
Target aligns with previous support near 3,246.
🧠 Expecting bearish continuation toward 3,240–3,246 zone if selling pressure sustains.

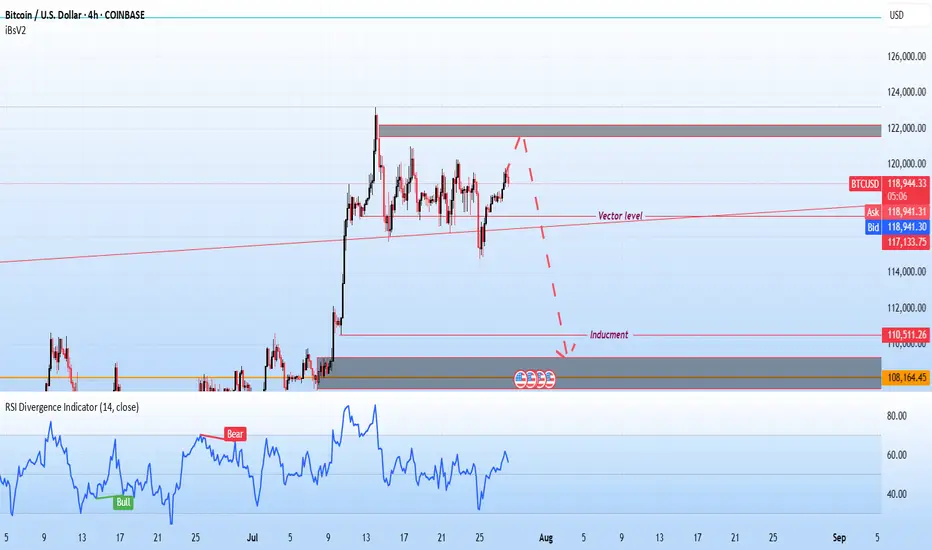
Bitcoin selling plan!"Hello, focusing on BTC on the 4-hour chart, the price is currently in a bullish momentum on higher time frames. However, it is showing signals indicating a potential completion of its pullback to the $110,000 zone. In my opinion, the $122,000 zone could be a good area to consider a sell position, with confirmation on the 15-minute chart. I plan to wait for this zone and then decide on initiating a sell position.
EURJPYBank of Japan (BOJ) — July 28, 2025: Latest Overview
Policy Rate and Recent Moves
Short-term policy rate: Remains at 0.5%, the highest since 2008.
Decision timing: This rate was set in January 2025 (up from 0.25%) and has been maintained
Policy Outlook and Economic Backdrop
Inflation: Tokyo's core CPI is running above the BOJ’s 2% target (2.9% YoY in July), primarily due to external price pressures like energy and currency movements, not strong domestic demand.
Growth trends: The BOJ has trimmed its growth outlook, noting headwinds from higher U.S. tariffs and yen weakness, but still expects a moderate recovery if global trade remains stable.
Bond Purchases: The BOJ is scaling back its massive holdings of Japanese government bonds—targeting a 400 billion yen quarterly reduction through March 2026, then lowering to 200 billion yen in subsequent quarters.
Potential rate path: Market consensus and BOJ commentary indicate a possible hike to at least 0.75% by year-end 2025 if above-target inflation persists and downside global risks do not intensify.
Key Drivers and Central Bank Signals
U.S.-Japan trade: The new trade pact has reduced some uncertainties, supporting the possibility of policy tightening if inflation and yen trends remain stable.
Inflation’s nature: The BOJ stresses that any additional rate hikes will depend on seeing sustained, demand-driven price increases and wages, rather than just external cost pressures.
Governor Ueda’s message: The BOJ is maintaining a cautious, data-dependent approach, prioritizing stability and careful evaluation of global and domestic risk factors.
Quick Fact Table
Indicator Latest (July 2025) BOJ’s Signal
Policy Rate 0.5% Steady for now; another hike possible in 2025
Tokyo Core CPI (YoY) 2.9% Sustainable above-target inflation
Next Meeting July 30–31 Hawkish bias; likely no immediate change
Bonds (JGB reduction) -400B yen/Q Gradual unwinding through March 2026
Rate Outlook Stable, with upside Hike to 0.75% possible by year-end if justified
Summary:
The BOJ remains in a cautious, data-driven policy stance at 0.5% as of late July 2025, with inflation still above target and moderate growth. The central bank is slowly reducing bond purchases and may raise rates again by year-end if the current economic trends persist, but no change is expected at the imminent July meeting.
European Central Bank (ECB) — July 2025: Latest Policy and Economic Update
Key Interest Rates and Current Stance
Deposit Facility Rate: 2.00%
Main Refinancing Operations (MRO) Rate: 2.15%
Marginal Lending Facility Rate: 2.40%
These rates were set after a 25 basis point cut in early June 2025 and have now been held steady as of the ECB’s July 24, 2025 meeting.
Monetary Policy Context
Policy Pause: The ECB ended a year-long easing cycle which saw rates cut from 4% to 2%. The current pause reflects the ECB’s “wait-and-see” approach as inflation has now stabilized at its 2% target and global trade tensions—especially over U.S. tariffs—add significant uncertainty.
No Commitments: The Governing Council is explicitly not pre-committing to any future rate path, emphasizing a data-dependent, meeting-by-meeting stance.
Asset Purchases: The ECB’s asset purchase programme (APP) and the pandemic emergency purchase programme (PEPP) portfolios are being reduced gradually, with no reinvestment of maturing securities.
Inflation and Economic Outlook
Inflation: Now at 2% (its target). The ECB expects it to remain near target for the period ahead. Wage growth continues but is slowing, and underlying price pressures are easing.
Ecoomic Growth: The eurozone economy grew more strongly than expected in early 2025, but trade uncertainty and a stronger euro are holding back business investment and exports. Higher government spending, especially on defense and infrastructure, is expected to support growth over the medium term.
Loans and Credit: Borrowing costs are at their lowest since late 2022. Households are benefiting from strong labor markets and growing wages, but banks are cautious in their lending due to uncertainty and global trade tensions.
Risks and Forward Guidance
The ECB is focused on safeguarding price stability amid exceptional uncertainty due to global trade disputes and policy risks.
There is no forward guidance for the next rate change. Markets are pricing only one possible additional cut for 2025, and a potential return to tightening in late 2026 if inflation stays below target.
Summary Table: ECB at a Glance (July 2025)
Policy Rate 2.15%
Deposit Rate 2.00%
Marginal Lending 2.40%
Inflation (Jun 25) 2% (target achieved)
GDP Growth (2025) 0.9% (projected)
Policy bias Cautious, data-dependent pause
The ECB’s current stance is one of caution, monitoring the effects of prior easing and global trade risks while inflation stabilizes at target. No further near-term cuts are planned unless significant data surprises emerge. The approach is flexible, with decisions made meeting-by-meeting in response to evolving economic and financial conditions.

GBPAUD: Possible bounce at supportI am watching for a possible reversal GBPAUD, expecting a rejection with a upside target at around 2.073.
This area is where it can become a decision point, either price finds support and bounces, or it breaks below, and the move can start to extend lower.
Just sharing my thoughts for the charts, this isn’t financial advice. Always confirm your setups and manage your risk properly.
Disclosure: I am part of Trade Nation's Influencer program and receive a monthly fee for using their TradingView charts in my analysis.

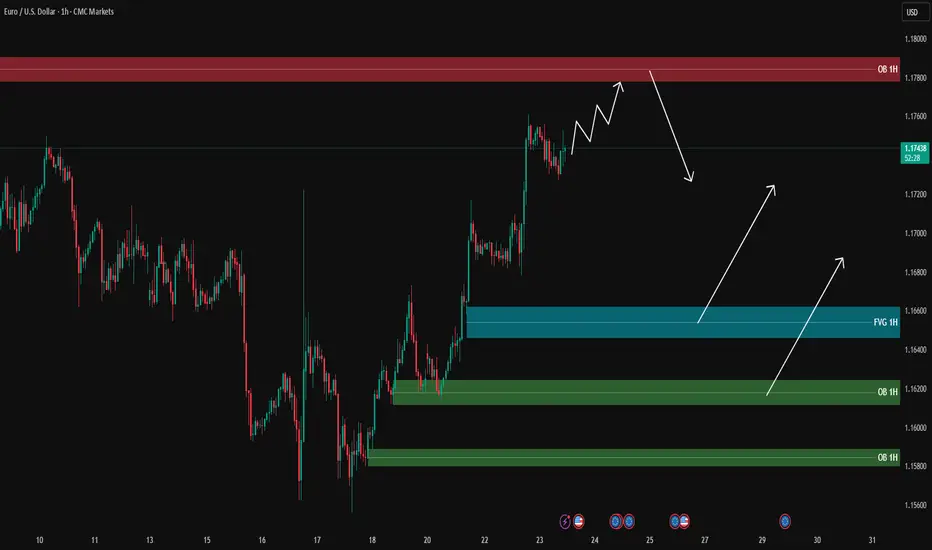
EURUSD analysis - 1H FVG and OB setupsOn the 1H timeframe, price is moving strongly towards the 1H supply zone (around 1.1780), and it is likely to reach this area first before pulling back.
During the pullback, the blue FVG and green OB zones below are key areas for potential long entries:
🔹 FVG 1H around 1.1660
🔹 OB 1H around 1.1620
🔹 OB 1H around 1.1580
📌 Plan:
1️⃣ If the price reaches the upper supply zone, we will look for short scalps with confirmation on the lower timeframe (5M/3M).
2️⃣ After the pullback to lower zones, we will look for long opportunities with PA confirmation.
🎯 Long targets after pullback: 1.1700 – 1.1720, potentially 1.1750.
❌ No entry without confirmation.
USDJPY Forming Bullish MomemtumUSDJPY is currently exhibiting strong bullish momentum following a clean breakout from a bullish pennant formation on the 2H timeframe. The market formed higher lows and consolidated within a tight structure, creating compression that has now resolved upward. This breakout indicates continuation of the prior bullish impulse, and price is now targeting the key resistance zone between 148.80 and 149.30. This area previously acted as a strong supply zone, and a clean break above could open the path toward 150.00 psychological levels.
Fundamentally, the US dollar remains supported by expectations of a hawkish tone from the Federal Reserve. Despite mixed economic data recently, the US economy remains resilient, with GDP growth and labor market data showing strength. On the other hand, the Bank of Japan continues to maintain an ultra-loose monetary stance, offering little rate-hike guidance. This divergence in monetary policy keeps the dollar well-bid against the yen. Any further yield differential expansion will continue to support USDJPY to the upside.
From a technical perspective, the structure remains bullish as long as price holds above the 147.65–147.50 breakout support. Momentum is aligning well with the current price action, and volume confirmation on the breakout adds confidence to the bullish scenario. Traders should watch the reaction around the 149.00–149.30 zone carefully, as this is the last major barrier before we potentially see continuation toward multi-month highs.
Overall, the bullish continuation pattern suggests that USDJPY is preparing for another leg higher. With both technical and fundamental factors aligning, this pair remains a key watch for trend-following traders. Patience and precision remain critical here—watch for potential retests and build positions on confirmation.

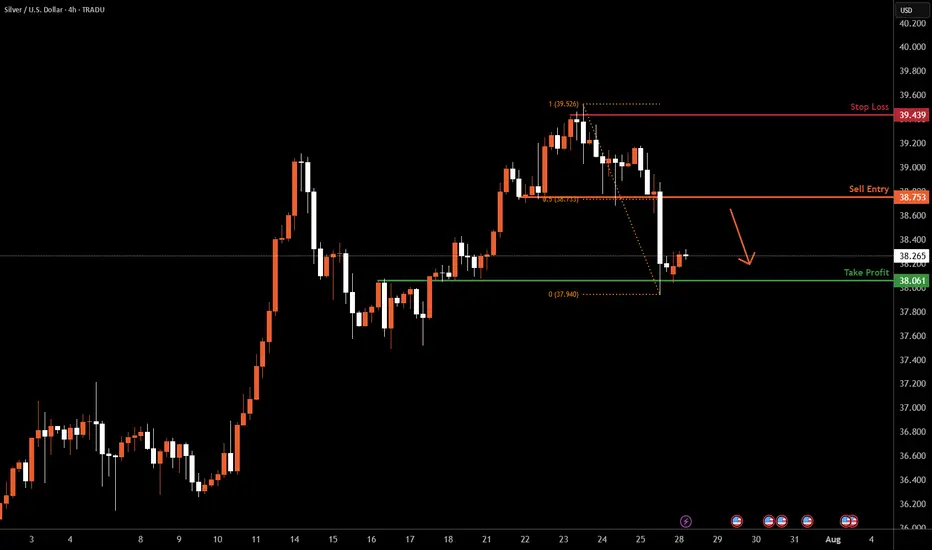
XAGUSD H4 I Bearish Reversal Based on the H4 chart analysis, we can see that the price is rising toward our sell entry at 38.75, which is a pullback resistance aligning with a 50% Fibo retracement.
Our take profit will be at 38.06, an overlap support level.
The stop loss will be placed at 39.43, a swing-high resistance level.
High Risk Investment Warning
Trading Forex/CFDs on margin carries a high level of risk and may not be suitable for all investors. Leverage can work against you.
Stratos Markets Limited (tradu.com ):
CFDs are complex instruments and come with a high risk of losing money rapidly due to leverage. 66% of retail investor accounts lose money when trading CFDs with this provider. You should consider whether you understand how CFDs work and whether you can afford to take the high risk of losing your money.
Stratos Europe Ltd (tradu.com ):
CFDs are complex instruments and come with a high risk of losing money rapidly due to leverage. 66% of retail investor accounts lose money when trading CFDs with this provider. You should consider whether you understand how CFDs work and whether you can afford to take the high risk of losing your money.
Stratos Global LLC (tradu.com ):
Losses can exceed deposits.
Please be advised that the information presented on TradingView is provided to Tradu (‘Company’, ‘we’) by a third-party provider (‘TFA Global Pte Ltd’). Please be reminded that you are solely responsible for the trading decisions on your account. There is a very high degree of risk involved in trading. Any information and/or content is intended entirely for research, educational and informational purposes only and does not constitute investment or consultation advice or investment strategy. The information is not tailored to the investment needs of any specific person and therefore does not involve a consideration of any of the investment objectives, financial situation or needs of any viewer that may receive it. Kindly also note that past performance is not a reliable indicator of future results. Actual results may differ materially from those anticipated in forward-looking or past performance statements. We assume no liability as to the accuracy or completeness of any of the information and/or content provided herein and the Company cannot be held responsible for any omission, mistake nor for any loss or damage including without limitation to any loss of profit which may arise from reliance on any information supplied by TFA Global Pte Ltd.
The speaker(s) is neither an employee, agent nor representative of Tradu and is therefore acting independently. The opinions given are their own, constitute general market commentary, and do not constitute the opinion or advice of Tradu or any form of personal or investment advice. Tradu neither endorses nor guarantees offerings of third-party speakers, nor is Tradu responsible for the content, veracity or opinions of third-party speakers, presenters or participants.
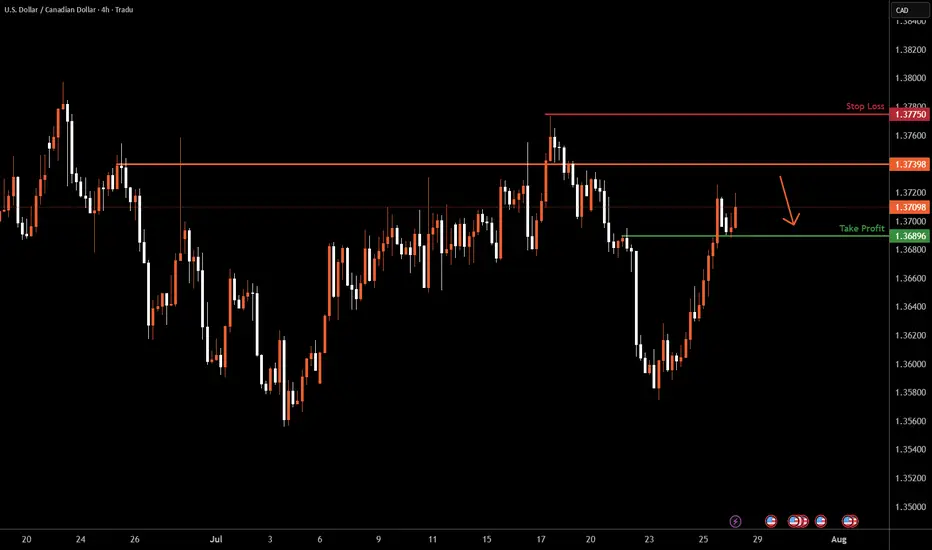
USDCAD H4 I Bearish Reversal OffBased on the H4 chart analysis, we can see that the price is rising toward our sell entry at 1.3739, which is a pullback resistance.
Our take profit will be at 1.3689, an overlap support level.
The stop loss will be placed at 1.3775, the swing-high resistance level.
High Risk Investment Warning
Trading Forex/CFDs on margin carries a high level of risk and may not be suitable for all investors. Leverage can work against you.
Stratos Markets Limited (tradu.com ):
CFDs are complex instruments and come with a high risk of losing money rapidly due to leverage. 66% of retail investor accounts lose money when trading CFDs with this provider. You should consider whether you understand how CFDs work and whether you can afford to take the high risk of losing your money.
Stratos Europe Ltd (tradu.com ):
CFDs are complex instruments and come with a high risk of losing money rapidly due to leverage. 66% of retail investor accounts lose money when trading CFDs with this provider. You should consider whether you understand how CFDs work and whether you can afford to take the high risk of losing your money.
Stratos Global LLC (tradu.com ):
Losses can exceed deposits.
Please be advised that the information presented on TradingView is provided to Tradu (‘Company’, ‘we’) by a third-party provider (‘TFA Global Pte Ltd’). Please be reminded that you are solely responsible for the trading decisions on your account. There is a very high degree of risk involved in trading. Any information and/or content is intended entirely for research, educational and informational purposes only and does not constitute investment or consultation advice or investment strategy. The information is not tailored to the investment needs of any specific person and therefore does not involve a consideration of any of the investment objectives, financial situation or needs of any viewer that may receive it. Kindly also note that past performance is not a reliable indicator of future results. Actual results may differ materially from those anticipated in forward-looking or past performance statements. We assume no liability as to the accuracy or completeness of any of the information and/or content provided herein and the Company cannot be held responsible for any omission, mistake nor for any loss or damage including without limitation to any loss of profit which may arise from reliance on any information supplied by TFA Global Pte Ltd.
The speaker(s) is neither an employee, agent nor representative of Tradu and is therefore acting independently. The opinions given are their own, constitute general market commentary, and do not constitute the opinion or advice of Tradu or any form of personal or investment advice. Tradu neither endorses nor guarantees offerings of third-party speakers, nor is Tradu responsible for the content, veracity or opinions of third-party speakers, presenters or participants.
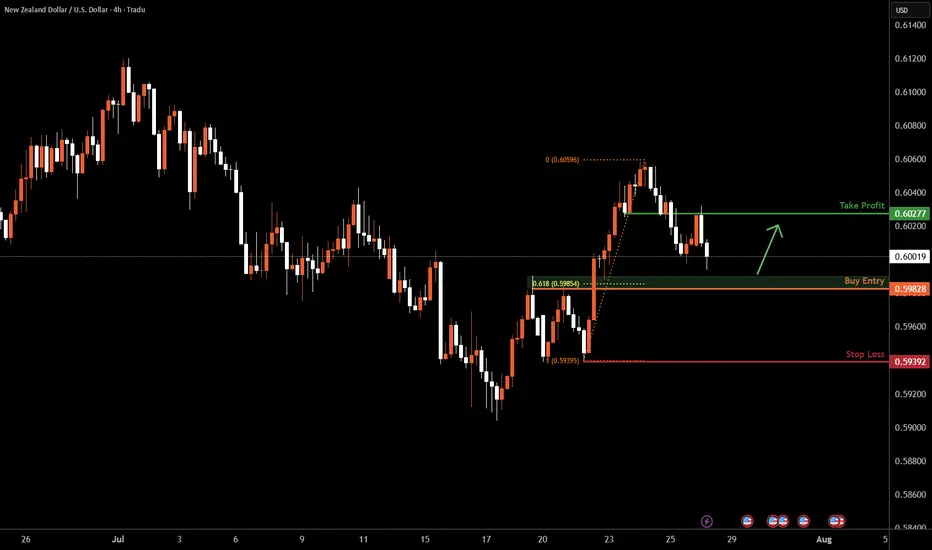
NZDUSD H4 I Bullish Bounce off the 61.8% Based on the H4 chart analysis, we can see that the price is falling toward our buy entry at 0.5982, which is a pullback support that aligns with the 61.8% Fib retracement.
Our take profit will be at 0.6027, which is an overlap resistance level.
The stop loss will be placed at 0.5939, a swing low support.
High Risk Investment Warning
Trading Forex/CFDs on margin carries a high level of risk and may not be suitable for all investors. Leverage can work against you.
Stratos Markets Limited (tradu.com ):
CFDs are complex instruments and come with a high risk of losing money rapidly due to leverage. 66% of retail investor accounts lose money when trading CFDs with this provider. You should consider whether you understand how CFDs work and whether you can afford to take the high risk of losing your money.
Stratos Europe Ltd (tradu.com ):
CFDs are complex instruments and come with a high risk of losing money rapidly due to leverage. 66% of retail investor accounts lose money when trading CFDs with this provider. You should consider whether you understand how CFDs work and whether you can afford to take the high risk of losing your money.
Stratos Global LLC (tradu.com ):
Losses can exceed deposits.
Please be advised that the information presented on TradingView is provided to Tradu (‘Company’, ‘we’) by a third-party provider (‘TFA Global Pte Ltd’). Please be reminded that you are solely responsible for the trading decisions on your account. There is a very high degree of risk involved in trading. Any information and/or content is intended entirely for research, educational and informational purposes only and does not constitute investment or consultation advice or investment strategy. The information is not tailored to the investment needs of any specific person and therefore does not involve a consideration of any of the investment objectives, financial situation or needs of any viewer that may receive it. Kindly also note that past performance is not a reliable indicator of future results. Actual results may differ materially from those anticipated in forward-looking or past performance statements. We assume no liability as to the accuracy or completeness of any of the information and/or content provided herein and the Company cannot be held responsible for any omission, mistake nor for any loss or damage including without limitation to any loss of profit which may arise from reliance on any information supplied by TFA Global Pte Ltd.
The speaker(s) is neither an employee, agent nor representative of Tradu and is therefore acting independently. The opinions given are their own, constitute general market commentary, and do not constitute the opinion or advice of Tradu or any form of personal or investment advice. Tradu neither endorses nor guarantees offerings of third-party speakers, nor is Tradu responsible for the content, veracity or opinions of third-party speakers, presenters or participants.
ALTUSDT Forming Bullish ReversalALTUSDT is currently displaying a bullish reversal pattern that may mark the beginning of a significant trend change. After a prolonged period of downward or sideways movement, the asset has shown signs of accumulation, with increasing volume and a shift in price structure. This type of reversal formation typically signals that buyers are stepping back into the market with strength, aiming to reclaim lost levels and push higher.
Technically, the chart structure supports a strong recovery potential, as the price is attempting to break out of a consolidation zone with solid momentum. The bullish reversal pattern suggests that sellers have likely exhausted their control, and a trend shift is underway. With increasing interest and engagement around the ALT project, both technically and sentimentally, a price surge in the range of 90% to 100% becomes a realistic expectation.
From a market sentiment perspective, ALT is regaining attention from crypto traders due to recent development updates and growing adoption potential in its ecosystem. Investors are beginning to identify ALT as a sleeper altcoin that may deliver above-average returns once the reversal is confirmed. This momentum is backed by improved volume and clear buying pressure on critical support levels.
A confirmed breakout above resistance, with sustained volume, could act as the catalyst for a parabolic move. Traders should monitor this setup closely, as it may offer one of the best reward-to-risk ratios in the current market cycle. ALTUSDT could be setting up for a major rally in the coming days or weeks.
✅ Show your support by hitting the like button and
✅ Leaving a comment below! (What is You opinion about this Coin)
Your feedback and engagement keep me inspired to share more insightful market analysis with you!

Beamx Dear Traders,
this coin have a nice potential it have breakout today
we may see it at 0.080 or 0.0085 in the future
