Heading into pullback resistance?The Aussie (AUD/USD) is rising towards the pivot and could reverse to the 1st support which is an overlap support.
Pivot: 0.6587
1st Support: 0.6492
1st Resistance: 0.6634
Risk Warning:
Trading Forex and CFDs carries a high level of risk to your capital and you should only trade with money you can afford to lose. Trading Forex and CFDs may not be suitable for all investors, so please ensure that you fully understand the risks involved and seek independent advice if necessary.
Disclaimer:
The above opinions given constitute general market commentary, and do not constitute the opinion or advice of IC Markets or any form of personal or investment advice.
Any opinions, news, research, analyses, prices, other information, or links to third-party sites contained on this website are provided on an "as-is" basis, are intended only to be informative, is not an advice nor a recommendation, nor research, or a record of our trading prices, or an offer of, or solicitation for a transaction in any financial instrument and thus should not be treated as such. The information provided does not involve any specific investment objectives, financial situation and needs of any specific person who may receive it. Please be aware, that past performance is not a reliable indicator of future performance and/or results. Past Performance or Forward-looking scenarios based upon the reasonable beliefs of the third-party provider are not a guarantee of future performance. Actual results may differ materially from those anticipated in forward-looking or past performance statements. IC Markets makes no representation or warranty and assumes no liability as to the accuracy or completeness of the information provided, nor any loss arising from any investment based on a recommendation, forecast or any information supplied by any third-party.
Harmonic Patterns

Bullish bounce off pullback support?The Cable (GBP/USD) has bounced off the pivot, which has been identified as a pullback support, and could bounce to the 1st resistance, which is a pullback resistance.
Pivot: 1.3584
1st Support: 1.3519
1st Resistance: 1.3771
Risk Warning:
Trading Forex and CFDs carries a high level of risk to your capital and you should only trade with money you can afford to lose. Trading Forex and CFDs may not be suitable for all investors, so please ensure that you fully understand the risks involved and seek independent advice if necessary.
Disclaimer:
The above opinions given constitute general market commentary, and do not constitute the opinion or advice of IC Markets or any form of personal or investment advice.
Any opinions, news, research, analyses, prices, other information, or links to third-party sites contained on this website are provided on an "as-is" basis, are intended only to be informative, is not an advice nor a recommendation, nor research, or a record of our trading prices, or an offer of, or solicitation for a transaction in any financial instrument and thus should not be treated as such. The information provided does not involve any specific investment objectives, financial situation and needs of any specific person who may receive it. Please be aware, that past performance is not a reliable indicator of future performance and/or results. Past Performance or Forward-looking scenarios based upon the reasonable beliefs of the third-party provider are not a guarantee of future performance. Actual results may differ materially from those anticipated in forward-looking or past performance statements. IC Markets makes no representation or warranty and assumes no liability as to the accuracy or completeness of the information provided, nor any loss arising from any investment based on a recommendation, forecast or any information supplied by any third-party.

SYMMETRYHey traders, hope you’re crushing it this week! 🚀 Quick note on our BTC/USD 4-hour ABC setup: the symmetry I’m talking about is purely price-based—AB and BC move roughly the same number of ticks, not the same amount of time.
So when we say “symmetry,” we mean:
A→B drop: ~3,670 ticks
B→C rally: ~3,427 ticks
That close price match gives us confidence in our PCZ at 107,600–107,300 (78.6%–100% retrace of B→C).
⚔️ Trade Plan Recap
Entry: Long between 107,300–107,600
Stop: Below 107,000 (keeps risk tight)
Targets:
Zone 1: 61.8–78.6% of B→C → 110,657–111,569
Zone 2: 127.2–161.8% extension of A→B → 114,206–116,084
Remember: look for that bullish pin-bar or engulfing candle down in our PCZ before pulling the trigger, and bail if we lose 107,000. No time-based symmetry here—just clean price alignment. Trade with structure, not emotion, and keep an eye on any macro or on-chain news for extra context. ✌️

BTC there was a limit seller yesterday 109700 BTC there was a limit seller yesterday 109700 . Today I'm looking at sales locally

EUR/USD 2HOURS BULISH ANALISISThe chart appears to be part of a larger analysis or trading strategy, as indicated by the presence of multiple tabs open in the browser, including one labeled "BTC 2HOURS BULLISH ANALYSIS"

Bullish for DXY, tuesday trading still bullish on dxy, two areas of interest are those two 4hr fvg shown. Thier is also sellside liquidity , whcih we can sweep or we can have a deeper retracement, and touch the second fvg. I am still expecting a bullish dollar for the week, even tho my weekly objective has been met. The US10Y looks really strong and the u.s trasury bonds look week. The only thing is that if you look at the eurusd chart, we have equal highs, so that can be something to watch.

OSCR: A bored phase accumulation before next up viewOSCR: A bored phase accumulation before next up view.
Consolidating in a tight range to absorb remaining supply before resuming the uptrend.
.
US STOCKS- WALL STREET DREAM- LET'S THE MARKET SPEAK!

XRP - How they gonna know? They gonna know!Huuuhh XRP blind longs eh? But yeah you can but if i was I wouldn;t


COTI/USDT – Approaching Make-or-Break Zone | Multi-Leg Reversal📌 Overview:
COTI is currently at a critical inflection point in its long-term structure. After a prolonged distribution phase since 2021 and a steady decline throughout 2023–2025, price action is now testing a historical support zone that has repeatedly triggered strong reversals. This area could be the foundation of a macro bottom formation—or the gateway to further downside if broken.
🔍 Technical Breakdown & Key Price Zones:
🟨 Major Demand Zone (Support Block):
Range: $0.030 – $0.048
This is a historically significant support area, previously acting as a launchpad for bullish impulses.
There is a strong chance of forming a double bottom or even an Inverse Head & Shoulders pattern here on the weekly timeframe, which would hint at a trend reversal if confirmed.
📏 Layered Resistance Levels (Profit-Taking Zones):
1. $0.05600 – Minor resistance, first validation of bullish strength
2. $0.07460 – Previous structural resistance from early 2024
3. $0.08995 – Key breakout level that may trigger mid-term momentum
4. $0.13211 – $0.18230 – Medium-term targets on sustained breakout
5. $0.25157 – $0.41854 – Long-term targets if macro bullish trend forms
🟢 Bullish Scenario (Reversal Setup):
✅ If price holds the $0.030–$0.048 demand zone:
Expect gradual bullish momentum toward $0.05600, followed by confirmation above $0.08995.
Weekly breakout candle with strong volume would confirm reversal structure.
Mid-term price target could reach $0.132 – $0.182, or even higher during an altseason rotation.
🔴 Bearish Scenario (Breakdown Setup):
❌ If the support zone fails:
Price could break below $0.030, exposing $0.0259 or even $0.020 as next downside targets.
This would negate the potential reversal structure and resume the bearish continuation trend.
Traders should wait for a new base or re-accumulation signal before re-entering long positions.
📊 Pattern Focus:
Double Bottom / Inverse Head & Shoulders (Potential Formation)
Descending Channel breakout watch
Volume Drying Up = Possible prelude to trend reversal if volume spikes follow
💡 Trading Strategy:
Aggressive Long Entry: Buy within the yellow support zone, stop-loss below $0.030
Conservative Entry: Wait for breakout and successful retest above $0.056
Bearish Setup: If breakdown occurs, short-term shorts or sidelining recommended
📈 Momentum Outlook:
Weekly structure suggests seller exhaustion is setting in.
Swing reversal is likely if price holds above the support range for the coming weeks.
Gradual accumulation strategy is suitable for swing traders.
🧲 Key Takeaway:
> COTI is entering a golden zone for potential mid-term reversal. If the support holds and a reversal pattern forms, a 200%+ upside is realistic. However, failure to hold this zone could lead to a breakdown and deeper correction. Patience and confirmation are key.
#COTI #COTIUSDT #CryptoAnalysis #AltcoinSeason #DoubleBottom #SupportZone #TrendReversal #TechnicalAnalysis #WeeklyChart #BreakoutWatch

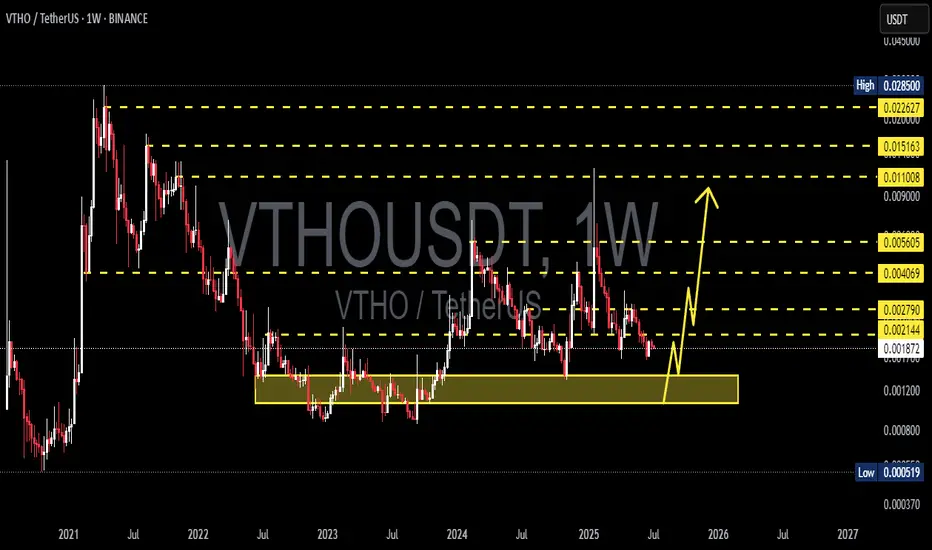
VTHO/USDT Reversal Zone? Weekly Demand Area Holds the Key!📊 Full Analysis of VTHO/USDT (1W Timeframe):
📌 Overview:
VTHO/USDT is currently sitting at a critical level after revisiting a strong historical demand zone around 0.0012–0.0018 USDT. This support zone has been respected multiple times since mid-2022 and has acted as a key reversal point in the past.
📈 Bullish Scenario:
✅ Support Zone Holding
The price is holding within the yellow support box, indicating active buyers and potential accumulation.
✅ Possible Reversal Pattern
If the price forms a higher low or a clear rejection here, there’s potential for a Double Bottom or even an Adam & Eve reversal pattern.
✅ Potential Upside Targets:
Minor Resistance: 0.00214 – 0.00279
Intermediate Target: 0.00406
Major Resistance: 0.0056 – 0.011
Higher Target: 0.015 – 0.022 USDT
Ultimate Long-Term Target: 0.0285 USDT (historical high)
📌 Bullish confirmation can come from: a strong bounce with volume, VeChain/VTHO ecosystem news, or general crypto market strength.
📉 Bearish Scenario:
❌ Breakdown from Key Support
If price breaks down below 0.0012, it opens the risk of a further drop toward 0.00052 USDT, which is the multi-year low last seen in 2020.
📉 Bearish signs to watch:
Weekly candle close below support
Increasing sell volume
Weak buyer reaction near support
🔍 Pattern Analysis:
📌 Potential Double Bottom Zone
The highlighted yellow zone may form the base for a double bottom reversal pattern—a bullish setup if confirmed.
📌 Range-Bound Structure
Price has been consolidating in a wide horizontal range between 0.0018 – 0.0056. A breakout from this range will determine the next long-term direction.
📢 Conclusion:
VTHO is at a critical accumulation zone. If the demand zone holds, a bullish reversal may unfold with significant upside potential. However, a breakdown below the zone would invalidate the bullish setup and signal deeper downside.
#VTHO #VTHOUSDT #CryptoAnalysis #AltcoinSeason #TechnicalAnalysis #BullishSetup #BearishScenario #CryptoTrading #SupportZone #ReversalPattern
DGB/USDT – Preparing for a Rebound from a Historical Demand Zone
🔍 Pattern and Structure Analysis
The DGB/USDT pair is currently testing a historical demand zone in the 0.00550 – 0.00733 USDT area (highlighted in yellow). This zone has proven to be a strong bounce area since mid-2022. The price structure is forming a large double bottom in this support zone, indicating a potential medium- to long-term bullish reversal pattern.
🟢 Bullish Scenario
If the price successfully holds and bounces from this support:
Short-term targets: 0.00832 – 0.01067 USDT
Mid-term targets: 0.01343 – 0.01807 USDT
Long-term targets: 0.03207 – 0.03845 USDT
This potential upside is supported by an emerging early-stage parabolic move, as illustrated by the yellow projection arrow. If volume increases and market sentiment improves, we may see a multi-wave recovery pattern unfold.
🔴 Bearish Scenario
However, if the price breaks down below the key support at 0.0055 USDT:
It may retest the all-time low around 0.00500 USDT
Such a breakdown would invalidate the long-standing support structure and may lead to further downside pressure
🧩 Pattern Summary
Pattern: Double Bottom / Accumulation Zone
Timeframe: 1W (Weekly)
Current Sentiment: Neutral to Bullish, depending on confirmation of a rebound from the yellow zone
🧠 Additional Notes
This accumulation zone may present a valuable opportunity for swing traders or long-term investors looking for entries at undervalued levels. However, it's crucial to wait for volume confirmation and a strong reversal candlestick pattern before entering.
#DGB #DGBUSDT #AltcoinAnalysis #CryptoWeekly #DoubleBottom #SupportZone #ReversalPattern #CryptoSignals

ENS/USDT Weekly Outlook – “Massive Breakout Brewing from Base
Ethereum Name Service (ENS) is currently positioned at a critical inflection point on the weekly chart, signaling a high-probability setup for a massive bullish breakout after nearly 2 years of sideways consolidation and structural base building.
🔍 Technical Pattern Breakdown
This chart reveals a macro Ascending Triangle formation developing since late 2022, with higher lows consistently respecting a rising trendline support and price now retesting the golden pocket Fib zone.
Pattern Formed:
📐 Macro Ascending Triangle + Fibonacci Confluence Zone
📉 Long-Term Accumulation Range: $14.6 – $23.7
Trendline Support:
✅ Rising since 2023, showing buyers consistently stepping in at higher levels
Fibonacci Retracement:
🔑 Price currently sitting between 0.5–0.786 Fib zone from the 2023 rally:
0.5 = $18.33
0.618 = $16.82
0.786 = $14.68
🟢 Bullish Scenario – Potential Multi-Leg Rally
If price holds and rebounds from this support region, we could see a stepped breakout with key resistance levels being taken out one by one:
1. First Resistance – $23.73: Psychological and structural breakout level
2. Second Target – $30.48: Prior major rejection area
3. Third Target – $47.13: 2024 resistance high
4. Macro Target – $69.99 to $85.88: Full breakout potential from triangle width and historical ATH zone
🚀 Upside Potential from Current Levels (~$18): Over 350%
📈 This would confirm the end of the accumulation cycle and signal the start of a long-term bullish phase.
🔴 Bearish Scenario – Breakdown Risk
In the event of a confirmed weekly candle closing below $14.6, we invalidate the ascending triangle and shift bias toward bearish retracement:
Next Support: $10.00
Extreme Bearish Target: $6.65 (macro low from 2022)
🛑 Breakdown from this structure would suggest failure of the accumulation pattern and return to long-term bearish pressure.
💡 Strategic Insight
ENS is one of the rare altcoins currently forming a clean high-timeframe bullish setup. This is the kind of structure institutional or swing traders look for when anticipating early entries before explosive moves.
With a tight invalidation below $14.6 and multiple upside targets, this setup provides a strong risk-reward opportunity.
#ENS #ENSUSDT #AltcoinBreakout #CryptoSetup #Accumulation #TechnicalAnalysis #CryptoTrading #SwingTrade #Fibonacci #AscendingTriangle

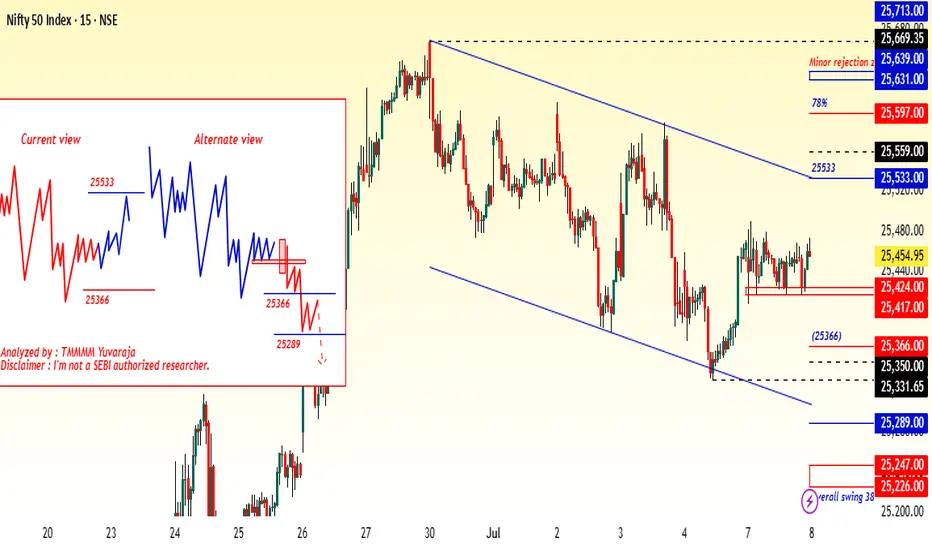
#Nifty directions and levels for July 8th:Good morning, Friends! 🌞
Here are the market directions and levels for July 8th:
Market Overview
The global markets have a moderately bullish sentiment, while our local markets are showing a moderately bearish sentiment. Gift Nifty is indicating a neutral to slightly negative start of around 10 points today.
So, what can we expect today?
Last evening, the Dow Jones fell more than 1%, but Gift Nifty didn’t reflect that. However, our markets continued to trade within a range, maintaining a moderately bearish bias. So, there’s nothing new; we can follow the same sentiment we saw in the previous session.
This means if the market pulls back initially, we may see a minor pullback followed by some consolidation. This is my first variation (current view).
On the other hand, if the decline shows a solid structure and breaks the immediate support level, we can expect the correction to continue. If that happens, it could mark the beginning of a C wave or 3rd wave of the correction. This is my alternate view.
#Banknifty directions and levels for July 8th:if the market pulls back initially, we may see a minor pullback followed by some consolidation. This is my first variation (current view).
On the other hand, if the decline shows a solid structure and breaks the immediate support level, we can expect the correction to continue. If that happens, it could mark the beginning of a C wave or 3rd wave of the correction. This is my alternate view.

USDJPY H4 I Bullish Bounce Off Based on the H4 chart analysis, the price is falling toward our buy entry level at 145.21, a pullback support.
Our take profit is set at 146.70, aligning with the 100% Fibo projection.
The stop loss is placed at 144.01, a pullback support.
High Risk Investment Warning
Trading Forex/CFDs on margin carries a high level of risk and may not be suitable for all investors. Leverage can work against you.
Stratos Markets Limited (tradu.com ):
CFDs are complex instruments and come with a high risk of losing money rapidly due to leverage. 63% of retail investor accounts lose money when trading CFDs with this provider. You should consider whether you understand how CFDs work and whether you can afford to take the high risk of losing your money.
Stratos Europe Ltd (tradu.com ):
CFDs are complex instruments and come with a high risk of losing money rapidly due to leverage. 63% of retail investor accounts lose money when trading CFDs with this provider. You should consider whether you understand how CFDs work and whether you can afford to take the high risk of losing your money.
Stratos Global LLC (tradu.com ):
Losses can exceed deposits.
Please be advised that the information presented on TradingView is provided to Tradu (‘Company’, ‘we’) by a third-party provider (‘TFA Global Pte Ltd’). Please be reminded that you are solely responsible for the trading decisions on your account. There is a very high degree of risk involved in trading. Any information and/or content is intended entirely for research, educational and informational purposes only and does not constitute investment or consultation advice or investment strategy. The information is not tailored to the investment needs of any specific person and therefore does not involve a consideration of any of the investment objectives, financial situation or needs of any viewer that may receive it. Kindly also note that past performance is not a reliable indicator of future results. Actual results may differ materially from those anticipated in forward-looking or past performance statements. We assume no liability as to the accuracy or completeness of any of the information and/or content provided herein and the Company cannot be held responsible for any omission, mistake nor for any loss or damage including without limitation to any loss of profit which may arise from reliance on any information supplied by TFA Global Pte Ltd.
The speaker(s) is neither an employee, agent nor representative of Tradu and is therefore acting independently. The opinions given are their own, constitute general market commentary, and do not constitute the opinion or advice of Tradu or any form of personal or investment advice. Tradu neither endorses nor guarantees offerings of third-party speakers, nor is Tradu responsible for the content, veracity or opinions of third-party speakers, presenters or participants.

USDCHF H4 I Bullish Bounce Off Based on the H4 chart analysis, the price is approaching our buy entry level at 0.7966, a pullback support that aligns closely with the 61.8% Fib retracement.
Our take profit is set at 0.8023, a pullback resistance.
The stop loss is placed a t0.7901. a swing low support.
High Risk Investment Warning
Trading Forex/CFDs on margin carries a high level of risk and may not be suitable for all investors. Leverage can work against you.
Stratos Markets Limited (tradu.com ):
CFDs are complex instruments and come with a high risk of losing money rapidly due to leverage. 63% of retail investor accounts lose money when trading CFDs with this provider. You should consider whether you understand how CFDs work and whether you can afford to take the high risk of losing your money.
Stratos Europe Ltd (tradu.com ):
CFDs are complex instruments and come with a high risk of losing money rapidly due to leverage. 63% of retail investor accounts lose money when trading CFDs with this provider. You should consider whether you understand how CFDs work and whether you can afford to take the high risk of losing your money.
Stratos Global LLC (tradu.com ):
Losses can exceed deposits.
Please be advised that the information presented on TradingView is provided to Tradu (‘Company’, ‘we’) by a third-party provider (‘TFA Global Pte Ltd’). Please be reminded that you are solely responsible for the trading decisions on your account. There is a very high degree of risk involved in trading. Any information and/or content is intended entirely for research, educational and informational purposes only and does not constitute investment or consultation advice or investment strategy. The information is not tailored to the investment needs of any specific person and therefore does not involve a consideration of any of the investment objectives, financial situation or needs of any viewer that may receive it. Kindly also note that past performance is not a reliable indicator of future results. Actual results may differ materially from those anticipated in forward-looking or past performance statements. We assume no liability as to the accuracy or completeness of any of the information and/or content provided herein and the Company cannot be held responsible for any omission, mistake nor for any loss or damage including without limitation to any loss of profit which may arise from reliance on any information supplied by TFA Global Pte Ltd.
The speaker(s) is neither an employee, agent nor representative of Tradu and is therefore acting independently. The opinions given are their own, constitute general market commentary, and do not constitute the opinion or advice of Tradu or any form of personal or investment advice. Tradu neither endorses nor guarantees offerings of third-party speakers, nor is Tradu responsible for the content, veracity or opinions of third-party speakers, presenters or participants.

EURUSD – Rounded Top Signals Bearish Reversal The EURUSD pair is showing clear signs of weakness after forming a rounded top pattern near the 1.18100 resistance zone. Price has broken out of a short-term sideways range and may retest the FVG area near 1.17500 before continuing its downward move.
If the support at 1.17118 is breached, EURUSD could head toward the 1.16200 level – a key demand zone on the chart. The bearish momentum is being reinforced by recent news:
Yesterday: U.S. employment data exceeded expectations, strengthening the USD.
Today: The euro is under pressure due to EU recession concerns and political instability in France.
Coming up: The FOMC minutes may continue to reflect a hawkish stance, which could further weigh on EURUSD.

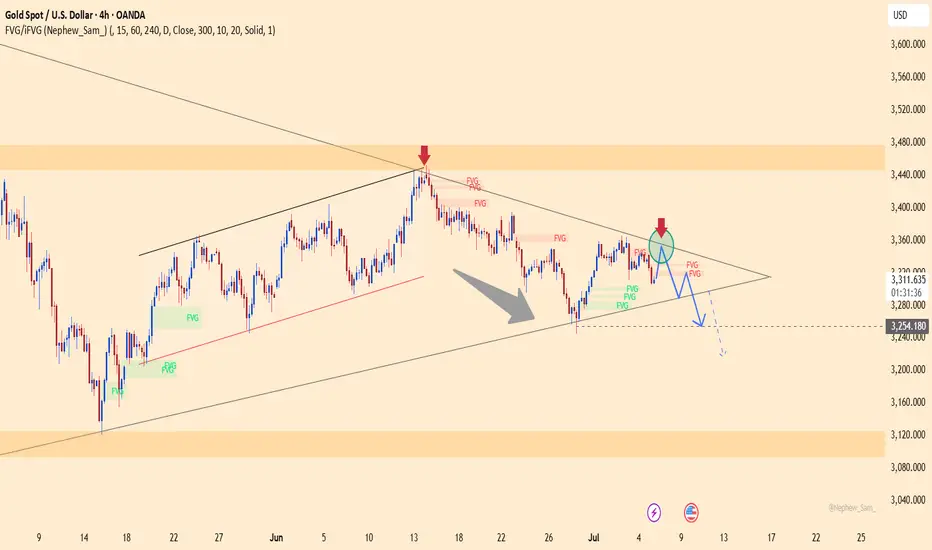
The Upper Edge Trap: Is Gold’s Breakdown Scripted?Gold is showing clear signs of weakness after being firmly rejected at the upper boundary of a symmetrical triangle around the $3,330–$3,340 zone. Sellers have regained control, pushing price toward the key support at $3,254 – a level that previously marked a short-term bottom.
If this support breaks, the bearish structure could extend further toward the $3,120 region. The downward pressure is reinforced by stronger-than-expected U.S. employment data and hawkish FOMC minutes, which have strengthened the dollar and diminished gold's appeal.
GBPUSD H1 I Bearish Drop Based on the H1chart analysis, we can see that the price is testing our sell entry at 1.3634 which is an overlap resistance.
Our take profit will be at 1.3533, an overlap support level.
The stop loss will be placed at 1.3684, an overlap resistance.
High Risk Investment Warning
Trading Forex/CFDs on margin carries a high level of risk and may not be suitable for all investors. Leverage can work against you.
Stratos Markets Limited (tradu.com ):
CFDs are complex instruments and come with a high risk of losing money rapidly due to leverage. 63% of retail investor accounts lose money when trading CFDs with this provider. You should consider whether you understand how CFDs work and whether you can afford to take the high risk of losing your money.
Stratos Europe Ltd (tradu.com ):
CFDs are complex instruments and come with a high risk of losing money rapidly due to leverage. 63% of retail investor accounts lose money when trading CFDs with this provider. You should consider whether you understand how CFDs work and whether you can afford to take the high risk of losing your money.
Stratos Global LLC (tradu.com ):
Losses can exceed deposits.
Please be advised that the information presented on TradingView is provided to Tradu (‘Company’, ‘we’) by a third-party provider (‘TFA Global Pte Ltd’). Please be reminded that you are solely responsible for the trading decisions on your account. There is a very high degree of risk involved in trading. Any information and/or content is intended entirely for research, educational and informational purposes only and does not constitute investment or consultation advice or investment strategy. The information is not tailored to the investment needs of any specific person and therefore does not involve a consideration of any of the investment objectives, financial situation or needs of any viewer that may receive it. Kindly also note that past performance is not a reliable indicator of future results. Actual results may differ materially from those anticipated in forward-looking or past performance statements. We assume no liability as to the accuracy or completeness of any of the information and/or content provided herein and the Company cannot be held responsible for any omission, mistake nor for any loss or damage including without limitation to any loss of profit which may arise from reliance on any information supplied by TFA Global Pte Ltd.
The speaker(s) is neither an employee, agent nor representative of Tradu and is therefore acting independently. The opinions given are their own, constitute general market commentary, and do not constitute the opinion or advice of Tradu or any form of personal or investment advice. Tradu neither endorses nor guarantees offerings of third-party speakers, nor is Tradu responsible for the content, veracity or opinions of third-party speakers, presenters or participants.

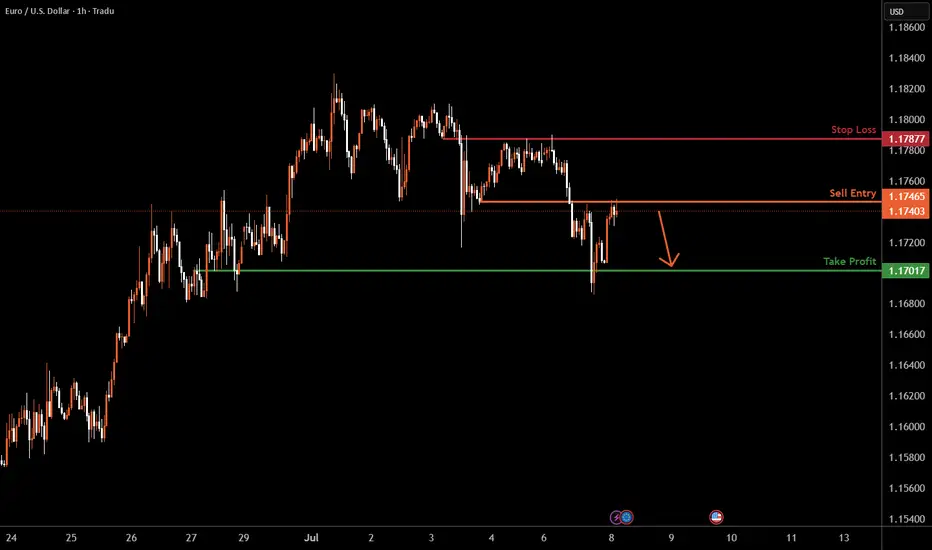
EURUSD H1 I Bearish Reversal Based on the H1chart analysis, we can see that the price is testing our sell entry at 1.1745 which is an overlap resistance.
Our take profit will be at 1.1701, an overlap support level.
The stop loss will be placed at 1.1787, an overlap resistance.
High Risk Investment Warning
Trading Forex/CFDs on margin carries a high level of risk and may not be suitable for all investors. Leverage can work against you.
Stratos Markets Limited (tradu.com ):
CFDs are complex instruments and come with a high risk of losing money rapidly due to leverage. 63% of retail investor accounts lose money when trading CFDs with this provider. You should consider whether you understand how CFDs work and whether you can afford to take the high risk of losing your money.
Stratos Europe Ltd (tradu.com ):
CFDs are complex instruments and come with a high risk of losing money rapidly due to leverage. 63% of retail investor accounts lose money when trading CFDs with this provider. You should consider whether you understand how CFDs work and whether you can afford to take the high risk of losing your money.
Stratos Global LLC (tradu.com ):
Losses can exceed deposits.
Please be advised that the information presented on TradingView is provided to Tradu (‘Company’, ‘we’) by a third-party provider (‘TFA Global Pte Ltd’). Please be reminded that you are solely responsible for the trading decisions on your account. There is a very high degree of risk involved in trading. Any information and/or content is intended entirely for research, educational and informational purposes only and does not constitute investment or consultation advice or investment strategy. The information is not tailored to the investment needs of any specific person and therefore does not involve a consideration of any of the investment objectives, financial situation or needs of any viewer that may receive it. Kindly also note that past performance is not a reliable indicator of future results. Actual results may differ materially from those anticipated in forward-looking or past performance statements. We assume no liability as to the accuracy or completeness of any of the information and/or content provided herein and the Company cannot be held responsible for any omission, mistake nor for any loss or damage including without limitation to any loss of profit which may arise from reliance on any information supplied by TFA Global Pte Ltd.
The speaker(s) is neither an employee, agent nor representative of Tradu and is therefore acting independently. The opinions given are their own, constitute general market commentary, and do not constitute the opinion or advice of Tradu or any form of personal or investment advice. Tradu neither endorses nor guarantees offerings of third-party speakers, nor is Tradu responsible for the content, veracity or opinions of third-party speakers, presenters or participants.
CKBUSDT Enters Critical Accumulation Zone – Multi-X Rebound🧠 Overview:
After a prolonged downtrend throughout early 2025, CKB/USDT has now returned to a major macro support zone between $0.0026 – $0.0035 — a historically strong accumulation range seen during 2022–2023. This area has previously triggered powerful rallies, and once again, the market is flashing early signs of a potential trend reversal.
📈 Bullish Scenario (Potential Rebound):
1. Well-Tested Demand Zone:
The area between $0.0026 – $0.0035 has acted as a long-term floor multiple times over the past 2 years.
This suggests strong institutional accumulation or smart money positioning.
2. Rising Volume Could Confirm Trend Reversal:
A surge in volume from this range could validate a transition into a markup phase (Wyckoff Theory).
3. Stair-Step Rally Potential:
Immediate resistance: $0.0050 – $0.0058
Mid-term target: $0.0076 – $0.0090
Major breakout zone: $0.0127 – $0.0180
4. Technical Projection:
Formation of a Double Bottom or Inverse Head & Shoulders could signal a strong macro reversal.
If confirmed, price could aim for $0.027 – $0.038+ in the longer term.
5. Market Sentiment & Timing:
Historically, altcoins like CKB rally after Bitcoin dominance cools off or when BTC moves sideways.
📉 Bearish Scenario (Breakdown Risk):
1. Losing Macro Support:
If price breaks below $0.0026, further downside may accelerate toward sub-$0.0020 levels.
2. Fakeouts Without Volume:
A weak bounce from support without volume could indicate a bull trap or short-term relief rally only.
3. Sideways Risk:
Extended consolidation or ranging may continue for weeks if there’s no strong catalyst or market-wide recovery.
📐 Structure & Pattern Insights:
Long-Term Accumulation Range: The current price action mirrors the accumulation phase from 2022–2023, possibly forming a Wyckoff Re-accumulation structure.
Reversal Patterns Forming: With a potential higher low next week, we may see an Inverse Head & Shoulders begin to take shape.
📝 Conclusion:
CKB is currently in a "high-reward, low-risk" zone from a swing trader’s perspective. Price is near macro bottom levels, and any breakout from here could result in multi-fold returns in the medium to long term.
However, confirmation through volume and structure breakout is essential. Without that, the risk of prolonged ranging or deeper correction remains.
#CKBUSDT #CKB #AltcoinSeason #CryptoBreakout #TechnicalAnalysis #InverseHeadAndShoulders #WyckoffAccumulation #BullishReversal #CryptoGems #CryptoSetup

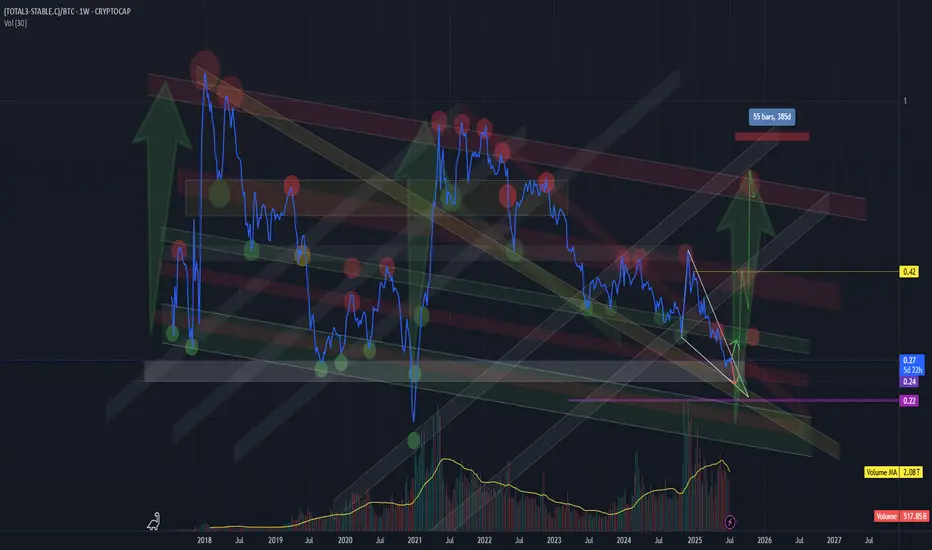
True altcoin-to-BTC strength indicator(CRYPTOCAP:TOTAL3-CRYPTOCAP:STABLE.C)/CRYPTOCAP:BTC
This formula strips out the noise and gives a true altcoin-to-BTC strength indicator.
STABLE.C removes all major stable coins (USDT, USDC, DAI, etc.).
The chart clearly shows previous capitulation zones and launch points for altseasons since 2017
Current formation – potential triangle:
Market makers appear to be coiling price action, forming a triangle-like structure.
This often precedes a volatile breakout — likely to the upside if history repeats.
Market psychology:
Many traders are already heavily positioned in altcoins, which suggests we could be nearing final capitulation.
Historically, altseasons never began with euphoria — but rather fear, exhaustion, and apathy.
BTC halving occurred in April 2024, and typically, the peak of the altseason follows 12 to 16 months later.
The seasonal strength of Q4, often fuels altcoin rallies.
!!! A final washout into a key support zone (on this ratio) could mark the trigger for the next major altseason — possibly starting around August 2025 !!!!!!!!