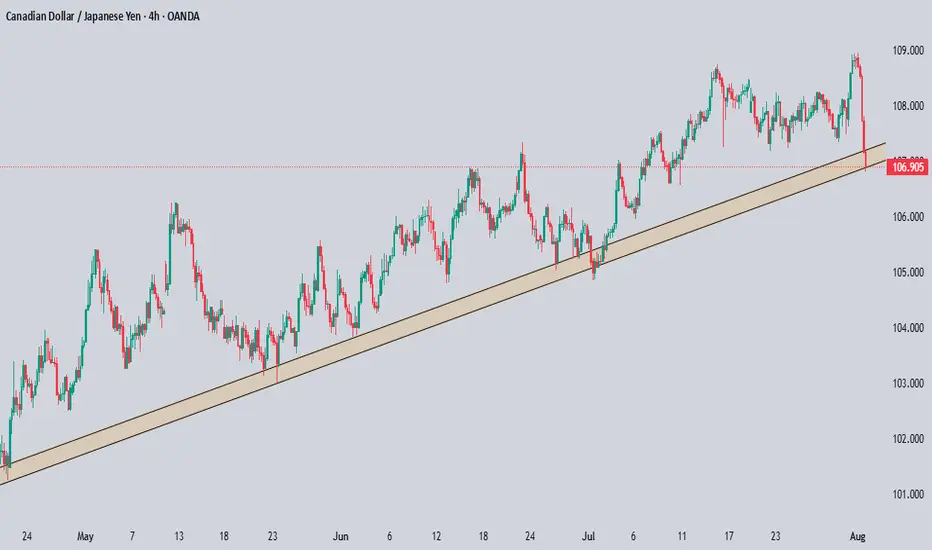
CARRY TRADE RISK IT IS SHOWING CRACKSThe chart posted in my work on TSXV:USS yen I have NOT CHANGED THE WAVE STRUCTURE AT ALL take notice of my statement CRASH COMING
Harmonic Patterns

AUDUSD Technical & Order Flow AnalysisOur analysis is based on a multi-timeframe top-down approach and fundamental analysis.
Based on our assessment, the price is expected to return to the monthly level.
DISCLAIMER: This analysis may change at any time without notice and is solely intended to assist traders in making independent investment decisions. Please note that this is a prediction, and I have no obligation to act on it, nor should you.
Please support our analysis with a boost or comment!

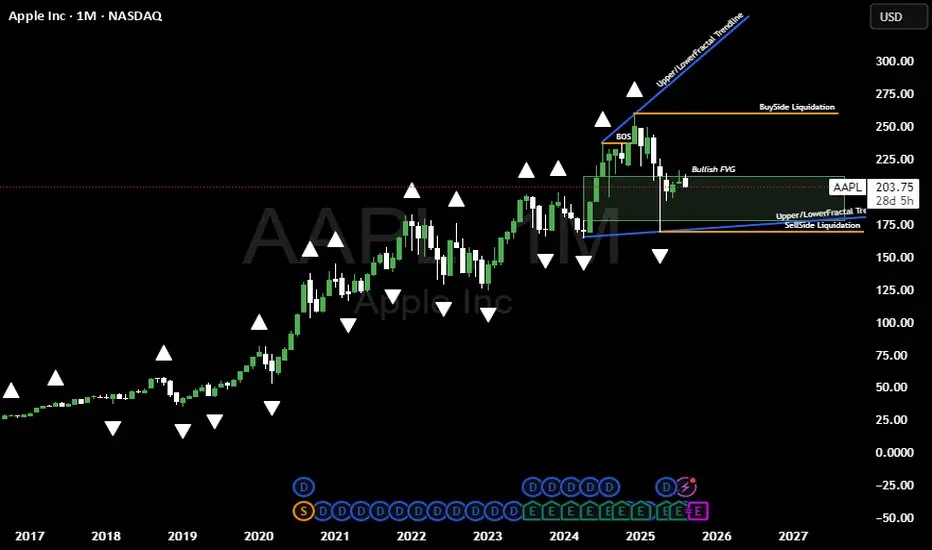
Bullish Idea on APPLNASDAQ:AAPL / Lovley day its been a while, am planing to share my views on the markets atleast once a week from now going forward. Basically on this bias idea above here @LutthMage we are leaning more on long term holding, WITH AN ADVANTAGE OF TAKING SHORT TERM TRADES BASED ON OUR LONG TERM INVESTMENT IDEA WE ARE SURE YOU WILL UNDERSTAND AS TIME GOES BY.
NOW LET THE GAMES BEGIN```
On the chart above we a basically bullish due to 4 reasons
1. The trend is our friend its currently bullish, because AAPL is BREAKING STRUCTURE NO VISIBLE Change of character as of yet
2. We got a widening channel currenly bouncing of the lower level line of the channel.
3. Price is playing around a Bullish FVG
4. APPLE JUST CREATED SELL SIDE LIQUIDITY.
We will keep you posted on the short term trades we execute based on this bullish bias on APPL, ofcourse only if they do appear for now we sit and do the hardest thing to do wich is NOTHING.
AS TIME GOES BY YOU WILL CHARACTERIZE A WASH RINSE AND REPEAT PROCESS FROM US @LutthMage NASDAQ:AAPL
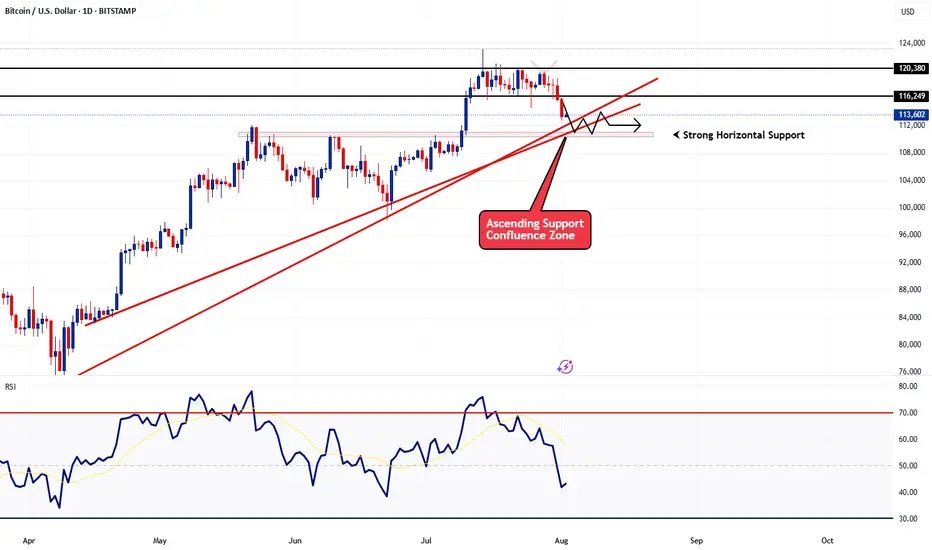
BTCUSD - Follow Up AnalysisTaking a look at the daily chart, price action did come down as previously expected in my last article.
Now we're heading into an area of strong support and I expect to see some sideways action until something significant happens next.
How I'm trading this price action?
I believe price action may continue to bounce around from the current price of 113,600 down to 110,000 for at least the next few days. With that said I'm implementing my range trading strategy. The range trading strategy also known as the Bitcoin Scalper scalps on the 1 and 5min timeframe creating sort of like a grid style approach but it's based on candlestick momentum. Since it trades off momentum, it's able to detect breakouts and know when to switch from the ranging strategy to the breakout strategy.
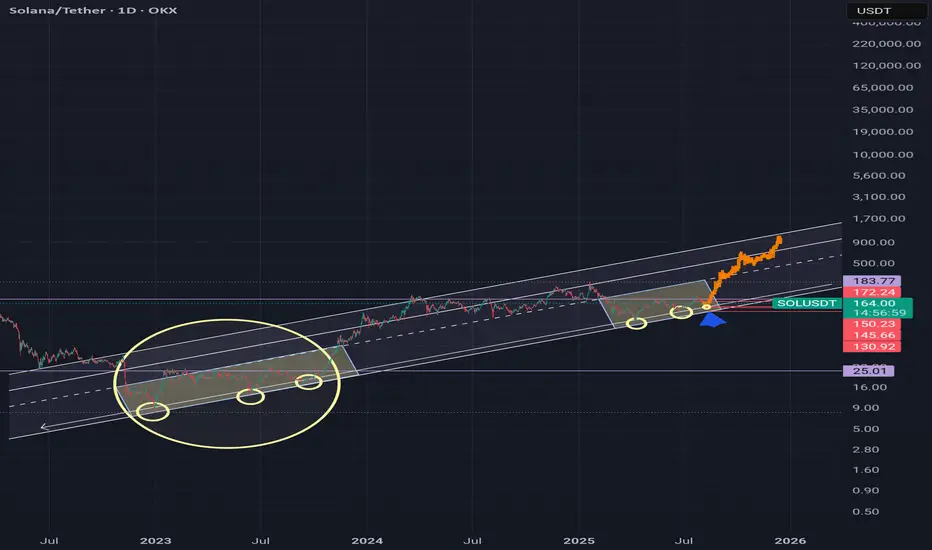
Longterm Uptrend still in a Process!Look at 3 contact below.
Currently price avout to put 3rd touch to lower zone of trend and it marks to $148-$151.
After that upside move will start to gain momentum in my opinion.
Macro view is still bullish roughly above $150.
AAVE Daily Chart – Key Buy Zone & Two ScenariosAAVE is currently moving within a well-defined ascending channel on the daily timeframe. The last major bullish leg began from the $120 support and surged nearly +180% to a local high near $330.
Now, after a 25% pullback, price is consolidating around the midline of the channel near $250. More importantly, there’s a strong bullish order block sitting between $220–230, making this a low-risk buy zone with a stop below the order block.
🔸 Scenario 1 (bullish preferred):
Price dips into the $220 OB zone, completes a possible ABC correction, and launches a new bullish leg targeting the channel top above $500.
🔸 Scenario 2 (bearish alternate):
If the $220 order block fails, deeper correction could follow toward the channel bottom near $135.
⏳ This is a critical area to watch for reaction – Smart Money will likely show its hand soon.
🔗 Analysis by CryptoPilot

ITC 1D🔺 Triangle Pattern (likely Symmetrical/Ascending Triangle)
Current Price Zone: ₹416
Pattern Type: Likely Ascending Triangle (if higher lows are forming against a horizontal resistance)
Resistance Level: Around ₹416–420
Breakout Confirmation: Needs a strong bullish candle above resistance with significant volume.
📊 What to Watch:
Volume:
A genuine breakout should happen with above-average volume. Watch the 50-period or 20-period average volumes on daily or 1H chart.
Breakout Candle:
Should close above ₹420 ideally. A breakout without closing above resistance is risky.
Retest Possibility:
Sometimes, price may break out and retest the breakout level before continuing the uptrend. Don’t panic if it slightly dips and holds support near ₹416.
🎯 Target Levels After Breakout:
You can calculate the triangle breakout target like this:
Target = Height of triangle + Breakout point
Let’s assume the base of triangle is from ₹375 to ₹416 = ₹41 range
Breakout Target = ₹416 + ₹41 = ₹457
📌 Extended Target (Momentum-based): ₹475–₹500 zone
📌 If volumes + broader market support: ₹500+ is possible, especially in swing or positional setups.
📉 Invalidation (Risk Management):
If after breakout, price falls below ₹410–408 with volume, it could be a false breakout.
Keep a stop-loss below previous swing lows or support trendline.
🧠 Summary:
✅ Triangle breakout with volume = bullish confirmation
🎯 Targets: ₹457 → ₹475 → ₹500
❗ Risk zone: below ₹410
🔁 Retest is common before upmove continues
Disclaimer: The information provided is for educational and informational purposes only and should not be considered as financial advice. Investing in the stock market involves risk, and past performance is not indicative of future results. Please consult with a certified financial advisor or conduct your own research before making any investment decisions. We are not responsible for any losses incurred as a result of using this information. Stock market investments are subject to market risks; read all related documents carefully.

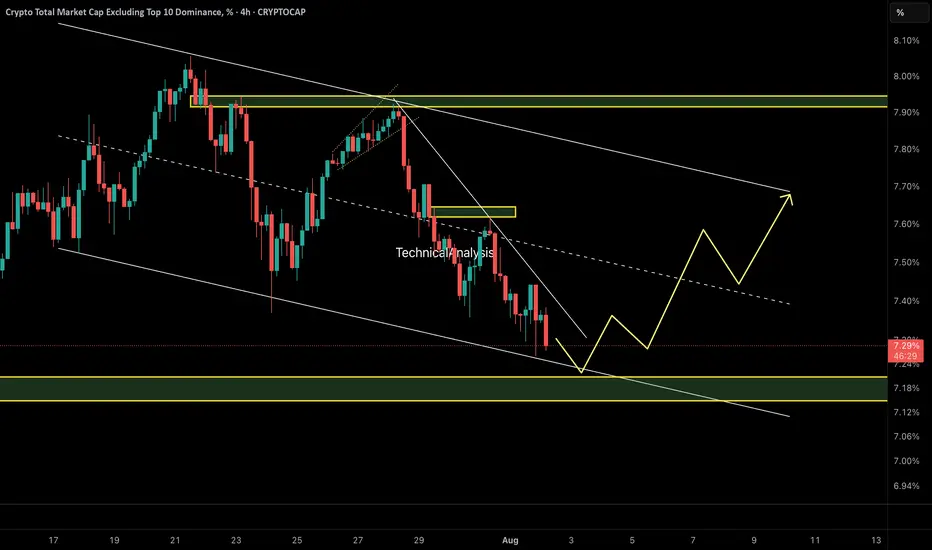
OTHERS.D – Perfect Reaction to Previous AnalysisAs predicted in the last update, OTHERS.D broke structure and dropped sharply toward the 7.20% demand zone — exactly as expected.
Now, we’re waiting for a potential bullish reaction from this key area. If demand holds, a move toward the upper channel boundary (~7.70%) could follow.
🧭 Technical Outlook:
• Price tapped into a key demand zone at 7.20%, which aligns with the lower boundary of a descending channel.
• A bullish reaction is forming, suggesting short-term strength in altcoins.
• A move toward the channel top near 7.70% is now on the table if demand holds.
⚠️ Important Note:
This move is likely to remain a corrective rally unless we see a proper breakout above 7.70% with volume and structure shift. Be selective with altcoin longs.
🔍 Watch for:
• Reaction at 7.50% midline
• Price behavior at 7.70% resistance
• Structure shift or failure pattern near channel top
⚠️ Caution: This remains a corrective rally unless price breaks 7.70% with structure shift.
🔗 Analysis by CryptoPilot
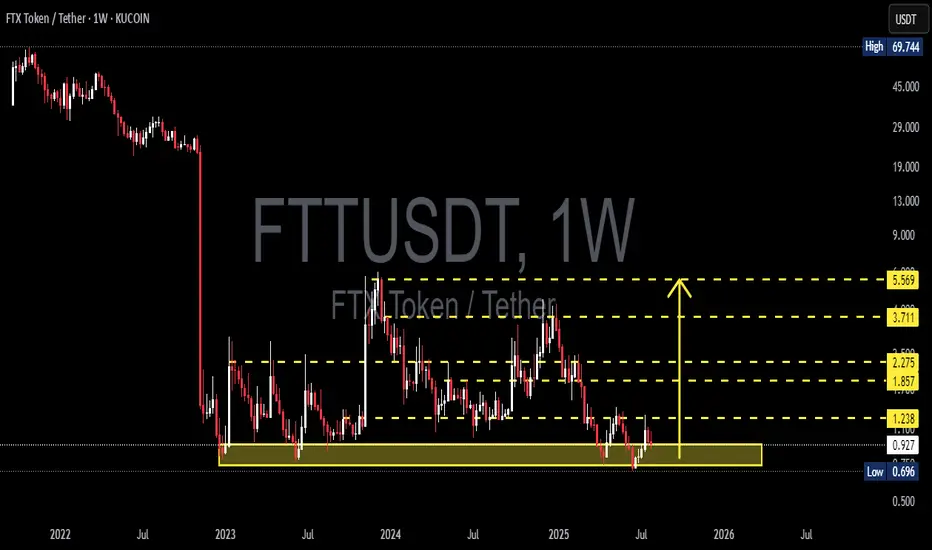
FTTUSDT at the Edge! Breakdown or Massive Breakout?📌 Overview: A Rebirth from the Dead Zone
FTT/USDT is currently in one of its most technically compelling phases in the past two years. After suffering a catastrophic 98% crash following the collapse of the FTX ecosystem in 2022, price action now shows signs of long-term accumulation at a historically strong demand zone — potentially forming a solid base for a medium to long-term recovery.
The crucial support zone between $0.70 and $0.90 has been tested multiple times since late 2022 and has consistently held against extreme sell pressure. This suggests the presence of a strong historical demand area. Now that the price is once again reacting bullishly from this zone, the door is opening for a potential technical rebound.
---
🧠 Forming Pattern: Accumulation & Bottoming Structure
1. Base Accumulation Range:
A long period of sideways movement after the major crash.
Indicates exhaustion of selling pressure and possible stealth accumulation by smart money.
2. Potential Double Bottom or Rounded Bottom:
If this rebound holds, a double bottom could be confirmed with a breakout above $1.238.
A rounded bottom formation could signal a major reversal rally if backed by volume and catalysts.
---
🟢 Bullish Scenario (Reversal in Progress):
If buyers hold the current support and push through resistance levels:
🔓 Break above $1.238 = key reversal confirmation.
🚀 Potential bullish targets:
$1.857 – Previous minor resistance.
$2.275 – Former breakout zone.
$3.711 – Key structural level with historical liquidity.
$5.569 – Major psychological and technical target.
Strong confirmation if the breakout is supported by volume and a full-bodied weekly candle.
---
🔴 Bearish Scenario (Further Downside):
If price fails to hold the support zone:
📉 A breakdown below $0.696 would invalidate the bullish setup and could lead to:
New price discovery below $0.50
A potential “death spiral” if sell volume increases rapidly.
This scenario is extreme and would heavily depend on broader market sentiment and the future of the FTX recovery process.
---
🧭 Key Levels & Technical Insights:
Element Details
Strong Demand Zone $0.70 – $0.90 (multi-tested since 2022)
Bullish Trigger Level Break & retest of $1.238 with volume
Reversal Targets $1.857, $2.275, $3.711, and $5.569
Bearish Breakdown Loss of $0.696 = potential for new lows
Early Momentum Current bounce suggests possible start of reversal
---
💡 Final Thoughts:
> "FTT is no longer in a panic phase — it’s in a decision phase: will it rise as a ‘Phoenix Token’ from the ashes of FTX, or fall back into obscurity?"
Given the technical setup and long-term structure, this could be one of the most pivotal moments for FTT. Traders and investors should watch this level closely — the next major move is likely to begin from this very zone.
#FTTUSDT #FTTAnalysis #CryptoReversal #AltcoinWatch #TechnicalAnalysis #SupportResistance #BullishSetup #BearishScenario #DoubleBottom
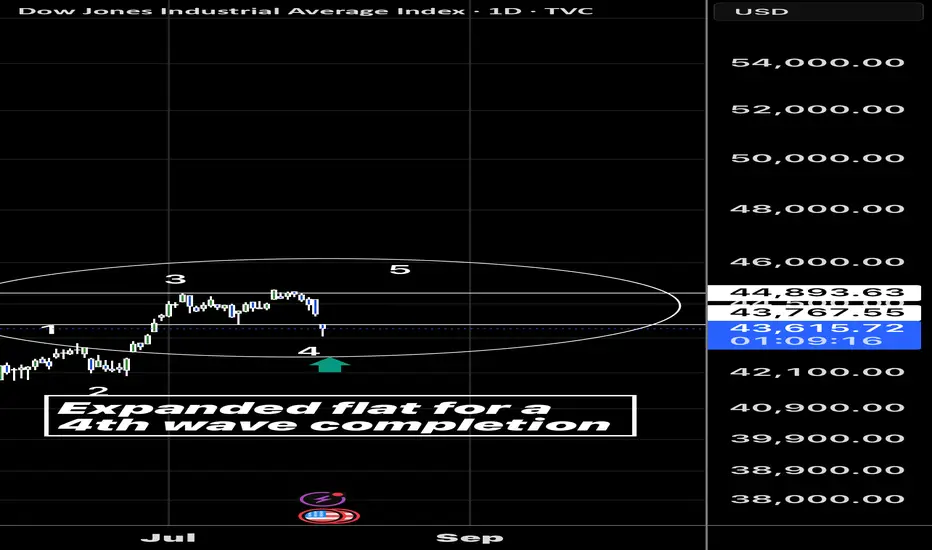
Expanded flat on the Dow for 4th wave completion? If it is we can see some new highs… a close back above 43760 today would set it up
QKCUSDT Forming Bullish PennantQKCUSDT is exhibiting a bullish pennant pattern, a highly regarded continuation formation that signals the potential for another significant upward move following its previous bullish momentum. This pattern typically reflects a brief consolidation period where price action narrows before a breakout occurs in the direction of the prior trend. The tightening range seen in QKC is a positive sign that buyers are holding ground and preparing for the next wave upward.
The trading volume on QKCUSDT has remained consistently healthy, which is a critical component in validating bullish patterns. A breakout above the pennant resistance with a surge in volume could act as the catalyst for a rapid price acceleration. The projected gain of 30% to 40% is aligned with typical outcomes from this pattern, particularly in bullish crypto market conditions.
Market sentiment around QKC is beginning to heat up, with more retail and technical traders identifying its potential. The increasing interest from investors signals rising confidence in the project, supported by improved liquidity and stronger community backing. This adds fundamental strength to the technical setup, further supporting the bullish outlook.
With favorable market structure, good volume, and growing investor attention, QKCUSDT appears to be on the verge of a breakout. Traders watching this setup should keep a close eye on key resistance levels and volume spikes, as these will likely dictate the timing and strength of the next move.
✅ Show your support by hitting the like button and
✅ Leaving a comment below! (What is You opinion about this Coin)
Your feedback and engagement keep me inspired to share more insightful market analysis with you!

CADJPY Technical & Order Flow AnalysisOur analysis is based on a multi-timeframe top-down approach and fundamental analysis.
Based on our assessment, the price is expected to return to the monthly level.
DISCLAIMER: This analysis may change at any time without notice and is solely intended to assist traders in making independent investment decisions. Please note that this is a prediction, and I have no obligation to act on it, nor should you.
Please support our analysis with a boost or comment!
[SeoVereign] BITCOIN BULLISH Outlook – August 1, 2025We are the SeoVereign Trading Team.
With sharp insight and precise analysis, we regularly share trading ideas on Bitcoin and other major assets—always guided by structure, sentiment, and momentum.
🔔 Follow us to never miss a market update.
🚀 Boosts provide strong motivation and drive to the SeoVereign team.
--------------------------------------------------------------------------------------------------------
Hello.
This is SeoVereign.
My fundamental view on Bitcoin, as mentioned in the previous idea, is that I am anticipating an overall downward trend. In the mid- to long-term, I believe the downward pressure will gradually increase, and this is partially confirmed by various indicators and the overall market sentiment.
However, before we fully enter this downward phase, I have been judging that one more upward wave is likely to remain. I have focused my strategy on capturing this upward segment, and I have recently reached a point where I can specifically predict the development of that particular wave.
If this upward move unfolds successfully, I plan to set my take-profit range conservatively. The reason is simple: I still believe there is a high possibility that the market will shift back into a downtrend afterward. The core of this strategy is to minimize risk while realizing profits as efficiently as possible toward the tail end of the wave.
The relevant pattern and structure have been marked in detail on the chart, so please refer to it for a clearer understanding.
In summary, I view this rise as a limited rebound that could represent the last opportunity before a downturn, and I believe this idea marks the beginning of that move.
I will continue to monitor the movement and update this idea with additional evidence. Thank you.

xauusd buybuy xauusd
XAUUSD
idea order block active with high volume here
and it back to test it
OANDA:XAUUSD

SPX500 - Bearish Crab Pattern- Price completed a perfect Crab Pattern, yet we all got to August 1st (second) liberation day
- If bad mood continues, we can expect a correction:
A. (positive) down to 6150-6000
B. (negative) down to 5800
Just my humble opinion

TRXUSDT Short Trade - Price CorrectionsBINANCE:TRXUSDT Short Day Trade - Low Risk, with my back testing of this strategy, it hits multiple possible take profits, manage your position accordingly.
Note: Manage your risk yourself, its risky trade, see how much your can risk yourself on this trade.
Use proper risk management
Looks like good trade.
Lets monitor.
Use proper risk management.
Disclaimer: only idea, not advice

BLACKBERRY BBBREAKOUT OF DESCENDING TRENDLINE COULD SEE 22$-24$
BlackBerry today is a Canadian technology company specializing in cybersecurity software and Internet of Things (IoT) services for enterprises and governments worldwide. Formerly renowned as a mobile device manufacturer, BlackBerry Limited (formerly Research In Motion, RIM) exited the smartphone business in 2016 and now focuses on secure communications, endpoint management, and embedded systems, especially for industries like automotive, healthcare, and government.
Company Profile & Business
Headquarters: Waterloo, Ontario, Canada
Core products: Cybersecurity solutions, BlackBerry Unified Endpoint Management (UEM), QNX operating systems, secure messaging (BlackBerry Messenger Enterprise, BBMe), and automotive software platforms.
Global presence: Products and services are sold worldwide across the Americas, Europe, Middle East, Africa, and Asia-Pacific.
Recent Financials & Stock
Stock ticker: NYSE/TSX: BB
Recent price: As of July 30, 2025, BlackBerry closed at $3.74 per share, reflecting a decline from earlier in the month. Price targets for the company now range from $2.71 to $4.75, with analysts citing positive revenue growth and the company's first positive cash flow in three years after its recent quarterly results.
Business momentum: The company recently posted about 10% higher revenue compared to forecasts for the third quarter fiscal year 2025, with a shift to positive earnings and cash flow—highlighting improvements in its cybersecurity and IoT software businesses.
Notable News & Developments
End of smartphones: BlackBerry-branded mobile devices are officially discontinued. The company fully exited the hardware business by 2018 and stopped supporting BlackBerry 10 in 2022.
Nostalgia revival: In 2025, a separate company (Zinwa Technologies) is reviving classic BlackBerry devices (like the BlackBerry Classic and Passport) by retrofitting them with modern Android internals. These are not officially affiliated with BlackBerry Limited, but appeal to enthusiasts for the classic design and QWERTY keyboard, albeit with privacy caveats due to non-BlackBerry software.
Enterprise focus: BlackBerry remains a leader in secure software for businesses, including automotive OS (QNX), endpoint security, and secure messaging. Major clients include automotive OEMs, financial corporations, and government agencies.
Quick Facts Table
Aspect Details
Industry Cybersecurity, IoT software, enterprise services
Founded 1984 (as Research In Motion, Canada)
Consumer Phones Discontinued; brand revived unofficially by others
Current Stock Price $3.74 (July 30, 2025)
Latest Product Focus Automotive software, secure endpoint management
BlackBerry is no longer a phone maker, but remains a significant player in secure enterprise and automotive software, with stock prices and business outlook reflecting its transition into these fields.
Zinwa Technologies is a Chinese technology company that has gained attention in 2025 for its project to revive classic BlackBerry smartphones, specifically the BlackBerry Classic (also known as the Q20), under its own branding. Unlike BlackBerry Limited (which no longer makes hardware), Zinwa has purchased batches of old BlackBerry Q20 devices—both new-old-stock and used units from supply chains in Hong Kong—and is refurbishing them with entirely new internal components while retaining the iconic design features such as the physical QWERTY keyboard and 720x720 touchscreen.
Key Details on Zinwa Technologies’ BlackBerry Revival:
Project Name/Models: The updated phone is called the Zinwa Q25 (2025 is referenced in the model name). Zinwa is also planning to modernize other BlackBerry devices, including the KEYone (“K25”) and the Passport (“P25” or “P26”).
What’s Modernized?: The original shell, keyboard, notification LED, and display remain, but Zinwa installs a new motherboard with a MediaTek Helio G99 processor, 12GB RAM, 256GB storage (expandable), a 50MP rear camera, 8MP front camera, a new 3,000mAh battery, and global 4G LTE support. There is a USB-C port, headphone jack, microSD support, and the phone runs Android 13 (with no confirmed plans for updates to later Android versions).
How It’s Sold: Two options are offered—a fully assembled Zinwa Q25 smartphone for $400, or a $300 conversion kit for those who already own a BlackBerry Classic and want to upgrade themselves. Both are expected to ship in August 2025.
Nostalgia Meets Modern Tech: The initiative targets fans of physical keyboards and retro gadgets as well as a new wave of Gen Z users seeking “digital detox” devices. The device is positioned as a niche product for enthusiasts rather than a mass-market flagship.
No Connection to BlackBerry Limited: Zinwa Technologies has not acquired the BlackBerry brand or company; its project is independent and relies on recycling and upgrading old BlackBerry hardware.
Future Plans: Zinwa has stated it may refresh additional BlackBerry models based on demand and feedback, following the Q25 release.
In sum, Zinwa Technologies is bringing back the BlackBerry Classic as a refreshed, Android-powered device for technology enthusiasts and nostalgia seekers, reflecting a trendy intersection of retro design and modern smartphone capabilities in 2025.
#BB

#DOGE Update #3 – July 29, 2025#DOGE Update #3 – July 29, 2025
I’m still holding my Doge position and haven’t been stopped out. I plan to lower my average cost by adding to the position at potential reversal zones. This is how I intend to proceed. My entry level is currently $0.2583, and my target is $0.2986, which means I’m aiming for roughly a 15% profit.
At the moment, the price has pulled back about 11% from that level. There’s nothing to worry about—it’s perfectly normal. Doge is continuing its movement by taking support from the bottom of an upward trend. I’m still in the position and planning to exit with profit without setting a stop.

RPLUSDT Forming Strong Bullish StructureRPLUSDT is currently showing a strong bullish structure, with price action reclaiming a key support zone after a temporary retracement. The chart reveals a textbook market cycle with higher highs and higher lows, indicating a possible continuation of the uptrend. The current price level is sitting just above a key demand zone, previously tested and confirmed as strong support. This confluence area may act as a springboard for a potential move toward the 60% to 70% target gain zone, aligning with broader bullish sentiment seen across mid-cap altcoins.
Volume indicators are supportive of this move, suggesting that accumulation is underway. Increased investor interest in RPL is likely tied to its integral role in Ethereum’s liquid staking ecosystem, as Rocket Pool continues to gain adoption. With ETH staking steadily growing, projects like RPL tend to benefit from fundamental tailwinds. This kind of sector strength combined with favorable technicals gives the current setup more credibility and potential for follow-through.
The technical projection suggests that if momentum holds and buyers maintain control above the support range around $6.70–$7.00, then the next leg could push RPLUSDT beyond $12.00. That represents a 70%+ move from current levels, which aligns with the Fibonacci extension and measured move projections derived from previous breakout zones. Traders should keep a close eye on volume confirmation and potential breakout candles above minor resistance near $7.50.
This setup offers a well-defined risk-to-reward ratio for swing traders and position holders alike. With the current crypto market regaining traction, RPL is positioned as a high-potential candidate for strong upside if broader conditions remain favorable.
✅ Show your support by hitting the like button and
✅ Leaving a comment below! (What is You opinion about this Coin)
Your feedback and engagement keep me inspired to share more insightful market analysis with you!

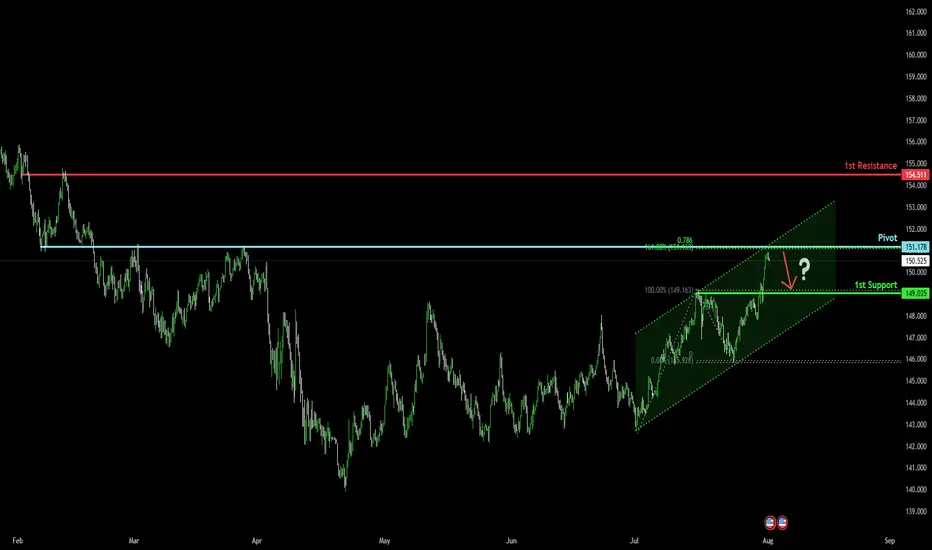
Bearish reversal off overlap resistance?USD/JPY is rising towards the pivot, which has been identified as an overlap resistance and could drop to the 1st support.
Pivot: 151.17
1st Support: 149.03
1st Resistance: 154.51
Risk Warning:
Trading Forex and CFDs carries a high level of risk to your capital and you should only trade with money you can afford to lose. Trading Forex and CFDs may not be suitable for all investors, so please ensure that you fully understand the risks involved and seek independent advice if necessary.
Disclaimer:
The above opinions given constitute general market commentary, and do not constitute the opinion or advice of IC Markets or any form of personal or investment advice.
Any opinions, news, research, analyses, prices, other information, or links to third-party sites contained on this website are provided on an "as-is" basis, are intended only to be informative, is not an advice nor a recommendation, nor research, or a record of our trading prices, or an offer of, or solicitation for a transaction in any financial instrument and thus should not be treated as such. The information provided does not involve any specific investment objectives, financial situation and needs of any specific person who may receive it. Please be aware, that past performance is not a reliable indicator of future performance and/or results. Past Performance or Forward-looking scenarios based upon the reasonable beliefs of the third-party provider are not a guarantee of future performance. Actual results may differ materially from those anticipated in forward-looking or past performance statements. IC Markets makes no representation or warranty and assumes no liability as to the accuracy or completeness of the information provided, nor any loss arising from any investment based on a recommendation, forecast or any information supplied by any third-party.
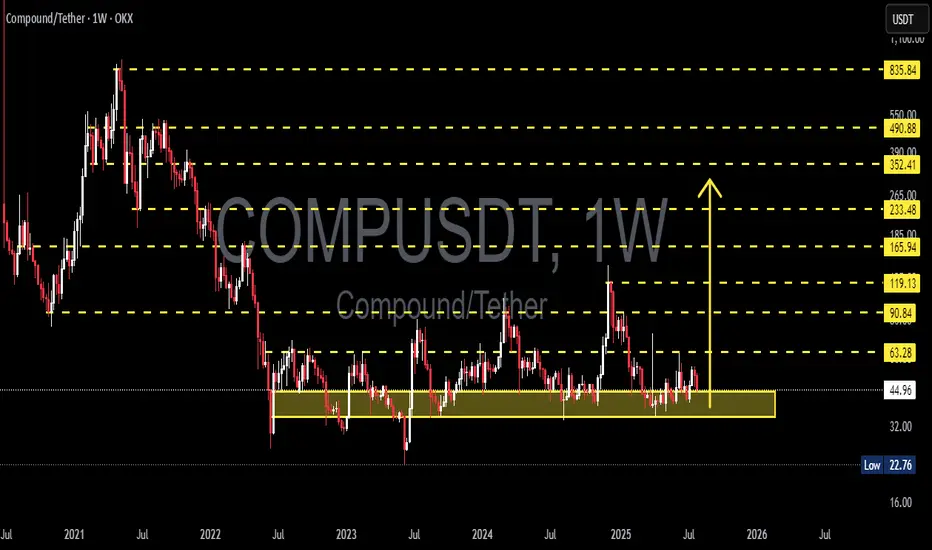
COMPUSDT in a Strong Demand Zone! Reversal Potential / Breakdown🔍 In-Depth Analysis (Timeframe: Weekly / 1W)
The COMP/USDT pair is currently hovering above a long-term demand zone that has held strong since mid-2022. Price is sitting around $44.90, just above the key support area of $32 – $45 (highlighted in yellow), which has acted as a major accumulation zone for over 2 years.
🧱 Critical Zone: Smart Money Accumulation or Exhaustion?
The $32–$45 demand zone has been tested multiple times, indicating smart money interest and hidden buying pressure.
Price action in this range forms a clear base structure or horizontal accumulation pattern, a classic setup before a large directional move.
However, the prolonged sideways consolidation hints at an imminent breakout or breakdown — momentum is building.
---
📊 Key Technical Pattern:
🟨 Rectangle Range (Accumulation Structure)
Price has been ranging between $32 and $63.28 with no clear breakout.
Strong rejections every time price dips below $35 indicate consistent buyer defense.
🔃 Mean Reversion Behavior
Repeated moves back to the mid-range reflect an indecisive market (equilibrium phase), often seen before expansion.
---
📈 Bullish Scenario (Potential Reversal):
If price breaks above major resistance at $63.28:
1. Upside Targets:
🎯 $90.84 (key resistance zone)
🎯 $119.13 (prior distribution zone)
🎯 $165.94 (macro target if sentiment turns highly bullish)
2. Confirmation needed via weekly close above $63 with strong volume.
3. A bullish breakout may form a new Higher Low and Higher High structure on both daily and weekly timeframes.
🟢 Bullish confirmation: Weekly bullish engulfing + volume breakout above $63.
---
📉 Bearish Scenario (Potential Breakdown):
If price closes below the $32 support:
1. Possible downside targets:
⚠️ $22.76 (next logical support)
🚨 $16 (last consolidation base pre-2021 rally)
2. A break below this long-term support could trigger a final capitulation flush before a potential macro reversal.
🔴 Bearish confirmation: Weekly close below $32 with increased volume and sustained selling.
---
⚖️ Strategic Takeaway:
COMP/USDT is currently at a pivotal decision zone — a crossroads between massive upside potential and deeper downside risk.
This is not just another support area, it’s a macro-level demand zone that will likely dictate trend direction in the coming months.
⏳ A major move is brewing — whether breakout or breakdown, be ready.
#COMPUSDT #CryptoOutlook #TechnicalAnalysis #AltcoinSeason #DeFi #CryptoTrading #AccumulationZone #BreakoutSetup #BearishScenario #BullishSetup #CryptoAnalysis
QTUM/USDT – Make or Break? Testing the Edge of Accumulation?🧠 Overview:
After going through a volatile multi-year cycle, QTUM is now back at one of the most critical historical support zones. This demand area has acted as a strong reversal point multiple times since 2020 and is once again being tested as price consolidates near the bottom of its macro range.
---
📉 Price Structure & Key Levels:
📍 Major Support Zone (1.70 – 2.10 USDT):
A proven accumulation zone based on multiple long wicks and price rejections in the past.
This is where smart money tends to accumulate during market uncertainty.
📍 Layered Resistance Levels (Bullish Targets):
2.70 USDT → Initial breakout validation
3.53 USDT → Mid-range resistance
4.93 USDT → Key structural level
8.70 USDT → Mid-term breakout target
17.36 USDT → Peak from previous macro cycle
---
🧩 Current Pattern: "Sideways Accumulation Range"
QTUM is clearly in a range-bound accumulation phase, with tight price action within a key support area. Historically, such patterns often precede large impulsive moves, especially when accompanied by volume surges and breakouts from structure.
> ⚠️ Important Note: Sideways movement at historical support, combined with increasing accumulation volume, often leads to a breakout into the markup phase.
---
📈 Bullish Scenario: Potential Upside Momentum
Trigger: A confirmed breakout and weekly candle close above 2.70 USDT.
Additional Confirmation: Strong bullish candle with increased volume.
Targets:
3.53 USDT (local resistance)
4.93 USDT (mid-range structural level)
8.70 USDT (swing target)
17.36 USDT (macro cycle high)
🎯 High reward-to-risk potential if entries are made near support with a stop-loss under 1.70 USDT.
---
📉 Bearish Scenario: Breakdown Risk
Trigger: Weekly candle closes below 1.70 USDT.
Implication: Breakdown from long-term demand zone.
Downside Targets:
1.20 USDT → Minor horizontal support
0.71 USDT → Historical all-time low
Warning Sign: High volume breakdown = likely sign of institutional selloff or panic exit.
---
📊 Strategic Summary:
> QTUM is at a pivotal crossroads.
The 1.70 – 2.10 USDT range is a decisive area.
A bullish breakout could spark a major recovery rally,
while a breakdown may lead to a deeper capitulation.
This is a “calm before the storm” situation. Traders should monitor closely as the next few weekly candles could define the trend for the rest of 2025.
#QTUMUSDT #QTUM #CryptoAnalysis #AltcoinSetup #TechnicalAnalysis #AccumulationPhase #SupportAndResistance #BreakoutPlay #CryptoBreakout
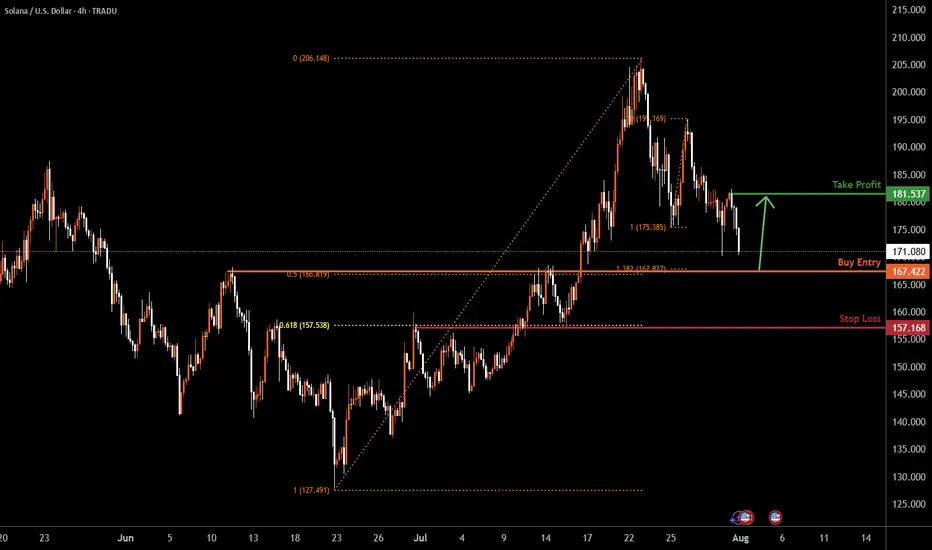
SOLUSD H4 | Bullish bounceBased on the H4 chart analysis, the price could fall to the buy entry, which acts as a pullback support that aligns with the 50% Fibonacci retracement and the 138.2% Fibonacci extension and could bounce to the upside.
Buy entry is at 167.42, which is a pullback support that aligns with the 50% Fibonacci retracement and the 138.2% Fibonacci extension.
Stop loss is at 157.16, which is an overlap support that aligns with the 61.8% Fibonacci retracement.
Take profit is at 181.53, which is a pullback resistance.
High Risk Investment Warning
Trading Forex/CFDs on margin carries a high level of risk and may not be suitable for all investors. Leverage can work against you.
Stratos Markets Limited (tradu.com ):
CFDs are complex instruments and come with a high risk of losing money rapidly due to leverage. 65% of retail investor accounts lose money when trading CFDs with this provider. You should consider whether you understand how CFDs work and whether you can afford to take the high risk of losing your money.
Stratos Europe Ltd (tradu.com ):
CFDs are complex instruments and come with a high risk of losing money rapidly due to leverage. 66% of retail investor accounts lose money when trading CFDs with this provider. You should consider whether you understand how CFDs work and whether you can afford to take the high risk of losing your money.
Stratos Global LLC (tradu.com ):
Losses can exceed deposits.
Please be advised that the information presented on TradingView is provided to Tradu (‘Company’, ‘we’) by a third-party provider (‘TFA Global Pte Ltd’). Please be reminded that you are solely responsible for the trading decisions on your account. There is a very high degree of risk involved in trading. Any information and/or content is intended entirely for research, educational and informational purposes only and does not constitute investment or consultation advice or investment strategy. The information is not tailored to the investment needs of any specific person and therefore does not involve a consideration of any of the investment objectives, financial situation or needs of any viewer that may receive it. Kindly also note that past performance is not a reliable indicator of future results. Actual results may differ materially from those anticipated in forward-looking or past performance statements. We assume no liability as to the accuracy or completeness of any of the information and/or content provided herein and the Company cannot be held responsible for any omission, mistake nor for any loss or damage including without limitation to any loss of profit which may arise from reliance on any information supplied by TFA Global Pte Ltd.
The speaker(s) is neither an employee, agent nor representative of Tradu and is therefore acting independently. The opinions given are their own, constitute general market commentary, and do not constitute the opinion or advice of Tradu or any form of personal or investment advice. Tradu neither endorses nor guarantees offerings of third-party speakers, nor is Tradu responsible for the content, veracity or opinions of third-party speakers, presenters or participants.