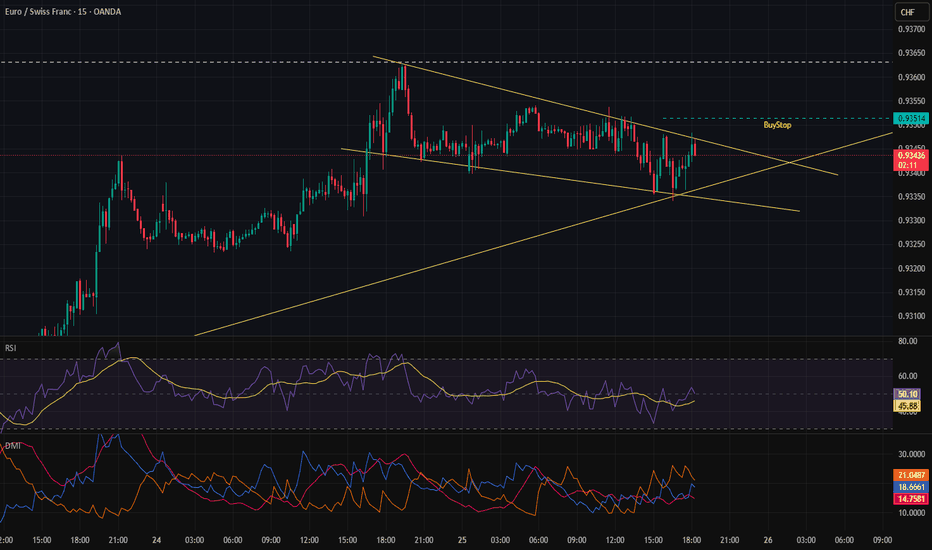
#CADJPY:1700+ PIPS Swing Concept On The Way,Three Profit TargetsJPY initiated a bearish trend and anticipates a rapid reversal in all JPY pairs, such as CADJPY. We expect a significant swing move, potentially reaching 2000+ pips in the long term. Additionally, we have set three targets based on our analysis, which can aid in identifying potential trade opportunities. Good luck and trade safely.
Good luck and trade safely.
Thanks for your support! 😊
If you want to help us out, here are a few things you can do:
- Like our ideas
- Comment on our ideas
- Share our ideas
Team Setupsfx_
❤️🚀
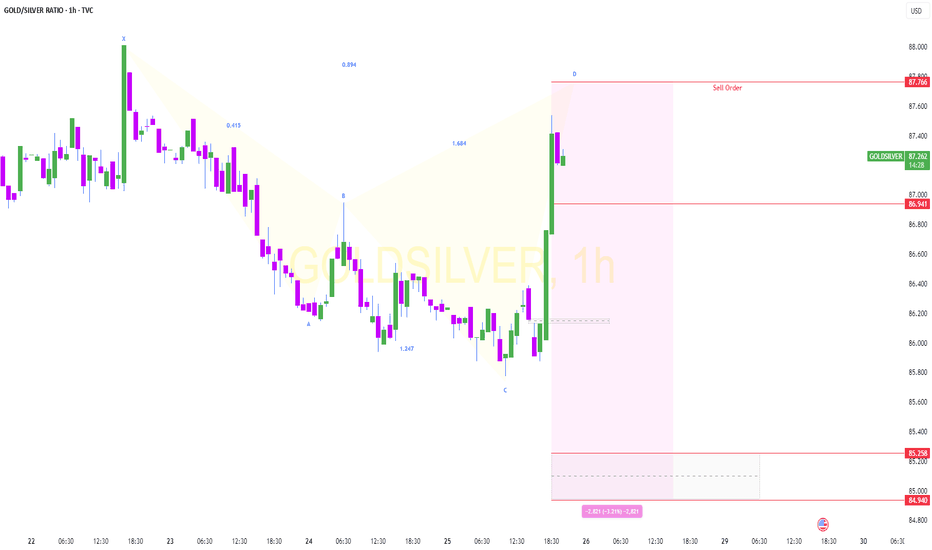
Harmonic Patterns
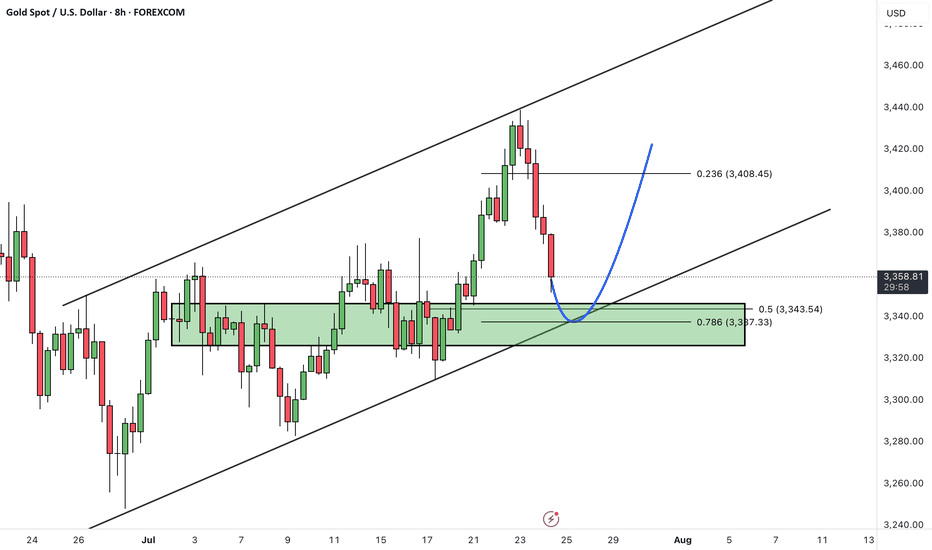
XAUUSD Channel Up bottomed, giving a strong buy signal.Gold (XAUUSD) has been trading within a 1-month Channel Up since the May 20 low and right now it is consolidating within and just outside the 4H MA50 (blue trend-line) and 4H MA100 (green trend-line) zone. At the same time, it has touched the bottom of the Channel Up.
This is exactly the kind of price action the pattern had during its previous bottom formation following a Higher Low (June 9-11). With the 4H RSI having also formed a Higher Low pattern consistent with all previous 3 Lows, we expect the price to start its new Bullish Leg now. Our Target is 3495 (+4.75% from the bottom).
-------------------------------------------------------------------------------
** Please LIKE 👍, FOLLOW ✅, SHARE 🙌 and COMMENT ✍ if you enjoy this idea! Also share your ideas and charts in the comments section below! This is best way to keep it relevant, support us, keep the content here free and allow the idea to reach as many people as possible. **
-------------------------------------------------------------------------------
Disclosure: I am part of Trade Nation's Influencer program and receive a monthly fee for using their TradingView charts in my analysis.
💸💸💸💸💸💸
👇 👇 👇 👇 👇 👇
Trump Pulls Back from World Liberty Financial Paribas GroupAccording to a recent report by Forbes, the Trump family has quietly distanced itself from World Liberty Financial (WLF) — a firm previously linked to emerging-market investments and offshore structured finance. While official statements remain limited, public records and insider sources suggest a gradual withdrawal of interest, influence, and capital over the last six months.
At Paribas Group, we monitor institutional behavior and political-capital intersections as part of our global risk framework. The Trump-WLF disconnection may appear isolated, but it reflects broader recalibrations of political families’ exposure to shadow finance vehicles — especially in a pre-election context.
What We Know So Far
WLF has operated as a boutique financial entity with a footprint in energy-related private placements, overseas real estate syndicates, and sovereign-linked asset flows. For several years, it was reportedly supported — at least in branding and influence — by Trump-affiliated associates.
However, recent filings show that:
No Trump family members currently hold board or advisory positions;
Legal entities associated with Trump interests have ceased formal engagement;
Several WLF-affiliated deals have been unwound or restructured quietly.
While the Trump Organization has not commented publicly, analysts suggest this strategic distancing aligns with both political optics and regulatory caution.
🗨️ “There’s a growing cost to reputational risk in offshore finance — especially for politically exposed persons,” says a regulatory strategist at Paribas Group.
Broader Implications for Financial Oversight
This move comes amid increased global scrutiny of private wealth channels, shell structures, and high-risk financial intermediaries. The FATF, SEC, and EU AML authorities have ramped up transparency demands, particularly where public figures or high-net-worth families are involved.
Paribas Group expects similar withdrawals and restructurings in the coming quarters — not only from politically connected entities, but also from PE firms and multi-family offices reassessing legal exposure.
Conclusion
The Trump family’s retreat from World Liberty Financial is more than a headline. It signals a shift toward greater insulation from financial reputational risk, especially ahead of U.S. election season. At Paribas Group, we see this as a strategic move within a larger trend of financial de-risking among elite asset holders.
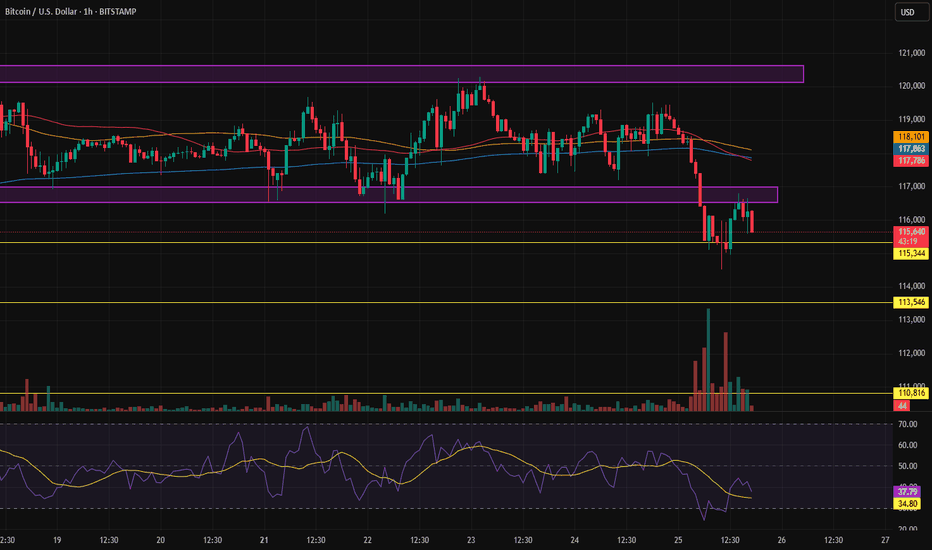
Today's BTC trading strategy, I hope it will be helpful to youBitcoin is fluctuating around $101,000, like driving to a crossroads. Looking down, the average price over the past month is supported at around $100,000. Looking up, $105,000 seems like a hurdle. In the United States, although the possibility of a rate cut in July is low (only 10%), some Fed officials have said they support rate cuts if inflation is under control, which has made the market expect easing in the second half of the year. More importantly, the United States and Hong Kong, China, are issuing "legal IDs" for stablecoins. Large companies like JD.com are applying for licenses, which may make Bitcoin transactions more convenient in the future, equivalent to adding fuel to the market. Large companies are also voting with their actions. For example, MicroStrategy continues to buy Bitcoin, indicating that long-term optimists have not wavered.
Today's BTC trading strategy, I hope it will be helpful to you
BTCUSDT BUY@100000~101000
SL:98000
TP:102000~103000
#MYRO/USDT#MYRO
The price is moving within a descending channel on the 1-hour frame and is expected to break and continue upward.
We have a trend to stabilize above the 100 moving average once again.
We have a downtrend on the RSI indicator, which supports the upward move by breaking it upward.
We have a support area at the lower limit of the channel at 0.001426, acting as strong support from which the price can rebound.
Entry price: 0.01588
First target: 0.01694
Second target: 0.01800
Third target: 0.01910
USDJPY MULTI TIME FRAME POV + XAUUSD , GU RECAP Hello traders , here is the full multi time frame analysis for this pair, let me know in the comment section below if you have any questions , the entry will be taken only if all rules of the strategies will be satisfied. wait for more price action to develop before taking any position. I suggest you keep this pair on your watchlist and see if the rules of your strategy are satisfied.
🧠💡 Share your unique analysis, thoughts, and ideas in the comments section below. I'm excited to hear your perspective on this pair .
💭🔍 Don't hesitate to comment if you have any questions or queries regarding this analysis.
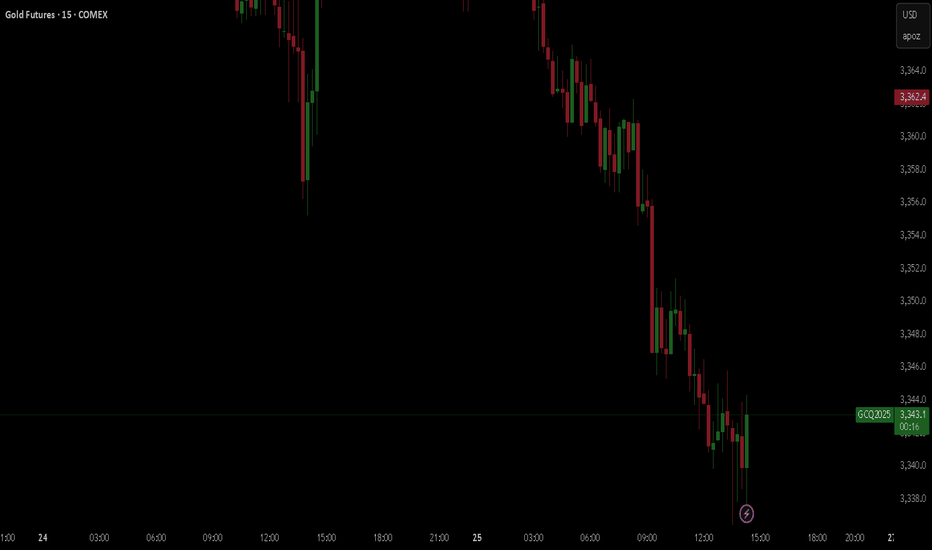
Gold Trend Analysis and Trading Strategy: Interpreting Bowman's Gold Trend Analysis and Trading Strategy: Interpreting Bowman's Rate Cut Signal
I. How Did Bowman's Speech "Fuel" Gold's Rally?
Fed Governor Bowman dropped a key statement today: "If price growth stabilizes, I would support a July rate cut." This is like a gas station attendant telling a driver, "Prices will drop soon—fill up less for now." After fixating on inflation last year, her sudden pivot has markets convinced the Fed may finally "let off the gas."
Why is this bullish for gold? Think of it this way: When the Fed cuts rates, borrowing costs fall, and the dollar "goes on sale." Since gold is priced in dollars, a cheaper dollar makes gold more attractive. While markets aren’t fully convinced of a July cut (CME data shows only 8.3% probability), Bowman’s words as a Fed "insider" are like a supermarket’s pre-sale discount announcement—some will always stock up early.
II. Why Is Gold Acting Like It Hit the Brakes but Wants to Accelerate?
(1) Where Is the "Brake Pad" Support?
Gold prices have hit the brakes near $3,347 (June 20 low), and Bowman’s speech could trigger a rebound to $3,390—like hitting a speed bump then gradually accelerating. Technically, the $3,350-$3,370 range acts as "anti-skid lines" on the road—if this holds, gold may resume its upward drive.
(2) Where Is the "Speed Limit" Resistance?
The major roadblock ahead is $3,413 (June 16 high), like a highway speed limit sign. If Bowman’s remarks convince more investors of an impending rate cut, gold could break this limit to test $3,450 or higher. But beware: If Middle East tensions ease suddenly (e.g., Iran halts strait blockade threats), gold may "hit the brakes" and pull back.
(3) Is the Middle East "Gas Pedal" Still Depressed?
With Israel and Iran exchanging missile strikes (Iran launched a new round on June 19), it’s like a constant traffic accident on the road, driving investors into gold’s "safe haven." Current dynamics—potential Fed rate cuts (dollar discount) + Middle East conflict (hedge demand)—are jointly pressing gold’s "gas pedal," but market hesitation over whether the Fed will actually cut rates is causing volatility.
**Trading Strategy Recommendations:**
- **Long on Dips**: Buy near $3,350-$3,370 with stop-loss below $3,340, targeting $3,390 initially.
- **Breakout Play**: Add to positions above $3,413, with profit targets at $3,450 and $3,480.
- **Hedging Against False Moves**: Allocate 10% of position to inverse gold ETFs (e.g., GLL) if Middle East tensions suddenly defuse.
**Key Monitor Points**:
- Track real-time CME FedWatch Tool for rate cut probability shifts.
- Monitor Strait of Hormuz shipping updates via Bloomberg Maritime.
- Follow Fed Governor Bowman’s subsequent public remarks for policy clarity.
In this tug-of-war between monetary policy signals and geopolitical risks, gold’s next move hinges on whether the "gas pedal" of rate cut expectations overrides the "brakes" of market skepticism. Maintain flexibility and align positions with confirmed breakouts rather than speculative narratives.
Today's gold trading strategy, I hope it will be helpful to you
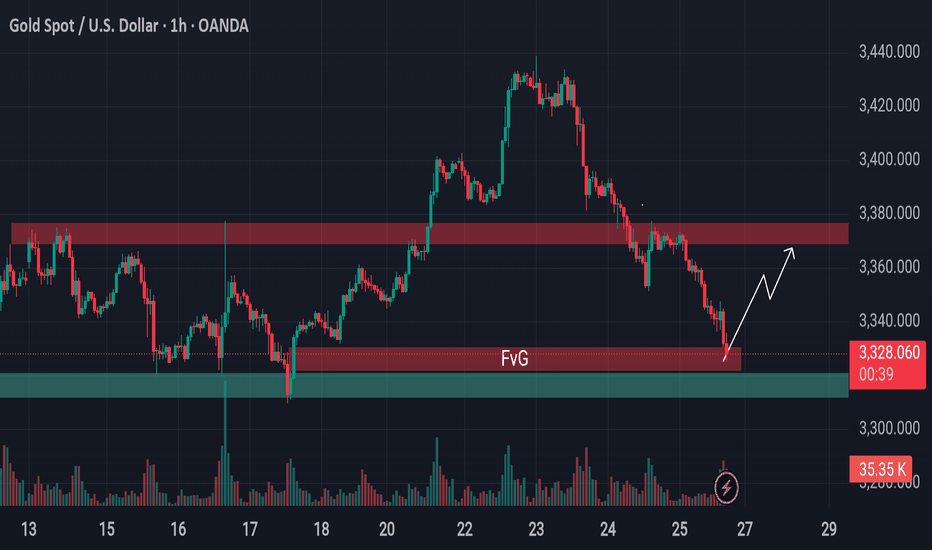
XAUUSD buy@3360~3370
SL:3350
TP:3380~3390
Euro – Eyes 1.15400, Awaits Powell's ToneEuro has just filled a GAP and rebounded strongly from the FVG zone around 1.14500. It is now approaching the 1.15400 resistance area, where a descending trendline intersects with a supply FVG. The bullish momentum remains intact within the short-term correction channel, but a rejection at this level could trigger a pullback.
On the news front, US Flash Manufacturing PMI is expected to decline, while Fed Chair Jerome Powell is set to testify this week. If he adopts a dovish tone, the USD may weaken further, potentially giving EURUSD the push it needs to break through resistance.
Strategy: Wait for a clear breakout above 1.15400 to confirm further upside. If rejected, watch the 1.14000 zone as a key support.
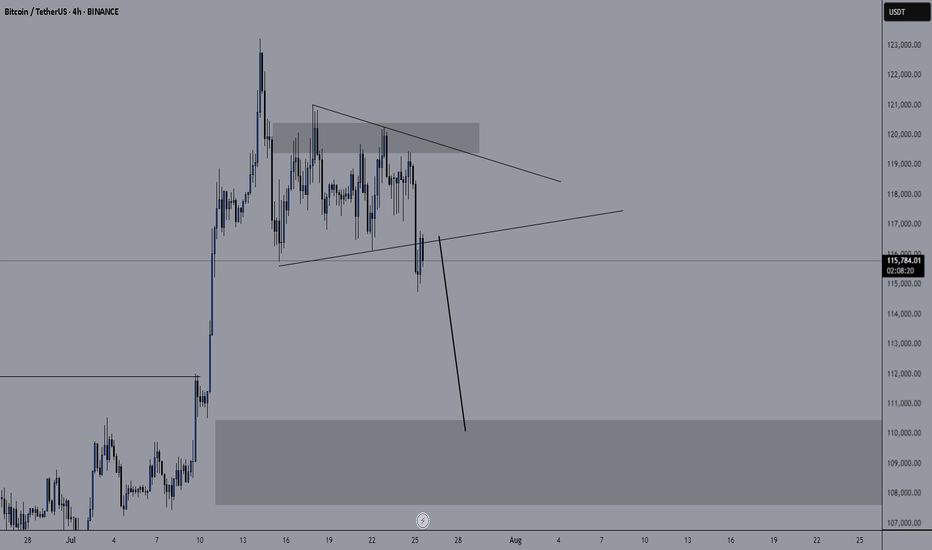
BTC ITS A TRAP Bitcoin is currently facing significant resistance at key technical levels and may be positioning for a potential sharp decline heading into Thursday, particularly as markets close and geopolitical tensions in the Middle East threaten to escalate.
Two key technical confluences support this thesis:
1. Bullish Gartley Harmonic Pattern: This setup is developing with highly precise ratio alignments, targeting a convergence at the Point of Control (POC) alongside multiple anchored VWAP levels. While the pattern typically involves a sharp decline, it often precedes a powerful reversal once liquidity is swept from the lows, making this a potentially attractive risk-reward inflection zone.
2. Failed Auction Structure: Price action has demonstrated an inability to sustain a breakout above the established fair value range, instead reverting back within the bounds of a parallel channel. This failed breakout—confirmed by a rejection at the upper end of the volume profile—suggests heightened probability of a move back toward fair value, marked in blue, which coincides with the POC and represents the market's most accepted / traded price.
We’ll observe how the setup develops from here.
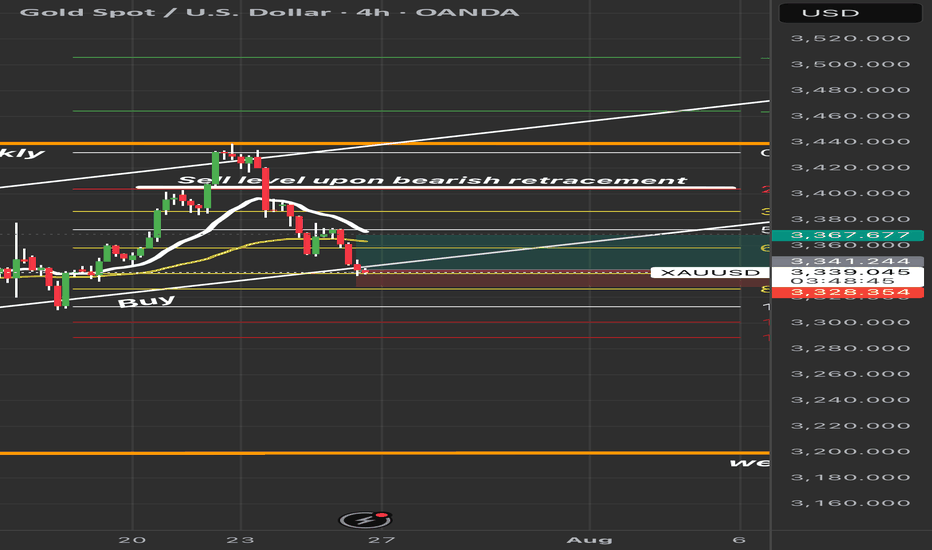
XAUUSD on pumpH4 Timeframe Analysis
Gold is currently holding the Rising wedge pattern on H4 and Rejected again at 3345-3350 Range which holds the pattern.
What's possible scanarios we have?
I'm expecting the upside move towards my Targets.
if gold sustained with this rising Parallel channel and H4 closes 3380-3382 then look upside 3405 then 3420 on intraday.
On the otherhand if The H4 candle closes below 3380-3382 buyying will be limited and market will again the rangbound 3345-3380.
#XAUUSD
GBPUSD is bearishFrom the chart, you will see that gbpusd is a long term bearish trade.
Reason;
1, In the bigger picture of the chart, you can an uptrend confirmation after the third touch
2, in the smaller picture you will see an ascending triangle
Wait for second trendline breakout for more confirmation and entry
XAUUSD is bullishFrom the chart, you will understand that xauusd is about to buy
Reasons;
1; In daily timeframe, you will see a hammer candlestick
2; Falling wedge pattern breakout
3; In 4 hrs, Third trendline touch
4; In lower timeframe, you will see a double bottom before the falling wedge breakout
HAEDALUSDT Forming Inverse Head And ShoulderHAEDALUSDT is currently forming an inverse head and shoulders pattern on the chart, a classic bullish reversal structure that signals the potential end of a downtrend. This pattern is often considered highly reliable when confirmed by a breakout above the neckline, especially when accompanied by strong trading volume. In the case of HAEDALUSDT, volume has been steadily increasing, suggesting accumulating interest from investors and a possible breakout on the horizon.
Technical analysis indicates that if HAEDALUSDT successfully breaks above the neckline, it could initiate a strong upward move, potentially yielding gains in the range of 60% to 70%+. The symmetry of the pattern, with well-formed shoulders and a clear head, further enhances the reliability of the bullish setup. Such technical formations tend to attract both swing traders and breakout traders who anticipate momentum-driven moves.
Adding to its appeal, the project behind HAEDALUSDT has started gaining traction among investors, which is reflected in recent price stability and a surge in buying pressure. This could mark the beginning of a broader trend reversal, especially if market sentiment across the crypto space continues to recover. Coins forming strong bottoming patterns like this often outperform in bullish cycles.
If you're looking for an early entry into a potential breakout with high reward-to-risk potential, HAEDALUSDT is certainly a chart to keep on your radar. Continued volume support and a confirmed breakout could quickly propel it toward upper resistance zones, making it a favorable candidate for short- to mid-term gains.
✅ Show your support by hitting the like button and
✅ Leaving a comment below! (What is You opinion about this Coin)
Your feedback and engagement keep me inspired to share more insightful market analysis with you!
[SeoVereign] Bitcoin Bearish Outlook – June 22, 2025We are the SeoVereign Trading Team.
With sharp insight and precise analysis, we regularly share trading ideas on Bitcoin and other major assets—always guided by structure, sentiment, and momentum.
🔔 Follow us to never miss a market update.
🚀 Boosts provide strong motivation and drive to the SeoVereign team.
--------------------------------------------------------------------------------------------------------
Currently, Bitcoin appears to have entered a downward phase based on the counting criteria. A movement breaking below the S1 support line has been detected, which I previously mentioned as a signal to consider a mid-to-short term bearish trend.
From a trend perspective, a bullish reversal has not yet occurred. The reason is that on the 20th, when the 105550 level was broken upward, a strong momentum-driven upward move did not follow. If a true trend reversal had occurred at that point, there should have been immediate strong buying pressure without a whipsaw movement after the breakout. However, the market quickly reversed downward, indicating that selling pressure still dominates.
At that point, I was preparing a long idea, but as the bearish trend became clear, I chose not to upload it. At the same time, the 1.414 butterfly pattern I personally developed was confirmed, further supporting the continuation of the downward trend.
As a result, I have continued to hold the Bitcoin short position that began with the idea on the 11th, and I plan to provide further analysis and idea updates as market movements unfold.
I wish you sound judgment in the market and continued good fortune.
TUTUSDT Forming Bullish BreakoutTUTUSDT is currently showing a bullish breakout from a falling wedge pattern on the daily chart—a highly reliable reversal setup often signaling the end of a downtrend and the beginning of an upward move. This breakout is accompanied by a healthy increase in volume, adding further confirmation to the move. Falling wedges are generally considered powerful patterns, especially when followed by strong bullish candles as seen here. This setup is attracting both technical traders and market watchers who are closely monitoring the next leg up.
The potential for a 40% to 50% gain is clearly visible on the chart, with projection targets well-defined and aligned with recent price action. The momentum is building, and TUTUSDT seems to be gearing up for a strong continuation rally. A sustained move above the wedge resistance and current local highs could pave the way for a retest of key resistance zones from previous price spikes.
This breakout comes at a time when broader market sentiment is slowly shifting toward optimism. As the altcoin space regains traction, tokens with solid technical setups like TUTUSDT become prime candidates for short- to mid-term investment. Additionally, the relatively low market cap and increasing investor interest in this project add further fuel to its upside potential.
For traders seeking early-stage breakouts with strong technical structure and positive sentiment, TUTUSDT offers an attractive opportunity. Keep an eye on volume continuity and market-wide conditions as confirmation for a full rally toward the upper targets mentioned in this setup.
✅ Show your support by hitting the like button and
✅ Leaving a comment below! (What is You opinion about this Coin)
Your feedback and engagement keep me inspired to share more insightful market analysis with you!
Polycab India Ltd Daily Trend AnalysisBased on my analysis, the stock has a potential target of 6693. If it manages to sustain above this level, it could further advance toward 7438. A stop loss can be considered at 5750 for risk management.
Please note, this is my personal view. Traders are advised to conduct their own analysis before making any entry or exit decisions.
HIFIUSDT Forming Falling Wedge HIFIUSDT is forming a textbook falling wedge pattern on the chart, a classic bullish reversal signal that often precedes strong upside movement. This pattern occurs when price action consolidates between two downward sloping trendlines, gradually tightening before a breakout to the upside. The current structure on HIFIUSDT suggests that the selling pressure is losing momentum, and a breakout could trigger an explosive bullish run. With technical confirmation building and a tightening wedge structure, traders and investors alike are starting to take serious interest in this setup.
Volume analysis further supports the bullish bias. Despite the decline in price, volume has remained relatively stable, a sign that the coin is being quietly accumulated. This kind of price-volume divergence typically precedes major market moves. As the wedge approaches its apex, a breakout with strong volume could ignite a significant price surge. Given the historical price action and chart projections, HIFIUSDT has the potential to deliver an extraordinary 490% to 500% gain from current levels, making it one of the most promising technical plays in the market right now.
Market sentiment around the HIFI ecosystem is also improving, with increased social media engagement, partnerships, and on-chain activity. This suggests that both speculative traders and long-term holders are watching the project closely. As the broader crypto market leans bullish, coins with strong technical setups like HIFIUSDT are well-positioned to outperform.
With its current technical structure, strong community interest, and substantial upside potential, HIFIUSDT presents a rare opportunity for traders looking for high-reward breakout trades. Watch closely for a confirmed breakout from the wedge—this could be the signal that a major rally is beginning.
✅ Show your support by hitting the like button and
✅ Leaving a comment below! (What is You opinion about this Coin)
Your feedback and engagement keep me inspired to share more insightful market analysis with you!
GBPUSDHello Traders! 👋
What are your thoughts on GBPUSD?
On the GBPUSD chart, we can see that the price has repeatedly tested a key resistance zone but failed to break above it, resulting in multiple rejections.
After forming a rising wedge pattern, the pair has broken down below the wedge, and is now completing a pullback toward the broken trendline.
We expect that after some consolidation in this area and completion of the pullback, the price will likely resume its decline toward lower targets.
As long as price remains below the resistance zone and broken trendline, the bearish scenario remains valid.
Is the pullback complete and ready for the next leg down? Share your view below! 🤔👇
Don’t forget to like and share your thoughts in the comments! ❤️
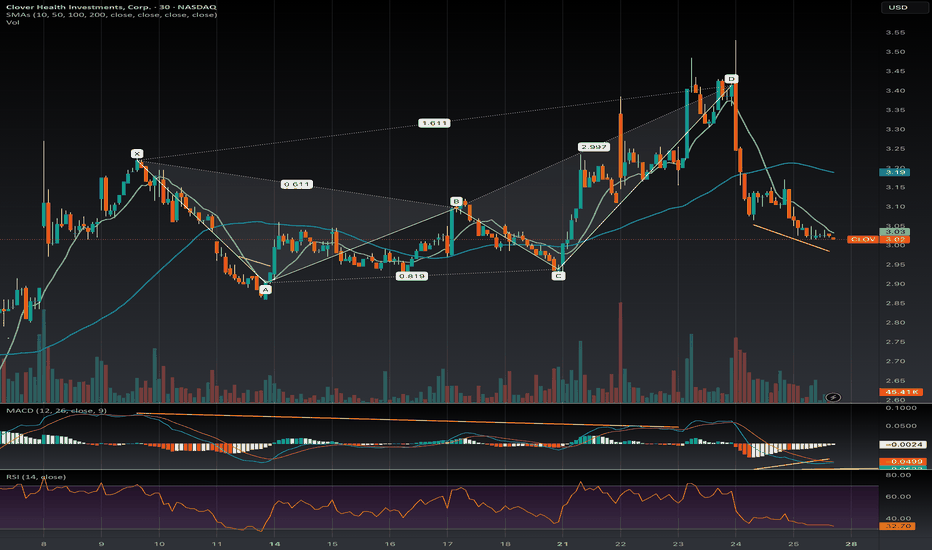
Weird cycle for alts Weekly update for this check lately has been painful
Outside of XRP and a few others it’s been a difficult ride this alt season.. weird to say the least . We were doing better in 24 than the Trump rally last November/Dec
Been pretty much downhill ever since.
While BTC still over 100k I fell we still have a chance but this alt season window is closing fast.
#GBPJPY: Buyers and Sellers Both Has Equal Chances! Hey there! So, GBPJPY is at a pivotal moment, and we might see a mix of buying and selling activity in the market. Since the bulls aren’t exactly sure what to do next, here’s what we think:
- The GBPJPY pair is having a tough time breaking through the 194 region. The Japanese yen (JPY) is holding steady, making it hard to predict what will happen next. This has made trading JPY pairs a real challenge.
- Looking back at how prices have behaved in similar situations can give us some clues about what might happen in the future. But it’s important to do thorough research before we start trading. Just because something happened in the past doesn’t mean it will happen again.
- The Japanese yen (JPY) also tends to go down when the US dollar (USD) goes up. Since we’re bullish on the DXY index in the coming days, we think the JPY will probably take a hit, and it could go down a lot. It’s also worth keeping an eye on the GBP, which has been one of the most popular currencies since the market opened earlier today.
- In the meantime, we suggest setting two take-profit targets: one at 197 and another at 199. These levels are likely to see a lot of selling activity.
Now, let’s talk about what sellers should do:
- The price is currently in favour of sellers since it dropped from 195.50 to 193.50. And since the last two daily candles closed with strong bearish volume, it looks like the price is going to keep going down.
- If the price breaks below 190.50, that would be a great opportunity for sellers to make some money.
Good luck and trade safely!
Thank you for your unwavering support! 😊
If you’d like to contribute, here are a few ways you can help us:
- Like our ideas
- Comment on our ideas
- Share our ideas
Team Setupsfx_
❤️🚀