SANDUSDT Breaks Major Downtrend – Golden Pocket Retest!
Technical Analysis:
SAND/USDT has successfully broken out of a descending trendline that had been capping the price since late 2024. The breakout occurred with increased volume, signaling strong buyer interest.
Following the breakout, price rallied and is now retesting a key support zone, which includes:
A demand zone (yellow box) between 0.2748 - 0.2885, aligning with the Fibonacci Golden Pocket (0.618 - 0.5)
A solid horizontal support around 0.2913
Fibonacci retracement levels are clearly defined:
0.3126
0.3467
0.4010
0.5417
Up to major resistance near 0.9384
---
Bullish Scenario 🟢:
If the price holds above the Golden Pocket zone and prints bullish confirmation (such as a bullish engulfing or hammer candlestick), then further upside potential is likely:
1. Initial targets: 0.3126 and 0.3467
2. Mid-range targets: 0.4010 and 0.5417
3. Long-term potential: 0.6981 and possibly the major resistance at 0.9384
Stronger confirmation would come from a daily candle closing above 0.3126.
---
Bearish Scenario 🔴:
If price breaks below the 0.2748 zone, it could indicate a failed breakout, potentially leading to:
1. Initial support: 0.2700
2. Deeper pullback zone: 0.2131 (previous low)
3. Potential fakeout of the trendline breakout
A daily close below 0.2748 would strongly validate the bearish setup.
---
Chart Pattern Overview:
Descending Triangle Breakout already confirmed
Price is now in the retest phase of the breakout
The Golden Pocket Fibonacci zone is the crucial point of trend continuation or reversal
---
Conclusion:
The breakout from the long-standing downtrend marks a strong shift in structure. However, a successful retest at the Golden Pocket will be key to confirming further bullish continuation. If buyers defend this zone, SAND is likely to print a higher low and resume its upward move.
#SANDUSDT #CryptoBreakout #AltcoinAnalysis #TechnicalAnalysis #FibonacciLevels #TrendlineBreakout #GoldenPocket #BullishSetup #BearishSetup
Harmonic Patterns

BTCUSD Daily Analysis – Golden Pocket Hold Before a Bullish?🧠 Chart Description & Market Structure:
The BTCUSD daily chart is showing a consolidation phase after forming a local high near $123,231. Currently, the price is retracing and approaching a key Fibonacci retracement zone between the 0.5 level ($115,557) and 0.618 level ($113,740) — also known as the Golden Pocket, which is often a strong reversal area.
---
📈 Bullish Scenario:
If the price holds within or just above the 0.5–0.618 Fibonacci zone (highlighted in yellow) and forms a bullish reversal candlestick (like a hammer, bullish engulfing, or pin bar), there’s a high probability for BTC to resume its uptrend.
Bullish upside targets include:
$119,842 as minor resistance.
$123,231 as the previous swing high and a key breakout confirmation.
A successful break above $123,231 could send BTC toward the next major targets around $128K–$132K.
---
📉 Bearish Scenario:
If the price fails to hold the 0.618 Fibonacci level ($113,740) and breaks down below the key psychological support at $111,500, a deeper correction may occur.
Downside targets:
$108K–$106K as the next major support zone.
A break below this could lead to the formation of a lower high structure and potentially trigger a bearish continuation.
---
📊 Pattern Observations:
Potential Bullish Flag or Rectangle Consolidation: The price action suggests horizontal consolidation after a strong rally — possibly a re-accumulation zone before a bullish continuation.
Golden Pocket Retest: Price is currently testing the Fibonacci 0.5–0.618 zone, often targeted by institutional buyers and technical traders as a potential entry point.
---
🧭 Key Levels to Watch:
Major Resistance: $123,231 (swing high)
Minor Resistance: $119,842
Fibonacci 0.5: $115,557
Fibonacci 0.618: $113,740
Key Support: $111,500
---
🔖 Conclusion:
BTC is currently in a decision zone. Price action within the $115,500–$113,700 range will be crucial. Will this be a healthy retracement before the next leg up — or the beginning of a deeper correction?
#BTCUSD #BitcoinAnalysis #CryptoTA #FibonacciRetracement #CryptoChart #BitcoinDaily #BullishSetup #BearishSetup #CryptoMarket

25.07.25 Morning ForecastPairs on Watch -
FX:USDJPY
CAPITALCOM:DE40
FX:GBPUSD
FX:AUDUSD
A short overview of the instruments I am looking at for today, multi-timeframe analysis down to what I will be looking at for an entry. Enjoy!

BTCUSD: Who caught the bottom of the previous wave?BTCUSD: Who caught the bottom of the previous wave?
.
I’ve said it before, the market only has a few familiar patterns, repeating them over and over to the point of boredom.
.
US STOCKS- WALL STREET DREAM- LET'S THE MARKET SPEAK!

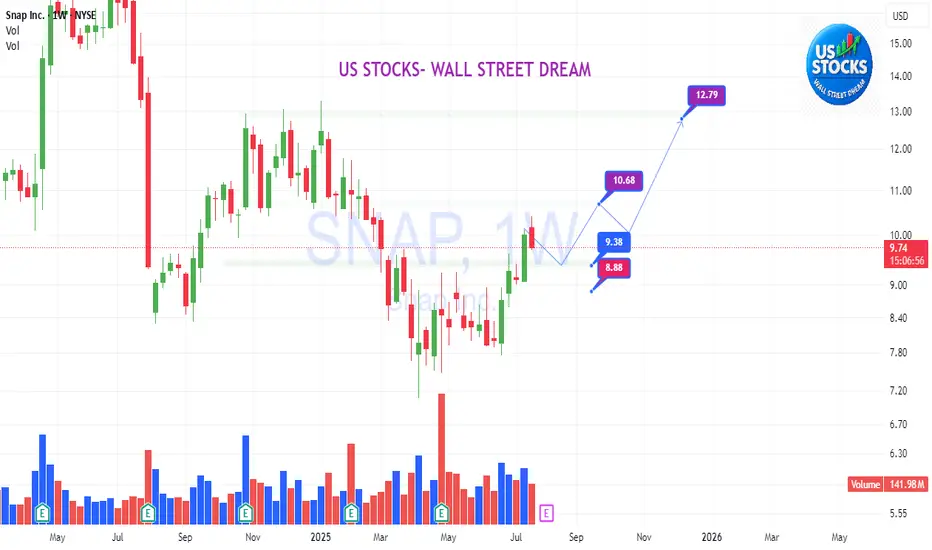
SNAP: Will you join plan with us?SNAP:
.
Will you join plan with us?
Do you want to ride a whole long-term wave that rises from the bottom?
.
US STOCKS- WALL STREET DREAM- LET'S THE MARKET SPEAK!

GALAUSDT📌 Key Points:
• Weekly support held perfectly ✅
• Bullish harmonic structure completed ✅
• Fair value gaps below price confirming strength ✅
Let’s see how this plays out — eyes on 0.024 👀💥

GBPUSD NEW BULLISH LOOKAccording to M15 analysis gbpusd market is near to touch support zone
it is very best chnace for buyer to buy from support level
dont be greedy use money managment
TRADE AT YOUR OWN RISK
REGARD ALBERT

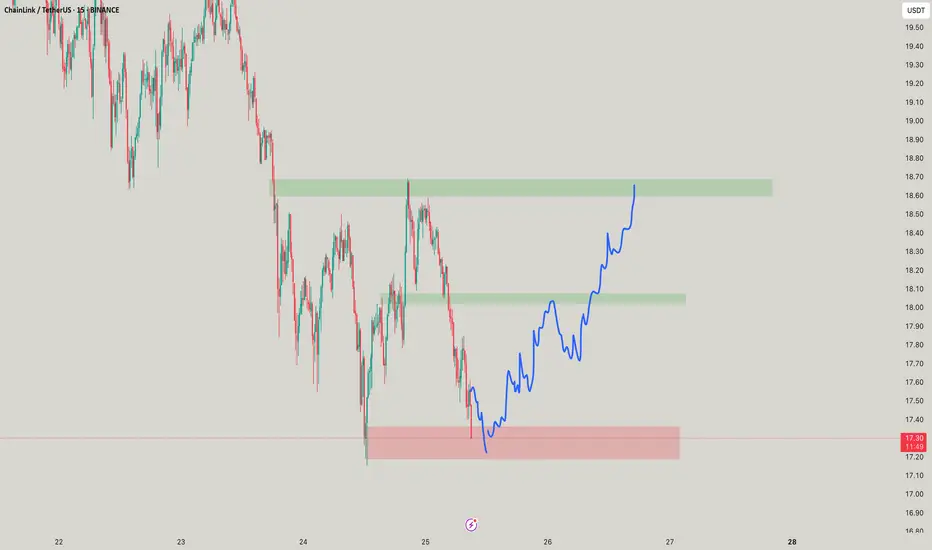
LINK your Idea! Its time!Buying at the right time is the best thing you can do and selling at the right time too! aint it?
GBPUSD H4 Bullish Reversal Based on the H4 chart analysis, the price is approaching our buy entry level at 1.3404, a pullback support that aligns with the 50% Fib retracement.
Our take profit is set at 1.3555, a pullback resistance.
The stop loss is placed at 1.3404, a swing low support.
High Risk Investment Warning
Trading Forex/CFDs on margin carries a high level of risk and may not be suitable for all investors. Leverage can work against you.
Stratos Markets Limited (tradu.com ):
CFDs are complex instruments and come with a high risk of losing money rapidly due to leverage. 63% of retail investor accounts lose money when trading CFDs with this provider. You should consider whether you understand how CFDs work and whether you can afford to take the high risk of losing your money.
Stratos Europe Ltd (tradu.com ):
CFDs are complex instruments and come with a high risk of losing money rapidly due to leverage. 63% of retail investor accounts lose money when trading CFDs with this provider. You should consider whether you understand how CFDs work and whether you can afford to take the high risk of losing your money.
Stratos Global LLC (tradu.com ):
Losses can exceed deposits.
Please be advised that the information presented on TradingView is provided to Tradu (‘Company’, ‘we’) by a third-party provider (‘TFA Global Pte Ltd’). Please be reminded that you are solely responsible for the trading decisions on your account. There is a very high degree of risk involved in trading. Any information and/or content is intended entirely for research, educational and informational purposes only and does not constitute investment or consultation advice or investment strategy. The information is not tailored to the investment needs of any specific person and therefore does not involve a consideration of any of the investment objectives, financial situation or needs of any viewer that may receive it. Kindly also note that past performance is not a reliable indicator of future results. Actual results may differ materially from those anticipated in forward-looking or past performance statements. We assume no liability as to the accuracy or completeness of any of the information and/or content provided herein and the Company cannot be held responsible for any omission, mistake nor for any loss or damage including without limitation to any loss of profit which may arise from reliance on any information supplied by TFA Global Pte Ltd.
The speaker(s) is neither an employee, agent nor representative of Tradu and is therefore acting independently. The opinions given are their own, constitute general market commentary, and do not constitute the opinion or advice of Tradu or any form of personal or investment advice. Tradu neither endorses nor guarantees offerings of third-party speakers, nor is Tradu responsible for the content, veracity or opinions of third-party speakers, presenters or participants.

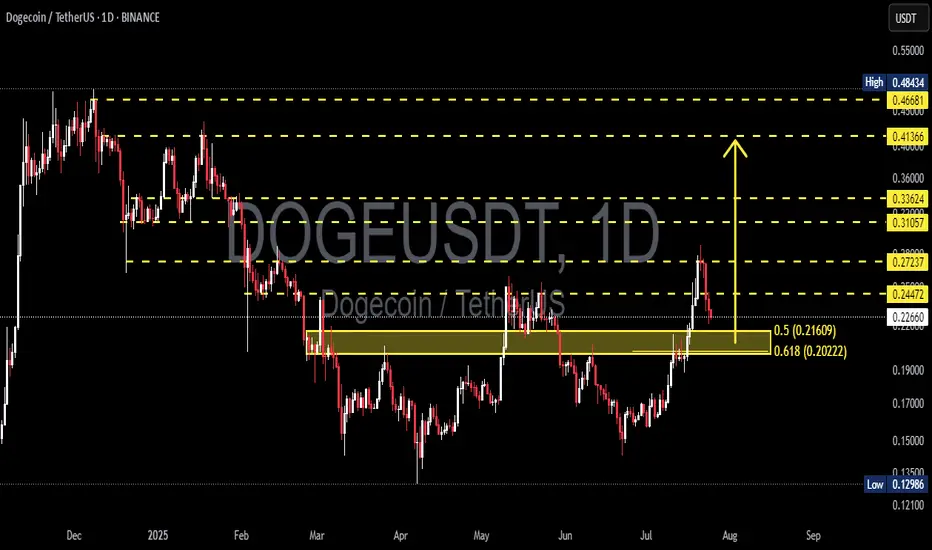
DOGEUSDT at a Make-or-Break Level: Bounce or a Breakdown?📉 Overview:
After a strong rally from the $0.13 zone to a recent local high of $0.272, DOGE is now undergoing a healthy correction. The price has retraced to a critical Fibonacci Golden Pocket zone (0.5–0.618) between $0.21609 and $0.20222 — historically one of the most powerful zones for market reactions.
This area also aligns with a previous resistance zone that is now being retested as support — a classic SR Flip (Support/Resistance Flip).
---
📌 Key Technical Structure:
🔸 Support & Demand Zone (Golden Pocket):
$0.21609 (Fib 0.5) and $0.20222 (Fib 0.618) – key retracement levels of the recent bullish swing.
Acts as a confluence zone with horizontal support from prior consolidation.
🔸 Major Resistance Levels:
$0.24472 – immediate resistance to reclaim.
$0.27237 – recent high and a major supply zone.
$0.31057, $0.33624 – historical distribution zones.
$0.41366 – breakout confirmation zone for a full trend reversal.
---
🧠 Market Psychology & Patterns:
Breakout & Retest: DOGE recently broke out from a long-term range and is now retesting the breakout zone.
Potential Bull Flag or Descending Channel: Current pullback resembles a flag or bull pennant — both continuation patterns if confirmed with volume.
---
✅ Bullish Scenario (Bounce):
If DOGE holds the Golden Pocket ($0.216–$0.202) and prints a strong bullish reversal candle:
A bounce may push price back to $0.244, and if reclaimed, back to $0.272.
A confirmed breakout above $0.272 with volume could lead to:
Mid-term targets: $0.310 → $0.336 → $0.413 → $0.466.
📈 Confirmation: Daily candle close above $0.244 with rising volume.
---
❌ Bearish Scenario (Breakdown):
If price fails to hold above $0.202 and breaks below with daily close:
It signals invalidation of the bullish structure and possible reversal.
Downside targets:
$0.186 – short-term support.
$0.150 – psychological support.
$0.129 – Year-to-date low (YTD Low).
This would also form a Lower High – Lower Low structure indicating a shift to a bearish trend.
---
🔍 Volume & Momentum Clues:
Watch for volume spikes near $0.202–$0.216.
Strong green candle + volume = likely reversal.
Weak reaction or breakdown on low volume = potential continuation downward.
---
🎯 Trader Playbook:
Signal Action Target
Bounce from $0.216–$0.202 Long Entry $0.244 – $0.272
Daily close below $0.202 Short / Avoid Longs $0.186 → $0.150
Breakout above $0.272 w/ volume Breakout Entry $0.31 → $0.336 → $0.41+
---
🏁 Conclusion:
DOGE is currently at a critical inflection point. The Golden Pocket zone will likely determine whether bulls are accumulating for another leg up or bears are about to reclaim control.
💡 This is a time for strategy, not prediction. Wait for confirmation before committing to either direction. The market is speaking — all we have to do is listen.
---
📊 Chart Summary:
Timeframe: Daily (1D)
Pattern: Breakout Retest + Fibonacci Retracement + Bull Flag
Structure: Higher High – looking for Higher Low confirmation
#DOGEUSDT #Dogecoin #CryptoTA #GoldenPocket #AltcoinAnalysis #FibonacciTrading #BreakoutSetup #BullishContinuation #BearishReversal
EURUSD I Bullish Bounce Off Based on the H4 chart analysis, the price is falling toward our buy entry level at 1.1699, a pullback support that aligns with the 38.2% Fib retracement.
Our take profit is set at 1.1745, a pullback resistance.
The stop loss is placed at 1.1638, below the 61.8% Fib retracement.
High Risk Investment Warning
Trading Forex/CFDs on margin carries a high level of risk and may not be suitable for all investors. Leverage can work against you.
Stratos Markets Limited (tradu.com ):
CFDs are complex instruments and come with a high risk of losing money rapidly due to leverage. 63% of retail investor accounts lose money when trading CFDs with this provider. You should consider whether you understand how CFDs work and whether you can afford to take the high risk of losing your money.
Stratos Europe Ltd (tradu.com ):
CFDs are complex instruments and come with a high risk of losing money rapidly due to leverage. 63% of retail investor accounts lose money when trading CFDs with this provider. You should consider whether you understand how CFDs work and whether you can afford to take the high risk of losing your money.
Stratos Global LLC (tradu.com ):
Losses can exceed deposits.
Please be advised that the information presented on TradingView is provided to Tradu (‘Company’, ‘we’) by a third-party provider (‘TFA Global Pte Ltd’). Please be reminded that you are solely responsible for the trading decisions on your account. There is a very high degree of risk involved in trading. Any information and/or content is intended entirely for research, educational and informational purposes only and does not constitute investment or consultation advice or investment strategy. The information is not tailored to the investment needs of any specific person and therefore does not involve a consideration of any of the investment objectives, financial situation or needs of any viewer that may receive it. Kindly also note that past performance is not a reliable indicator of future results. Actual results may differ materially from those anticipated in forward-looking or past performance statements. We assume no liability as to the accuracy or completeness of any of the information and/or content provided herein and the Company cannot be held responsible for any omission, mistake nor for any loss or damage including without limitation to any loss of profit which may arise from reliance on any information supplied by TFA Global Pte Ltd.
The speaker(s) is neither an employee, agent nor representative of Tradu and is therefore acting independently. The opinions given are their own, constitute general market commentary, and do not constitute the opinion or advice of Tradu or any form of personal or investment advice. Tradu neither endorses nor guarantees offerings of third-party speakers, nor is Tradu responsible for the content, veracity or opinions of third-party speakers, presenters or participants.

ETH ~ Receive more than you expect!Such nice momentum to see but buys at red! but always place to limits to take those buys!

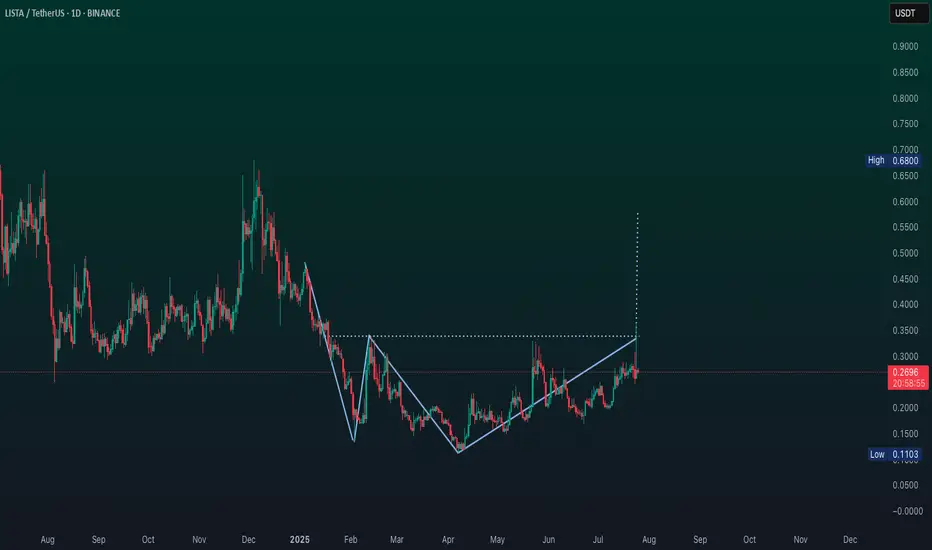
$lista ready to fly?Lista DAO’s 3.65% 24-hour price rise appears driven by a major exchange listing, bullish technical momentum, and strategic ecosystem developments.
Bithumb listing (24 July) boosted accessibility for South Korean traders.
Technical indicators show bullish momentum above key moving averages.
Partnerships with NanoLabs and protocol upgrades enhanced investor confidence.
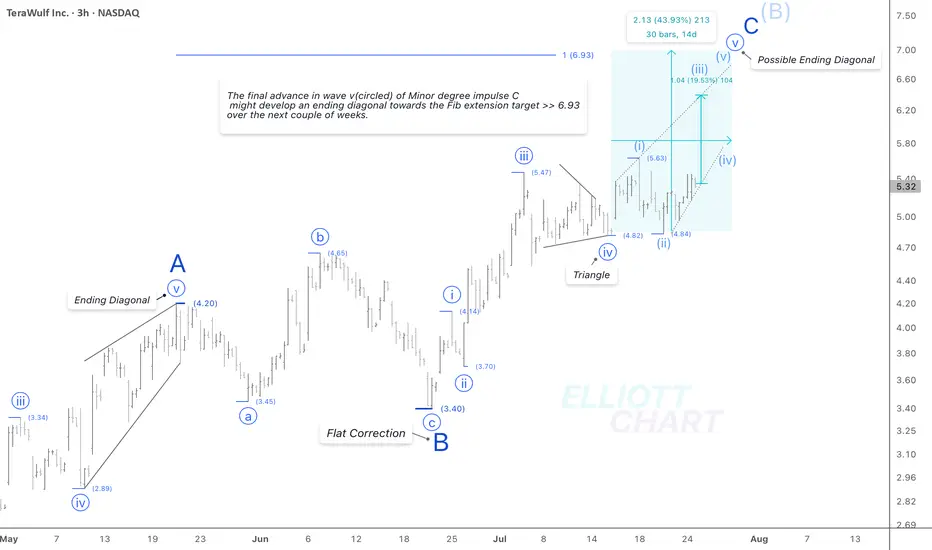
WULF / 3hWave Analysis >> While the current outlook on WULF remains consistent with previous analysis, the internal structure of wave v (circled) suggests the potential development of an ending diagonal in the final leg of Minor degree wave C.
Trend Analysis >> Upon completion of Minor degree wave C, the countertrend advance of Intermediate degree wave (B), which has been unfolding since April 9, is likely to give way to a decline in wave (C) of the same degree. This downtrend might begin in the coming days and potentially extend through the end of the year.
NASDAQ:WULF CRYPTOCAP:BTC BITSTAMP:BTCUSD MARKETSCOM:BITCOIN
#CryptoStocks #WULF #BTCMining #Bitcoin #BTC
CHFJPY ASIA Session BearsDuring this trading session, we should see price retest the lows created before a strong bullish continuation.
