ENTRY USDCADDisclaimer:
This is merely a chart-based analytical trading idea and is not considered investment advice. Please manage your risks carefully and conduct your own research before making any trading decisions.
Harmonic Patterns

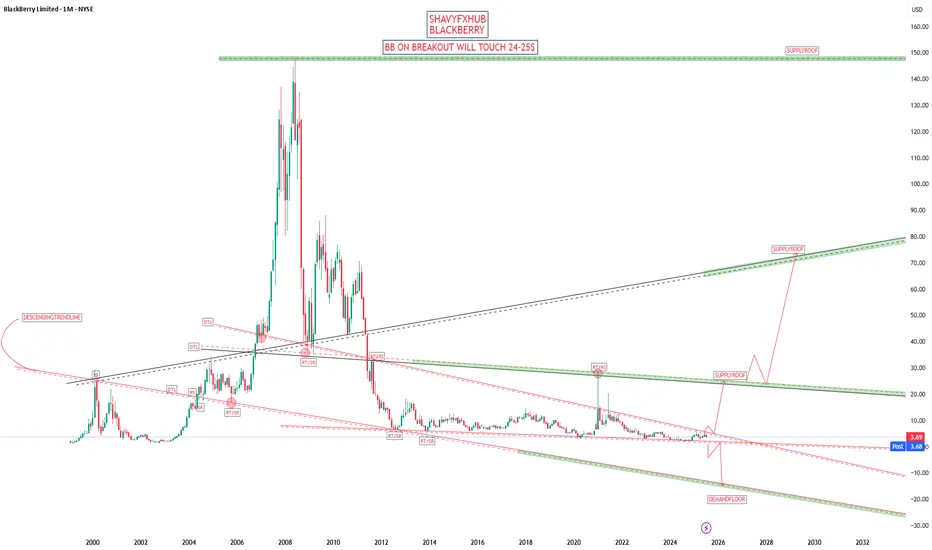
BLACKBERRY BREAKOUT OF DESCENDING TRENDLINE COULD SEE 22$-24$
BlackBerry today is a Canadian technology company specializing in cybersecurity software and Internet of Things (IoT) services for enterprises and governments worldwide. Formerly renowned as a mobile device manufacturer, BlackBerry Limited (formerly Research In Motion, RIM) exited the smartphone business in 2016 and now focuses on secure communications, endpoint management, and embedded systems, especially for industries like automotive, healthcare, and government.
Company Profile & Business
Headquarters: Waterloo, Ontario, Canada
Core products: Cybersecurity solutions, BlackBerry Unified Endpoint Management (UEM), QNX operating systems, secure messaging (BlackBerry Messenger Enterprise, BBMe), and automotive software platforms.
Global presence: Products and services are sold worldwide across the Americas, Europe, Middle East, Africa, and Asia-Pacific.
Recent Financials & Stock
Stock ticker: NYSE/TSX: BB
Recent price: As of July 30, 2025, BlackBerry closed at $3.74 per share, reflecting a decline from earlier in the month. Price targets for the company now range from $2.71 to $4.75, with analysts citing positive revenue growth and the company's first positive cash flow in three years after its recent quarterly results.
Business momentum: The company recently posted about 10% higher revenue compared to forecasts for the third quarter fiscal year 2025, with a shift to positive earnings and cash flow—highlighting improvements in its cybersecurity and IoT software businesses.
Notable News & Developments
End of smartphones: BlackBerry-branded mobile devices are officially discontinued. The company fully exited the hardware business by 2018 and stopped supporting BlackBerry 10 in 2022.
Nostalgia revival: In 2025, a separate company (Zinwa Technologies) is reviving classic BlackBerry devices (like the BlackBerry Classic and Passport) by retrofitting them with modern Android internals. These are not officially affiliated with BlackBerry Limited, but appeal to enthusiasts for the classic design and QWERTY keyboard, albeit with privacy caveats due to non-BlackBerry software.
Enterprise focus: BlackBerry remains a leader in secure software for businesses, including automotive OS (QNX), endpoint security, and secure messaging. Major clients include automotive OEMs, financial corporations, and government agencies.
Quick Facts Table
Aspect Details
Industry Cybersecurity, IoT software, enterprise services
Founded 1984 (as Research In Motion, Canada)
Consumer Phones Discontinued; brand revived unofficially by others
Current Stock Price $3.74 (July 30, 2025)
Latest Product Focus Automotive software, secure endpoint management
BlackBerry is no longer a phone maker, but remains a significant player in secure enterprise and automotive software, with stock prices and business outlook reflecting its transition into these fields.
#BB
Xrp - This is the bullrun breakout!🔑Xrp ( CRYPTO:XRPUSD ) breaks the triangle now:
🔎Analysis summary:
After the recent bullish break and retest, Xrp managed to already rally another +100%. This is a clear indication that bulls are still totally in control of cryptos and especially Xrp. It all just comes down to the all time breakout, which will then lead to a final parabolic rally.
📝Levels to watch:
$3.0
SwingTraderPhil
SwingTrading.Simplified. | Investing.Simplified. | #LONGTERMVISION

TON Bearish DivergenceBINANCE:TONUSDT
Trade Setup:
Target 1: 3.523 (0.786 Fibonnaci Golden Zone).
Target 2: 3.389 (0.618 Fibonnaci Golden Zone).
Target 3: 3.295 (0.786 Fibonnaci Golden Zone).
Target 4: 2.897 (0 Fibonnaci).
Stop Loss: 3.910 (1.272 Fibonnaci).
RSI Analysis: The RSI is showing a bullish divergence, suggesting potential bullish momentum. The current RSI is around 75.44, approaching overbuy territory, so caution is advised.

Gold Next Move (Read description). Hello, Traders.
As you saw we have achieved our target at last ideas.
This week gold is running in down trend, today it has touched the price 3268 and then gold pumped.
As you see guys, gold has breakout the last support area and its support became resistance.
Gold has changed the character according to H1 and there is break of structure (BOS).
The trend is bearish, so gold needs to fall, it can fall till 3351.
Comment positive feedbacks, Thanks.

XAUUSD:Swing Sell Is Highly Likely! Get ReadyWe expect a smooth drop in gold prices, with prices potentially dropping around the 3250 area. Use Accurate Risk Management.
Please like and comment!
Team Setupsfx_
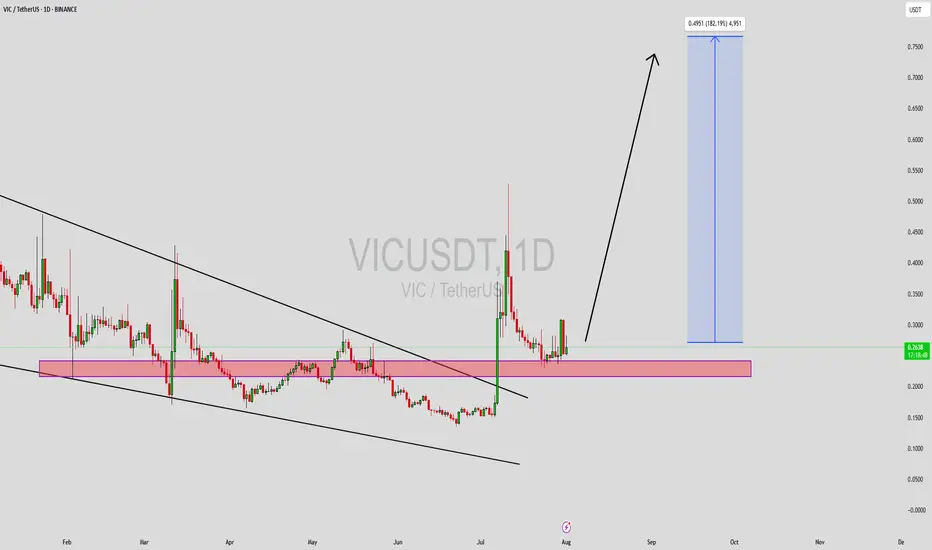
VICUSDT Forming Descending WedgeVICUSDT is currently displaying a classic descending wedge pattern, which is often recognized as a bullish reversal signal in technical analysis. This pattern typically emerges after a prolonged downtrend, and when paired with good volume — as we’re now seeing — it suggests that selling pressure is weakening and a breakout to the upside could be imminent. VIC has respected its wedge boundaries well, and now it's approaching the breakout zone, making this an ideal time for technical traders to watch closely.
Volume has been steadily increasing, which supports the idea of accumulation at the current levels. This convergence of price and volume dynamics signals that smart money may be positioning itself ahead of a potential rally. Based on the measured move from this wedge pattern, a 140% to 150% gain could be on the horizon once confirmation of breakout is secured. The price is also hovering near historical support, which adds another layer of confluence to the bullish outlook.
With investor interest rising and sentiment shifting, VICUSDT has the potential to outperform in the coming sessions. Altcoins that consolidate in well-defined reversal patterns and attract volume are often primed for explosive moves. Traders looking for setups with strong technical structure, breakout confirmation, and momentum alignment may find VICUSDT to be one of the top candidates for mid-term gains.
This is a high-reward opportunity for patient and disciplined traders. Keep an eye on resistance breakout levels and volume surges, as they may trigger the start of a powerful trend reversal.
✅ Show your support by hitting the like button and
✅ Leaving a comment below! (What is You opinion about this Coin)
Your feedback and engagement keep me inspired to share more insightful market analysis with you!
#MAGIC/USDT Falling Wedge + Fib Confluence #MAGIC
The price is moving within a descending channel on the 1-hour frame, adhering well to it, and is on its way to breaking strongly upwards and retesting it.
We have support from the lower boundary of the descending channel at 0.1620.
We have a downtrend on the RSI indicator that is about to be broken and retested, supporting the upside.
There is a major support area in green at 0.1662, which represents a strong basis for the upside.
Don't forget a simple thing: ease and capital.
When you reach the first target, save some money and then change your stop-loss order to an entry order.
For inquiries, please leave a comment.
We have a trend to hold above the 100 Moving Average.
Entry price: 0.1780.
First target: 0.1827.
Second target: 0.1905.
Third target: 0.1962.
Don't forget a simple thing: ease and capital.
When you reach your first target, save some money and then change your stop-loss order to an entry order.
For inquiries, please leave a comment.
Thank you.

Major U.S. News Ahead—Will EURUSD Pivot?Good morning, my friends 👋
Here’s my EURUSD market analysis 📉
Currently, the pair is in a downtrend. I expect this downward move to end around 1.14899 or 1.14536, where a potential buying opportunity may emerge. I personally plan to enter a buy position once price reaches those zones 💼
Also, keep an eye on major U.S. economic reports being released today—they could trigger increased volatility 🔔
Every like you send is a huge source of motivation for me to keep sharing high-quality analysis 🙏 Thanks to everyone supporting the channel 💙

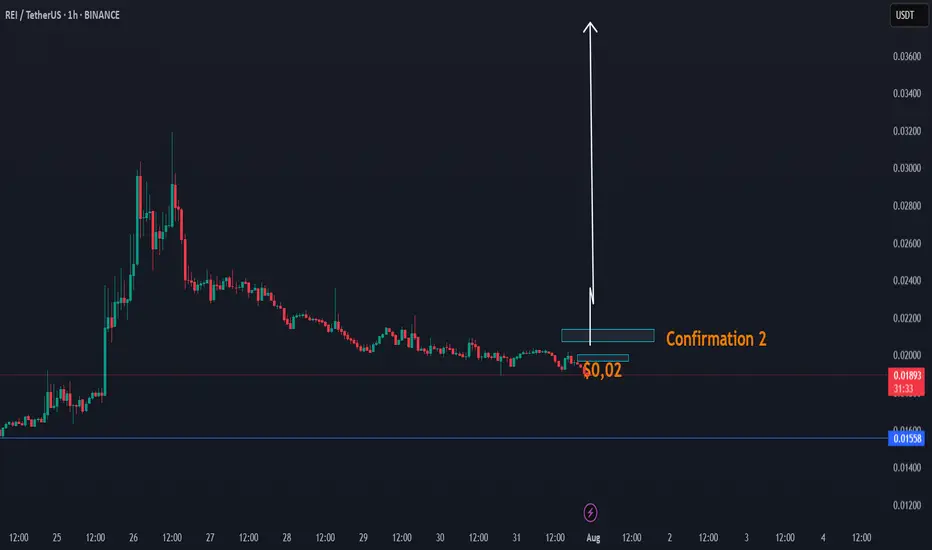
DAY UPDATE REI/USDT THE INCREASE CANDLE OF UP $0,03 - $0,05REI is an interesting coin since the update of Q4
We have seen that this coin was able to increase to $0,031 and until here $0,018 zone, a return to where we are now. There is a high chance that this coin can recover next 24H if this coin is able to confirm the confirmation $0,02 - $0,021
This coin, as before, was targeted at $ 0.02 and had low volume. We expect that if it comes back to $ 0.02, it will be confirmation of the volume, which can take the trend with a candle to up $0,03
REI CONFIRMATIONS ZONE
Higher time frame
When you look normally at this coin, then this coin is in a trend line of breakdown. This can change with the next confirmations. The question is, are we going to see again $0,02 the next 24h? If yes high chance of a break.
We also have a cycle update 2025, check it here, expecting $0,90
ETH BUY SETUP ,Bought From $3830ETH BUY SETUP
Currently $3830
Bought From $3830
(Trading plan If ETH go down ,
to $3700 will add more longs)
Expecting target $3890 OR ABOVE
Stoploss at $3470
In the event of an early exit,
this analysis will be updated.

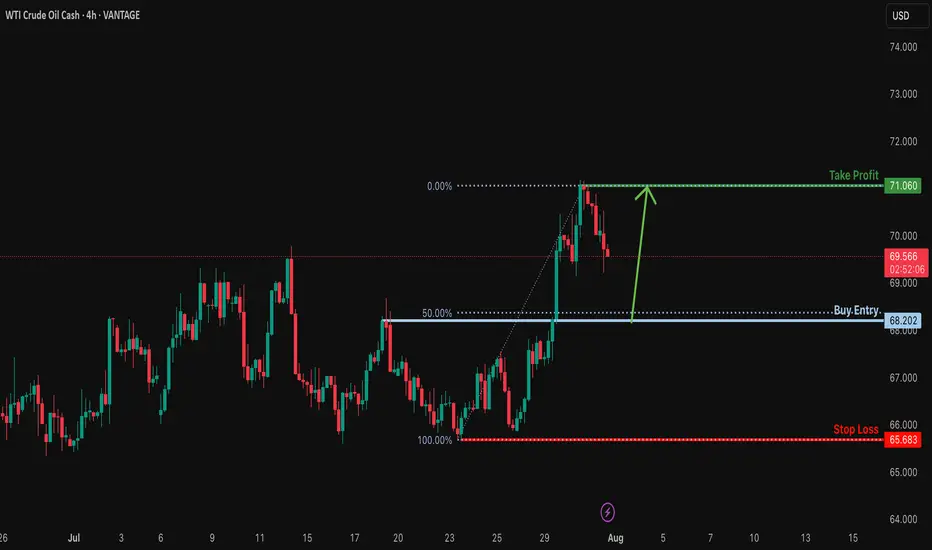
Bullish bounce off 50% Fibonacci support?USOUSD is falling towards the support levle which is a pullback support that aligns with the 50% Fibonacci retracement and could bounce from this level to our take profit.
Entry: 68.20
Why we like it:
There is a pullback support that lines up with the 50% Fibonacci retracement.
Stop loss: 65.68
Why we like it:
There is a multi swing low support.
Take profit: 71.06
Why we like it:
There is a swing high resistance.
Enjoying your TradingView experience? Review us!
Please be advised that the information presented on TradingView is provided to Vantage (‘Vantage Global Limited’, ‘we’) by a third-party provider (‘Everest Fortune Group’). Please be reminded that you are solely responsible for the trading decisions on your account. There is a very high degree of risk involved in trading. Any information and/or content is intended entirely for research, educational and informational purposes only and does not constitute investment or consultation advice or investment strategy. The information is not tailored to the investment needs of any specific person and therefore does not involve a consideration of any of the investment objectives, financial situation or needs of any viewer that may receive it. Kindly also note that past performance is not a reliable indicator of future results. Actual results may differ materially from those anticipated in forward-looking or past performance statements. We assume no liability as to the accuracy or completeness of any of the information and/or content provided herein and the Company cannot be held responsible for any omission, mistake nor for any loss or damage including without limitation to any loss of profit which may arise from reliance on any information supplied by Everest Fortune Group.
BTC Dominance and Altcoins SituationBitcoin dominance has reached a key support on the daily time frame. The NEW RSI indicator still sees the market as bearish but is pulling back. We will probably not see the growth of major altcoins like Ethereum for a few days. This analysis is not a financial recommendation in any way.

RUNE at the Brink: Rebound Opportunity or Breakdown Incoming?🧩 Overview:
RUNE/USDT is currently hovering at a critical support zone — a historical demand area that has triggered strong bullish rallies in the past. Positioned between $1.00–$1.30, this level has been a battle ground between buyers and sellers. The big question now: Will RUNE bounce for a bullish reversal or break down into deeper lows?
---
🔍 Key Levels Identified:
Major Support Zone (Demand Area): $1.00 – $1.30 (yellow box)
Immediate Resistance: $1.95 → $3.11 → $4.92
Extended Bullish Targets: $6.87 → $9.09 → $11.48 → $15.02
Deeper Bearish Targets (if support fails): $0.80 → $0.55 → $0.32
---
🟢 Bullish Scenario (Recovery Rally):
📌 Key Signal: Strong hold and price reaction above the $1.00–$1.30 zone.
1. Reversal Patterns: Look for double bottom, bullish engulfing, or strong weekly pin bars to signal a potential reversal.
2. Momentum Confirmation: A breakout above $1.95 with high volume could trigger a strong continuation to $3.11 and $4.92.
3. Macro Tailwinds: A broader recovery in Bitcoin and the crypto market could enhance bullish pressure on altcoins like RUNE.
🎯 Mid to Long-Term Bullish Targets:
$3.11 → $4.92 → $6.87+
Potential upside of 200–400%+ from current levels if bullish structure confirms.
---
🔴 Bearish Scenario (Breakdown):
📌 Critical Risk: Weekly candle close below $1.00 with volume confirmation.
1. Support Breakdown: If $1.00 fails, price may revisit previous lows around $0.80 or even test historical demand levels at $0.32.
2. Bearish Continuation Pattern: Sustained lower highs and lower lows suggest downtrend continuation unless invalidated.
3. Volume Pressure: Heavy sell volume on breakdowns reinforces bearish bias.
⚠️ Bearish Targets: $0.80 → $0.55 → $0.322 (historical low)
---
🔄 Pattern & Structure:
Historical Accumulation Zone: The yellow box has been a long-term accumulation area since 2021.
Repeat Behavior: Previous touches to this zone sparked multi-week rallies.
Potential Wyckoff Accumulation: If price forms a sideways range with rising lows, this may be the early stage of a markup phase.
---
🧠 Strategic Outlook for Traders:
✅ Bullish Strategy:
Conservative entry: Wait for breakout + retest of $1.95
Aggressive entry: Accumulate within $1.00–$1.30 zone with tight stop below $0.98
❌ Bearish Strategy:
Short setup on confirmed breakdown below $0.98
Avoid trading without confirmation of direction (no FOMO)
---
🚀 Conclusion:
RUNE is standing at a make-or-break level — a tipping point between a bullish breakout or further bearish pressure. Smart traders don't just predict direction; they prepare for both outcomes. This is not just a technical zone — it's the market’s decision point.
#RUNE #RUNEUSDT #CryptoAnalysis #AltcoinWatch #BreakoutSetup #DemandZone #TechnicalAnalysis #CryptoOutlook #BullishScenario #BearishScenario #Wyckoff

USDCAD SELLUSD/CAD rallies further, approaches 1.3900 on higher levies to Canada
The US Dollar keeps marching higher, as the Canadian Dollar struggles after Trump decided to increase tariffs to Canada to 35% from the previous 25%, escalating the trading tension with one of its main trading partners. The US President justified his decision on Canada’s alleged reluctance to cooperate on curbing the traffic of fentanyl and other drugs across the US border
The year will be politically marked by Trump’s return to the White House. A Republican government is seen as positive for financial markets, but Trump’s pledge to cut taxes and impose tariffs on foreign goods and services may introduce uncertainty to both the political and economic landscape.
Canada’s political crisis peaked in late 2024 with a no-confidence vote against Prime Minister Justin Trudeau, leading to snap elections and a weakened Liberal minority government. Policy uncertainty and economic challenges dominate 2025’s outlook, raising concerns over market stability and investor confidence.
The BoC is set to continue easing interest rates through 2025, at least at a faster pace than the Fed is expected to, which could apply pressure on CAD’s already-rising rate differential.
SUPPORT 1.38444
SUPPORT 1.38039
SUPPORT 1.37621
RESISTANCE 1.38889
RESISTANCE 1.39049

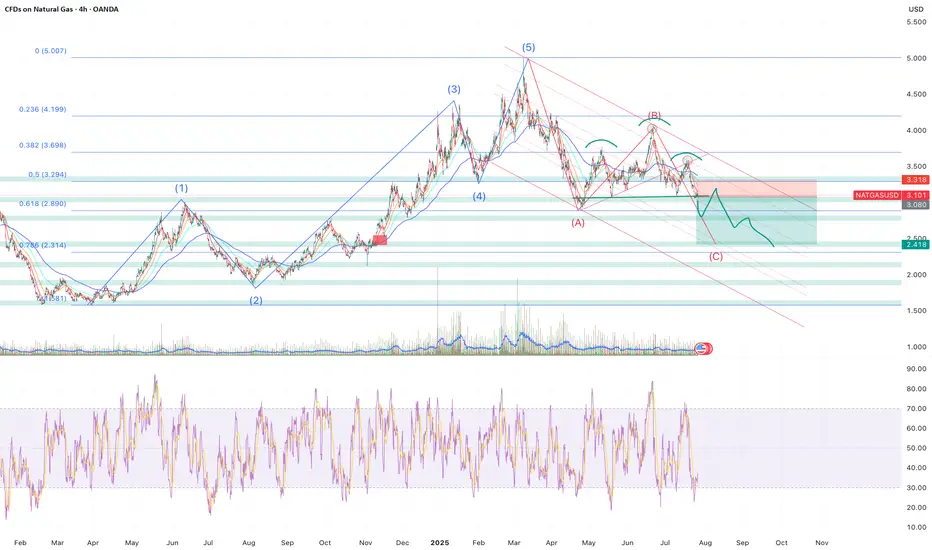
Sell NATGAS into OCT/NOVNatalie has fromed a H&S and has broke through all of the supporting EMAs leading to most of the indicators turning bearish.
My approach for the forseeable is seeling bounces until the winter season approaches.
Of course Natalie is extremely susceptible to trend changes due to economical data and has to be monitored closely. Currenlty I'm a bear.
Only selling once it breaks and retests, where I will once again reasses based on economics such as storage, production, imports and demand.
Target around $2.5 where interestingly a gap (red rectangle) sits from Nov - 24.
Elliot Wave (although not a great fan) kind of aligns as well as the 0.786 fib level which began forming at the beginning of 2024.
Storage | Volatility | Price Outlook
U.S. natural gas markets are stabilizing as volatility trends back toward seasonal norms.
📉 Volatility has dropped from 81% in Q4 2024 to 69% in mid-2025
🏪 Storage is currently at 3,075 Bcf,
🔻 4.7% lower YoY
🔺 5.9% higher than the 5-year average
🚢 LNG exports remain strong—up 22% YoY and 74% above the 5-year average
🔌 Domestic demand is seasonally weaker but steady
➡️ Despite being below last year’s levels, storage surplus vs. the 5-year average acts as a soft ceiling on price.
➡️ Historical analogs suggest a fair value range between $2.50–$3.20/MMBtu in the short term.
📊 Current price action around $3.00–$3.40 looks slightly overheated unless a fresh catalyst emerges (heatwave, export spike, etc.).
🧭 Watching for:
Injection trends over the next few weeks
Cooling demand in power sector
Resistance around $3.40
Support near $2.80
#MAGIC/USDT#MAGIC
The price is moving within a descending channel on the 1-hour frame, adhering well to it, and is on its way to breaking strongly upwards and retesting it.
We have support from the lower boundary of the descending channel, at 0.1474.
We have a downtrend on the RSI indicator that is about to break and retest, supporting the upside.
There is a major support area in green at 0.1700, which represents a strong basis for the upside.
Don't forget a simple thing: ease and capital.
When you reach the first target, save some money and then change your stop-loss order to an entry order.
For inquiries, please leave a comment.
We have a trend to hold above the 100 Moving Average.
Entry price: 0.1800.
First target: 0.1837.
Second target: 0.1900.
Third target: 0.1958.
Don't forget a simple thing: ease and capital.
When you reach your first target, save some money and then change your stop-loss order to an entry order.
For inquiries, please leave a comment.
Thank you.

0721 Impact of Japanese Senate Elections on Yen Exchange Rate Hello traders,
1. I spent the entire weekend following the Japanese Senate elections, as they will determine the fluctuations of the world's largest financing currency—the yen exchange rate.
★ The results are out, and we are currently in scenario two— the ruling coalition suffered a crushing defeat + Shigeru Ishiba refuses to resign. However, senior figures within the Liberal Democratic Party, such as Taro Aso, have publicly stated that they intend to demand Prime Minister Ishiba's resignation for accountability, increasing the pressure on Ishiba to step down. This means we might see "scenario three"—the USD/JPY exchange rate could potentially break through the 151-155 range.
★ Is this the worst-case scenario? Of course not. The worst-case scenario would be if the "far-right party" that campaigned on the slogan "Japan First" achieved a landslide victory in this election. The most notable winner is a marginal far-right party known as the "Reform Party."
The Reform Party originated from a YouTube channel during the pandemic, which spread conspiracy theories about vaccines and "global elite conspiracies." NHK estimates that the Reform Party will win up to 22 seats, whereas three years ago, they had only 1 seat in the Senate and currently have only 3 seats in the House of Representatives.
✔ Let's take a look at this big winner's political proposals—stricter immigration restrictions + opposition to globalism + opposition to radical gender policies + reassessment of decarbonization and vaccine policies + massive tax cuts + increased social welfare spending. This means Japan may implement more "radical tax cuts" combined with aggressive economic stimulus through quantitative easing, leading to a more severe depreciation of the yen, increasing the likelihood of the USD/JPY exchange rate rising to the 160 range.
★ What are the risks of a sharp depreciation of the yen?
For Asia, the depreciation of the yen typically drags down other Asian currencies collectively, especially under U.S. tariff pressures, where Asian currencies are already under devaluation pressure. A strong depreciation of the yen would mean Japan is taking other Asian countries along with it off a cliff. We need to pay attention to the "passive" depreciation of the renminbi.
Asia will feel the pain, but Europe and the U.S. will also suffer. Theoretically, if the USD/JPY exchange rate surges (indicating a sharp depreciation of the yen), it is very advantageous for arbitrage trading with leverage (because the yen becomes cheaper). However, when the yen experiences a severe depreciation, the situation changes.
Let me give you a classic example: After Shinzo Abe returned to power at the end of 2012, he launched the "three arrows" economic policy: unlimited quantitative easing monetary policy + fiscal stimulus + structural reform = artificially lowering the yen exchange rate to stimulate exports (the clear goal was to increase the USD/JPY exchange rate) = rapid depreciation of the yen (from 80 in 2012 to 125 in 2015).
So what happened then? — A large number of Japanese institutions sold off U.S. bonds, European bonds, and REITs to cash out. The reason is simple:
✔ Japanese financial institutions (such as GPIF, insurance companies, and banks) hold a large amount of dollar/euro assets. When the yen depreciates, the yen-denominated market value of these foreign currency assets skyrockets. Selling off overseas assets is equivalent to cashing out foreign exchange gains in advance.
✔ The proportion of foreign currency assets is too high → must rebalance. Due to the yen depreciation, a large institution that originally allocated 20% of its total assets to foreign currency assets might see that proportion swell to 30% or 40%. This triggers asset allocation restrictions within pension and insurance funds (ALM principles), necessitating the sale of overseas assets and reallocation to yen-denominated assets.
✔ The yen depreciation phase is usually accompanied by an expansion of the U.S.-Japan interest rate differential. If Japanese institutions hedge their dollar assets, the hedging costs become very high (the costs of hedging through FX swaps and forwards rise), so they must also sell off some assets to reduce exposure. Therefore, in 2013, there was a collective sell-off of U.S. and European bonds.
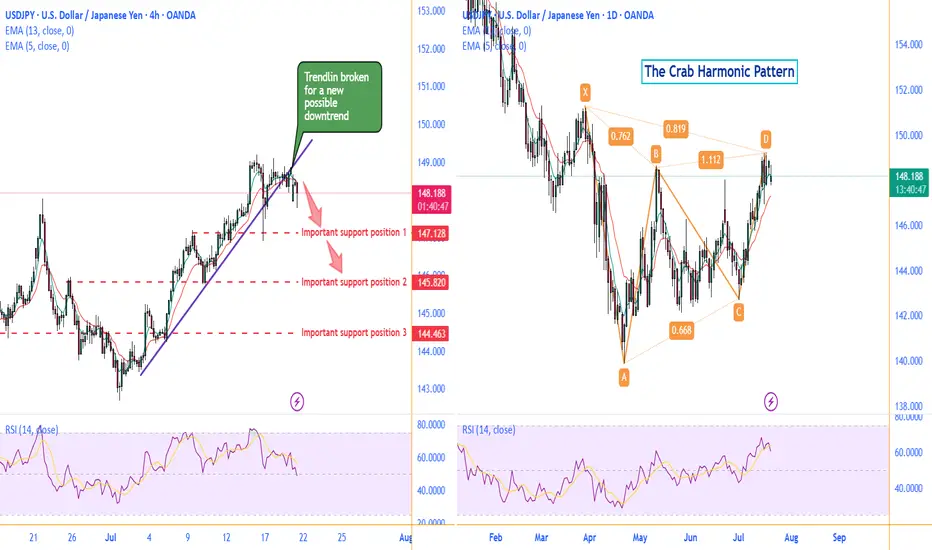
Technically:
Daily chart, there is a possible Crab Harmonic Pattern.
The Crab Harmonic Pattern
From the chart, we can see:
The upward move from A to B is labeled as 0.762, which falls within the Fibonacci ratio range of 0.618-0.786 for the A-B leg of the Crab pattern.
The downward move from B to C is labeled as 0.668, which also falls within the Fibonacci ratio range of 0.382-0.886 for the B-C leg of the Crab pattern.
The upward move from C to D is labeled as 1.112, which corresponds to the Fibonacci ratio range of 1.13-1.272 for the C-D leg of the Crab pattern.
Based on these Fibonacci ratio relationships, we can identify this price action pattern as a typical Crab harmonic pattern. This type of pattern often suggests that the price may be about to reverse.
On the left 4H chart, the broken trendline is suggesting a new possible downtrend to begin .
Make a good use of those support positions, sellers of UJ could find a great trade deal.
Follow me to get more update on UJ.
GOOD LUCK!
LESS IS MORE!
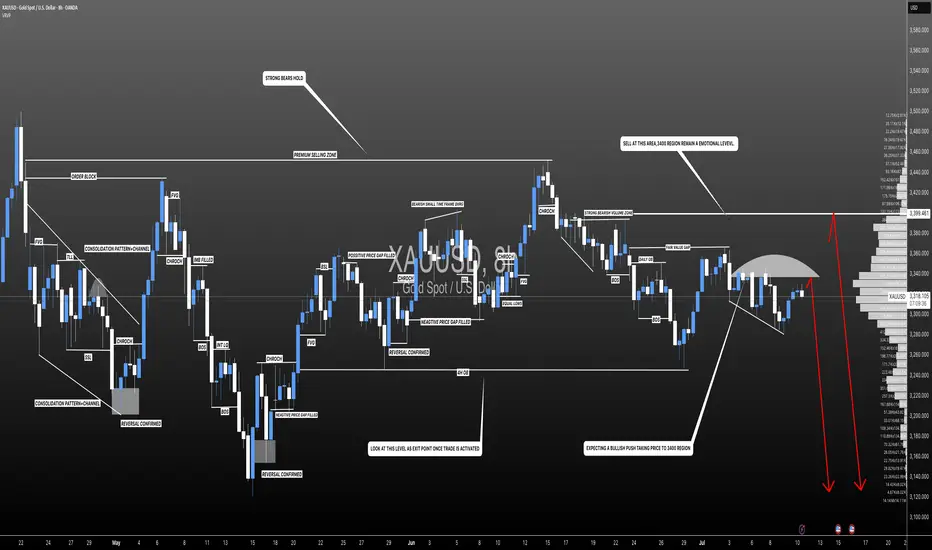
Gold Price Target: 3380-3400+, Set a Trailing StopGold Price Target: 3380-3400+, Set a Trailing Stop
As shown in Figure 4h:
Gold finally rallied this weekend.
Despite recent heavy losses for long positions, the past two days have been encouraging.
We ultimately managed to successfully buy the dip in the 3280-3300 range and recover all our losses.
Gold prices continue to rise, and everyone is asking if it's time to sell.
Now is the critical time to exit.
We must acknowledge one fact:
Gold currently presents a huge opportunity.
Of course, the risks are also increasing.
At times like these, I always emphasize that the best approach is to set a 10-point trailing stop.
Even if gold prices soar, we can move with them.
This non-farm payroll data was a huge disappointment.
It was a truly positive surprise for gold.
The market expected 110,000 new jobs, but the result was a disappointing 73,000, a decrease of half from the previous month.
The market went into a tizzy after the outperformance. But even more shocking news is yet to come: Non-farm payrolls for May and June were revised downward by a combined 258,000.
This means the June gain was revised downward from 140,000 to 14,000.
The May gain was abruptly revised downward from 140,000 to 19,000.
The strong data of the past two months was completely false.
Market followers have become the "clowns" of the Fed and Trump.
Now you understand why everyone praised Powell's hawkish speech two days ago.
Because Powell said: "Only if there is a severe decline in employment will we consider cutting interest rates."
Just this Wednesday, some good non-farm payroll data was released.
This undoubtedly gave the market a false impression.
Everyone believed that a rate cut was impossible, and the probability of a September cut had dropped to 40%.
However, today's poor non-farm payroll data, combined with revisions to May and June data, revealed the truth.
The job market has been dismal over the past quarter.
The market reacted quickly, and gold prices soared on this sentiment.
My advice is to buy gold at a low price and hold on.
For investors who have successfully bought in the 3280-3300 level in recent days, I recommend setting a 10-15 pip trailing stop-loss.
Gold prices are likely to continue their upward trend next Monday.
Our next target is above 3380-3400 points.

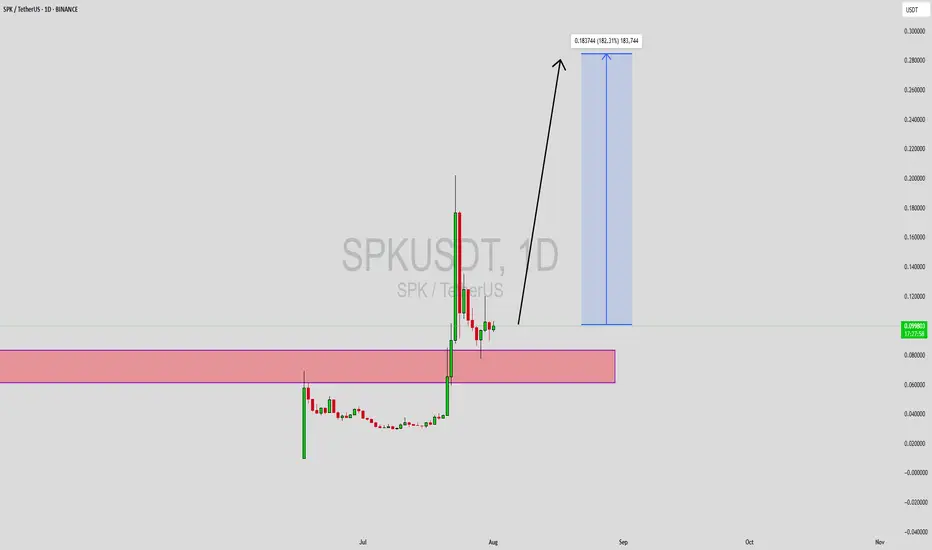
SPKUSDT Forming Bullish ReversalSPKUSDT is currently showing signs of a strong bullish reversal pattern, positioning itself as one of the most technically attractive altcoins on the radar. After an extended downtrend, the price has found solid support at a key demand zone, which has historically acted as a base for significant rallies. The latest price action has formed a clear reversal structure, signaling a potential shift in momentum from sellers to buyers. This early signal of trend reversal is supported by increasing volume, indicating strong accumulation at lower levels.
This setup is gaining traction among traders and crypto investors who are beginning to take interest in SPK due to its attractive risk-to-reward ratio and potential for explosive gains. The expected move targets a 140% to 150% upside, which aligns with previous recovery waves observed in similar patterns. Technical indicators such as the RSI and MACD may also begin to align in favor of bulls, further supporting the thesis for a major trend reversal. This gives traders the confidence to anticipate a breakout rally in the coming weeks.
The fundamentals behind SPKUSDT are also gaining visibility, as the project's roadmap and utility continue to attract community attention. In the current market cycle, low-cap and mid-cap assets that show early reversal signs often outperform during recovery phases. With growing investor interest and a chart that supports a major move, SPKUSDT is a pair that deserves close monitoring. The breakout confirmation above recent resistance levels could act as a strong signal for the next upward leg.
This is a prime opportunity for swing and mid-term traders to take advantage of a potentially explosive move. With volume building and sentiment improving, SPKUSDT could be setting up for a rally that outpaces many other altcoins in the same category.
✅ Show your support by hitting the like button and
✅ Leaving a comment below! (What is You opinion about this Coin)
Your feedback and engagement keep me inspired to share more insightful market analysis with you!
GBP/JPY H4 | Bullish bounce offGBP/JPY is falling towards the buy entry, which is an overlap support that lines up with the 61.8% Fibonacci retracement and could bounce to the take profit.
Buy entry is at 197.99, which is an overlap support that aligns with the 61.8% Fibonacci retracement.
Stop loss is at 196.90, which is a swing low support.
Take profit is at 199.73, which is a multi-swing high resistance.
High Risk Investment Warning
Trading Forex/CFDs on margin carries a high level of risk and may not be suitable for all investors. Leverage can work against you.
Stratos Markets Limited (tradu.com ):
CFDs are complex instruments and come with a high risk of losing money rapidly due to leverage. 65% of retail investor accounts lose money when trading CFDs with this provider. You should consider whether you understand how CFDs work and whether you can afford to take the high risk of losing your money.
Stratos Europe Ltd (tradu.com ):
CFDs are complex instruments and come with a high risk of losing money rapidly due to leverage. 66% of retail investor accounts lose money when trading CFDs with this provider. You should consider whether you understand how CFDs work and whether you can afford to take the high risk of losing your money.
Stratos Global LLC (tradu.com ):
Losses can exceed deposits.
Please be advised that the information presented on TradingView is provided to Tradu (‘Company’, ‘we’) by a third-party provider (‘TFA Global Pte Ltd’). Please be reminded that you are solely responsible for the trading decisions on your account. There is a very high degree of risk involved in trading. Any information and/or content is intended entirely for research, educational and informational purposes only and does not constitute investment or consultation advice or investment strategy. The information is not tailored to the investment needs of any specific person and therefore does not involve a consideration of any of the investment objectives, financial situation or needs of any viewer that may receive it. Kindly also note that past performance is not a reliable indicator of future results. Actual results may differ materially from those anticipated in forward-looking or past performance statements. We assume no liability as to the accuracy or completeness of any of the information and/or content provided herein and the Company cannot be held responsible for any omission, mistake nor for any loss or damage including without limitation to any loss of profit which may arise from reliance on any information supplied by TFA Global Pte Ltd.
The speaker(s) is neither an employee, agent nor representative of Tradu and is therefore acting independently. The opinions given are their own, constitute general market commentary, and do not constitute the opinion or advice of Tradu or any form of personal or investment advice. Tradu neither endorses nor guarantees offerings of third-party speakers, nor is Tradu responsible for the content, veracity or opinions of third-party speakers, presenters or participants.

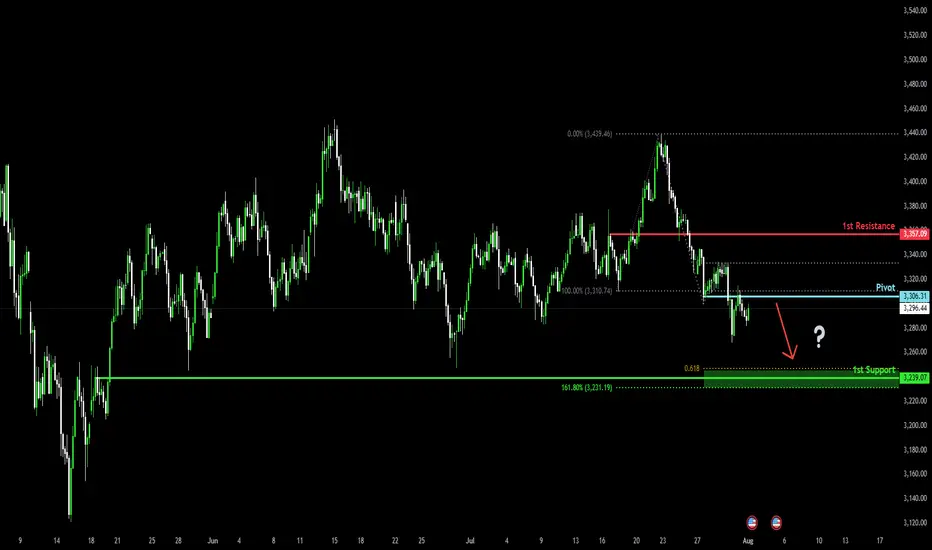
Potential bearish drop?The Gold (XAU/USD) has reacted off the pivot and could drop to the 1st support.
Pivot: 3,306.31
1st Support: 3,239.07
1st Resistance: 3,357.09
Risk Warning:
Trading Forex and CFDs carries a high level of risk to your capital and you should only trade with money you can afford to lose. Trading Forex and CFDs may not be suitable for all investors, so please ensure that you fully understand the risks involved and seek independent advice if necessary.
Disclaimer:
The above opinions given constitute general market commentary, and do not constitute the opinion or advice of IC Markets or any form of personal or investment advice.
Any opinions, news, research, analyses, prices, other information, or links to third-party sites contained on this website are provided on an "as-is" basis, are intended only to be informative, is not an advice nor a recommendation, nor research, or a record of our trading prices, or an offer of, or solicitation for a transaction in any financial instrument and thus should not be treated as such. The information provided does not involve any specific investment objectives, financial situation and needs of any specific person who may receive it. Please be aware, that past performance is not a reliable indicator of future performance and/or results. Past Performance or Forward-looking scenarios based upon the reasonable beliefs of the third-party provider are not a guarantee of future performance. Actual results may differ materially from those anticipated in forward-looking or past performance statements. IC Markets makes no representation or warranty and assumes no liability as to the accuracy or completeness of the information provided, nor any loss arising from any investment based on a recommendation, forecast or any information supplied by any third-party.
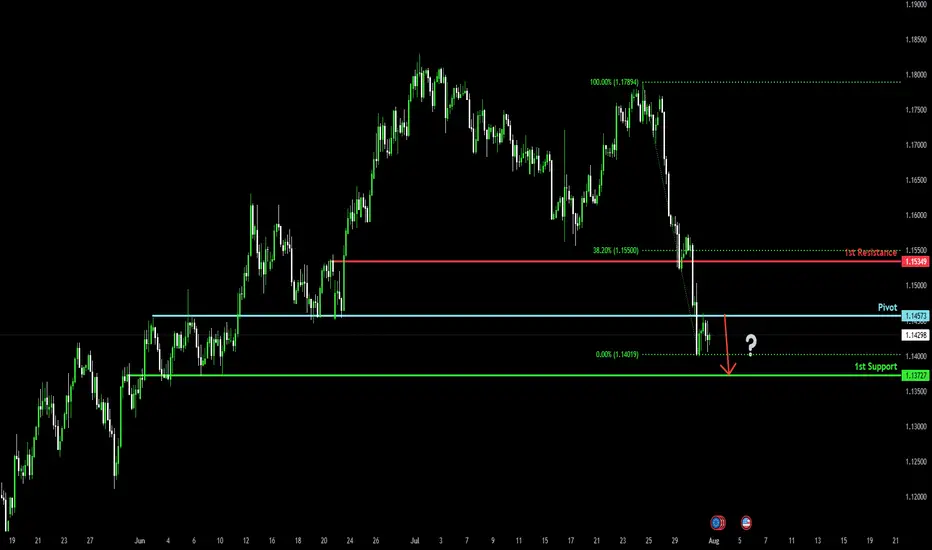
Bearish drop?The Fiber (EUR/USD) has rejected off the pivot and could potentially drop to the 1st support, which acts as an overlap support.
Pivot: 1.1457
1st Support: 1.1372
1st Resistance: 1.1534
Risk Warning:
Trading Forex and CFDs carries a high level of risk to your capital and you should only trade with money you can afford to lose. Trading Forex and CFDs may not be suitable for all investors, so please ensure that you fully understand the risks involved and seek independent advice if necessary.
Disclaimer:
The above opinions given constitute general market commentary, and do not constitute the opinion or advice of IC Markets or any form of personal or investment advice.
Any opinions, news, research, analyses, prices, other information, or links to third-party sites contained on this website are provided on an "as-is" basis, are intended only to be informative, is not an advice nor a recommendation, nor research, or a record of our trading prices, or an offer of, or solicitation for a transaction in any financial instrument and thus should not be treated as such. The information provided does not involve any specific investment objectives, financial situation and needs of any specific person who may receive it. Please be aware, that past performance is not a reliable indicator of future performance and/or results. Past Performance or Forward-looking scenarios based upon the reasonable beliefs of the third-party provider are not a guarantee of future performance. Actual results may differ materially from those anticipated in forward-looking or past performance statements. IC Markets makes no representation or warranty and assumes no liability as to the accuracy or completeness of the information provided, nor any loss arising from any investment based on a recommendation, forecast or any information supplied by any third-party.