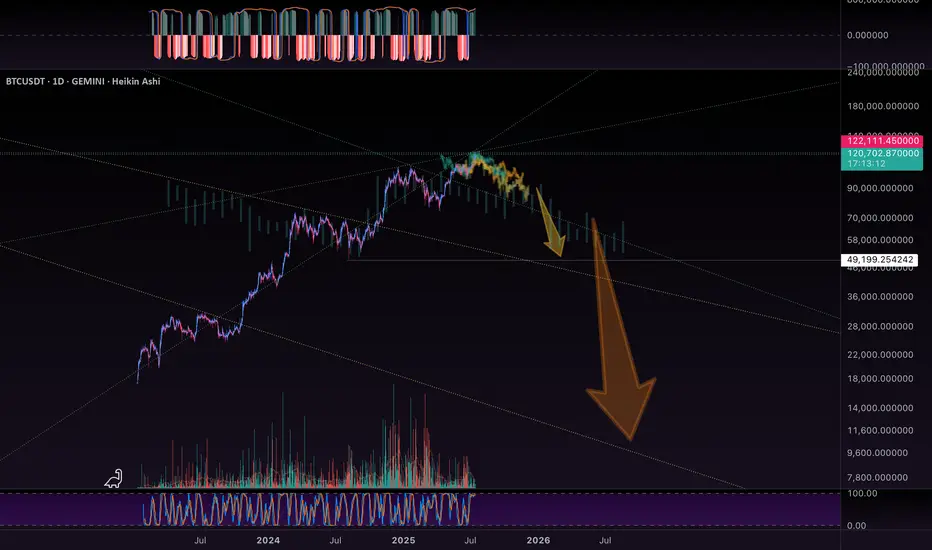
BTC - Historic Levels to CheckBTC has some checking in to do…. On historic resistance levels…
I drew in the major ones visible on this chart… and the initial bearish fractal, which was shown to us previously int he chart.
It will fractal for each arrow.
Pump and Dump!
Im going to run my DOGe.
See my linked post below for a bigger picture view of all this.
Harmonic Patterns
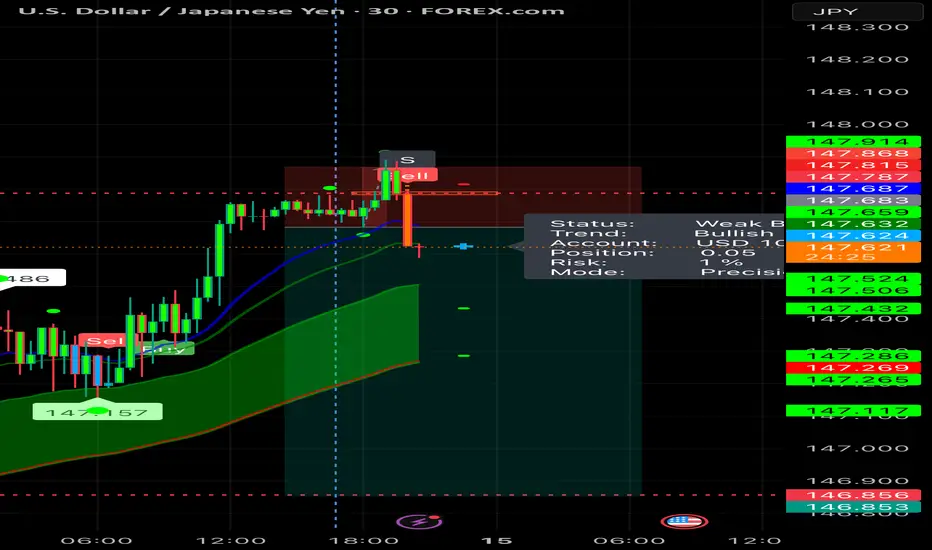
Bitcoin long from 114kWaiting for cme gap to close at that region.
We also have a fvg . Looking for longs.
Continuation higher is a must.

MUBARAK/USDT Ready to Explode? Final Compression Phase?
📊 Complete Technical Analysis – 12H Timeframe (BINANCE)
The MUBARAK/USDT pair is currently in a tight consolidation phase, forming a classic Symmetrical Triangle pattern. This structure indicates mounting pressure from both buyers and sellers, typically leading to a high-volatility breakout once the price escapes the triangle boundaries.
🔺 Pattern: Symmetrical Triangle – Sign of Impending Volatility
Rising Support Trendline (Higher Lows): Shows that buyers are gradually pushing price higher from each dip.
Descending Resistance Trendline (Lower Highs): Sellers are still active, but their strength is weakening over time.
Declining Volume: A healthy consolidation — decreasing volume is a hallmark of triangles before big moves.
Although neutral by nature, in this context, the bullish momentum seems stronger as price holds above key support.
🎯 Key Price Levels:
Price Level Description
0.04811 Breakout zone & first resistance
0.05381 Short-term target post-breakout
0.06000 Psychological resistance and reaction zone
0.06612 Maximum target based on triangle height projection
🟢 Bullish Scenario:
If price successfully breaks above the triangle’s resistance line and closes above 0.0481 USDT with strong volume:
Potential rally toward the 0.053 – 0.066 USDT range.
Triangle projection suggests a move of +50% or more from current levels.
Breakout confirmation: 12H candle close above 0.050 with above-average volume.
📌 Note: A post-breakout retest of the breakout line can offer a second entry opportunity if it holds as new support.
🔴 Bearish Scenario:
If the price breaks below the ascending support line:
Price may drop toward the demand zone between 0.034 – 0.030 USDT.
A deeper correction may target the previous low at 0.0208 USDT.
Watch for fakeouts — low-volume breakdowns may not hold.
🧠 Risk-Reward Strategy:
Aggressive Entry: On strong breakout above 0.048 with rising volume.
Conservative Entry: Wait for breakout confirmation + successful retest.
Stop Loss: Below 0.041 or just under the triangle's lower boundary.
Targets: TP1 at 0.053, TP2 at 0.060, TP3 at 0.066 (max range).
✅ Conclusion:
MUBARAK/USDT is at a critical juncture—a likely breakout from this symmetrical triangle could trigger a significant directional move. Traders should closely monitor volume spikes and candle closures for confirmation. This could be the beginning of a new trend phase for this asset.
#MUBARAKUSDT #CryptoBreakout #SymmetricalTriangle #AltcoinAnalysis #TechnicalSetup #TradingSignals #BullishSetup #BearishRisk #PriceAction

XAUUSD MULTI TIME FRAME ANALYSISHello traders , here is the full multi time frame analysis for this pair, let me know in the comment section below if you have any questions , the entry will be taken only if all rules of the strategies will be satisfied. wait for more price action to develop before taking any position. I suggest you keep this pair on your watchlist and see if the rules of your strategy are satisfied.
🧠💡 Share your unique analysis, thoughts, and ideas in the comments section below. I'm excited to hear your perspective on this pair .
💭🔍 Don't hesitate to comment if you have any questions or queries regarding this analysis.

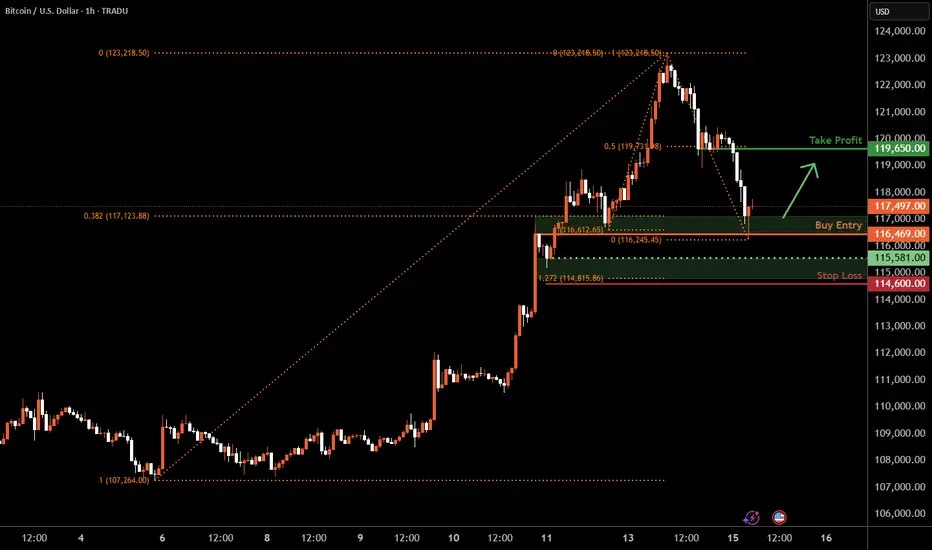
Bitcoin H1 | Potential bounce off a pullback supportBitcoin (BTC/USD) is falling towards a pullback support and could potentially bounce off this level to climb higher.
Buy entry is at 116,469.00 which is a pullback support that aligns closely with the 38.2% Fibonacci retracement.
Stop loss is at 114,600.00 which is a level that lies underneath a swing-low support and the 127.2% Fibonacci extension.
Take profit is at 119,650.00 which is a pullback resistance that aligns with the 50% Fibonacci retracement.
High Risk Investment Warning
Trading Forex/CFDs on margin carries a high level of risk and may not be suitable for all investors. Leverage can work against you.
Stratos Markets Limited (tradu.com ):
CFDs are complex instruments and come with a high risk of losing money rapidly due to leverage. 63% of retail investor accounts lose money when trading CFDs with this provider. You should consider whether you understand how CFDs work and whether you can afford to take the high risk of losing your money.
Stratos Europe Ltd (tradu.com ):
CFDs are complex instruments and come with a high risk of losing money rapidly due to leverage. 63% of retail investor accounts lose money when trading CFDs with this provider. You should consider whether you understand how CFDs work and whether you can afford to take the high risk of losing your money.
Stratos Global LLC (tradu.com ):
Losses can exceed deposits.
Please be advised that the information presented on TradingView is provided to Tradu (‘Company’, ‘we’) by a third-party provider (‘TFA Global Pte Ltd’). Please be reminded that you are solely responsible for the trading decisions on your account. There is a very high degree of risk involved in trading. Any information and/or content is intended entirely for research, educational and informational purposes only and does not constitute investment or consultation advice or investment strategy. The information is not tailored to the investment needs of any specific person and therefore does not involve a consideration of any of the investment objectives, financial situation or needs of any viewer that may receive it. Kindly also note that past performance is not a reliable indicator of future results. Actual results may differ materially from those anticipated in forward-looking or past performance statements. We assume no liability as to the accuracy or completeness of any of the information and/or content provided herein and the Company cannot be held responsible for any omission, mistake nor for any loss or damage including without limitation to any loss of profit which may arise from reliance on any information supplied by TFA Global Pte Ltd.
The speaker(s) is neither an employee, agent nor representative of Tradu and is therefore acting independently. The opinions given are their own, constitute general market commentary, and do not constitute the opinion or advice of Tradu or any form of personal or investment advice. Tradu neither endorses nor guarantees offerings of third-party speakers, nor is Tradu responsible for the content, veracity or opinions of third-party speakers, presenters or participants.
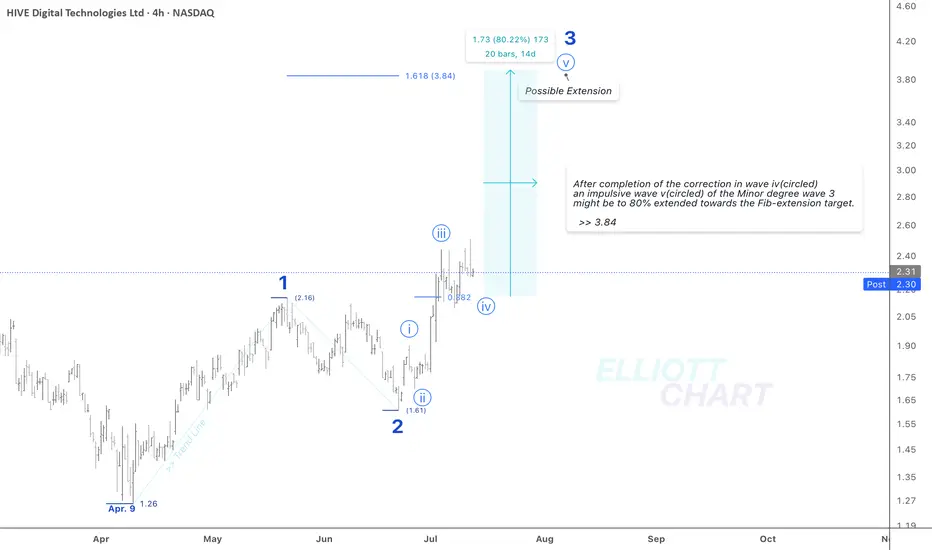
$HIVE / 4hAs depicted in the 4h-frame above, NASDAQ:HIVE may have developed a sequence of Minor degree waves upward >> 1, 2, and an impulse 3, which remains in progress, since April 9.
Wave Analysis >> After completion of the ongoing correction in wave iv(circled), an impulsive wave v(circled) of the Minor degree wave 3 might be to 80% extended towards the Fib-extension target >> 3.84.
#CryptoStocks #HIVE #BTCMining #Bitcoin #BTC
NASDAQ:HIVE CRYPTOCAP:BTC MARKETSCOM:BITCOIN
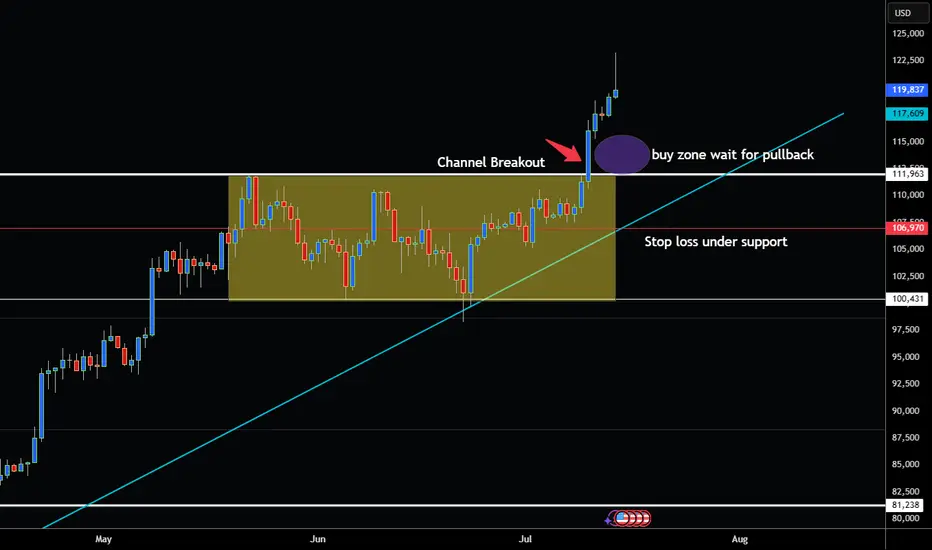
BITCOIN BREAKS OUT OF CHANNEL AND NOW AT ALL TIME HIGHS!Hey Traders wow just a few week ago I was watching to see if it was going to pullback instead smashes above all time high. Thats how quick these markets can change in the blink of an eye!
Lesson here (Always Expect the Unexpected in the Markets!) 😁
Ok so now we have channel breakout above resistance at 112,100. About 70% of the time market will retest this level before continuing the trend.
This could be a great place to buy on the pullback!
So if your bullish buy around $112,100-113,000 I would recommend a wide stop to give the market room to breath around 106,970.
However if bearish I would not consider selling unless market has complete reversal and has daily close below uptrendline at 106,000 .
Bears Be careful because this Bull looks like it has Horns!
Good Luck & Always use Risk Management!
(Just in we are wrong in our analysis most experts recommend never to risk more than 2% of your account equity on any given trade.)
Hope This Helps Your Trading 😃
Clifford
Litecoin (LTC): Seeing Strong Upside Potential | Bullish TradeLitecoin caught our attention with a nice breakout and buy-side volume dominance, where we are seeing 2 good trades that can be taken, both with a decent R:R ratio.
More in-depth info is in the video—enjoy!
Swallow Academy

BNBUSD – Bull Lost the GripBNB printed a lower high near $705, then broke trend support near $695. A slow grind lower followed with minor bounces failing to reclaim key levels. Price now sits near $675 and shows bearish lower highs and descending structure. Watch $672–675 for bounce or breakdown — reclaim of $685 needed to turn bullish.

USDZAR Support CallingUSDZAR will short towards the support area at 17,73. Currently price is showing strong bearish reversal signs. Sells active from 19,91 to 17,73

eurnzd sell signal. Don't forget about stop-loss.
Write in the comments all your questions and instruments analysis of which you want to see.
Friends, push the like button, write a comment, and share with your mates - that would be the best THANK YOU.
P.S. I personally will open entry if the price will show it according to my strategy.
Always make your analysis before a trade

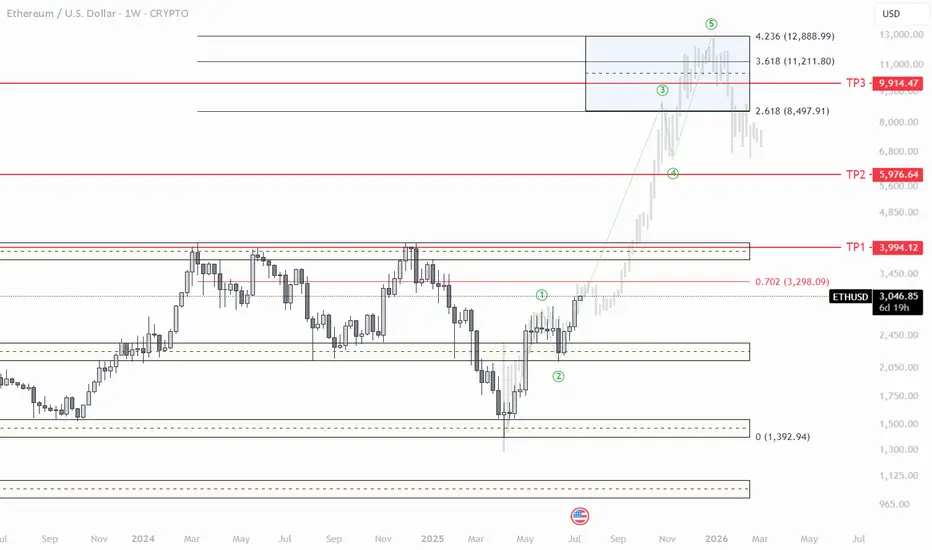
ETH Cycle TopETH is following a very similar setup to BTC in the previous cycle. This move should play out by the end of the year.


#ZIL/USDT Descending channel ?#ZIL
The price is moving within a descending channel on the 1-hour frame and is expected to break and continue upward.
We have a trend to stabilize above the 100 moving average once again.
We have a downtrend on the RSI indicator that supports the upward break.
We have a support area at the lower boundary of the channel at 0.01022, acting as strong support from which the price can rebound.
We have a major support area in green that pushed the price upward at 0.01010.
Entry price: 0.01034
First target: 0.01061
Second target: 0.01097
Third target: 0.01135
To manage risk, don't forget stop loss and capital management.
When you reach the first target, save some profits and then change the stop order to an entry order.
For inquiries, please comment.
Thank you.

#AUCTION/USDT#AUCTION
The price is moving within a descending channel on the 1-hour frame, adhering well to it, and is heading for a strong breakout and retest.
We are experiencing a rebound from the lower boundary of the descending channel, which is support at 11.40.
We are experiencing a downtrend on the RSI indicator that is about to be broken and retested, supporting the upward trend.
We are looking for stability above the 100 Moving Average.
Entry price: 11.92
First target: 12.21
Second target: 12.53
Third target: 12.86

#DOGS/USDT#DOGS
The price is moving within a descending channel on the 1-hour frame and is expected to break and continue upward.
We have a trend to stabilize above the 100 moving average once again.
We have a downtrend on the RSI indicator that supports the upward move with a breakout.
We have a support area at the lower boundary of the channel at 0.0001370, acting as strong support from which the price can rebound.
We have a major support area in green that pushed the price upward at 0.0001330.
Entry price: 0.0001380.
First target: 0.0001422.
Second target: 0.0001490.
Third target: 0.0001562.
To manage risk, don't forget stop loss and capital management.
When you reach the first target, save some profits and then change the stop order to an entry order.
For inquiries, please comment.
Thank you.

BABA – Dollar Cost Averaging Opportunityhi Traders,
Let's have a look at BABA.
Alibaba (BABA) appears to be approaching the end of its correction phase within a well-defined ascending channel. Based on the current price action and technical setup, we believe now is a good time to begin dollar cost averaging into this stock.
Our identified buy zone lies between $108 and $100, where price intersects the lower trendline support and key EMAs (20/50/100/200). This area offers a strong risk-reward setup for medium- and long-term investors.
The mid-term target for this trade is $160, which aligns with the upper channel resistance and previous price structure. However, from a long-term perspective, we anticipate that BABA will resume its growth trajectory and eventually surpass its previous all-time highs.
Supporting this idea, the RSI is stabilizing in neutral territory, suggesting that momentum is resetting and may shift bullish as price finds support.
Summary:
🔁 Strategy: Dollar cost averaging
🟩 Buy zone: $108 – $100
🎯 Mid-term target: $160
🚀 Long-term view: Return to growth and new ATH
📉 Correction nearing completion; bullish structure remains intact
This setup offers an attractive entry point for patient investors aiming to ride the next major upside cycle in Alibaba.

PNUTUSDT UPDATE
Pattern : Falling Wedge Breakout
Current Price: \$0.2842
Target Price: \$0.40, \$0.45
Target % Gain: 100.34%
Technical Analysis: PNUT has broken out of a falling wedge pattern on the 12H chart, signaling a bullish reversal. Volume surged on the breakout, confirming strength. Retest held well, indicating momentum for further upside.
Time Frame: 12H
Risk Management Tip: Always Use proper risk management.

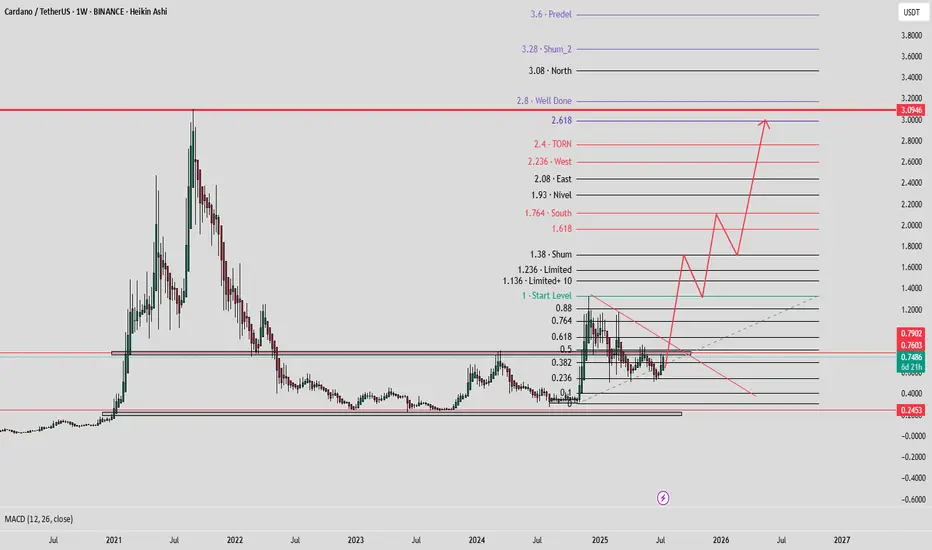
3ADA Almazov Projection#ADAUSD ALMAZOV PROJECTION WEEKLY
Price projection according to Almazov's theory, #ADA should at least touch $1,71 before pulling back or continuing to go long if its dimensionality decreases (2.0).
BABYUSDT UPDATE
Pattern: Falling Wedge Breakout
Current Price: \$0.05396
Target Price: \$0.11277
Target % Gain: 110.04%
Technical Analysis: BABY has broken out of a falling wedge on the 1D chart, signaling a bullish reversal. Price is holding above the breakout trendline with increasing momentum, confirming the setup.
Time Frame: 1D

