JUVUSDT Forming Bullish MomentumJUVUSDT is showing signs of a strong recovery from its recent consolidation phase, with a clear bullish momentum starting to emerge. The price action has bounced confidently from a well-defined support zone, highlighted in the chart, and buyers have stepped in aggressively. This indicates strong market interest and could be the early stage of a new upward trend. The expected upside potential ranges from 30% to 40%+, supported by increasing volume and favorable sentiment.
The token is now trading just above a key breakout zone, which has historically acted as resistance but is now turning into strong support. This shift in market structure is often a signal of a bullish reversal. Given the recent breakout attempt and minor pullback for retesting, the chart suggests JUVUSDT may be gearing up for a significant push toward the next resistance level. Technical indicators such as RSI and MACD also hint at further bullish continuation if current levels hold.
Investor interest in JUV is steadily growing, with fundamentals and market sentiment aligning to support a short-to-mid-term rally. The project’s presence in the fan token sector, along with improving volume trends on major exchanges like Binance, reflects increasing confidence among traders and crypto investors.
Traders keeping a close eye on potential breakout setups should not overlook JUVUSDT. The current technical setup offers a promising opportunity with a favorable risk-reward ratio, especially if the bullish momentum accelerates from here.
✅ Show your support by hitting the like button and
✅ Leaving a comment below! (What is You opinion about this Coin)
Your feedback and engagement keep me inspired to share more insightful market analysis with you!
Harmonic Patterns

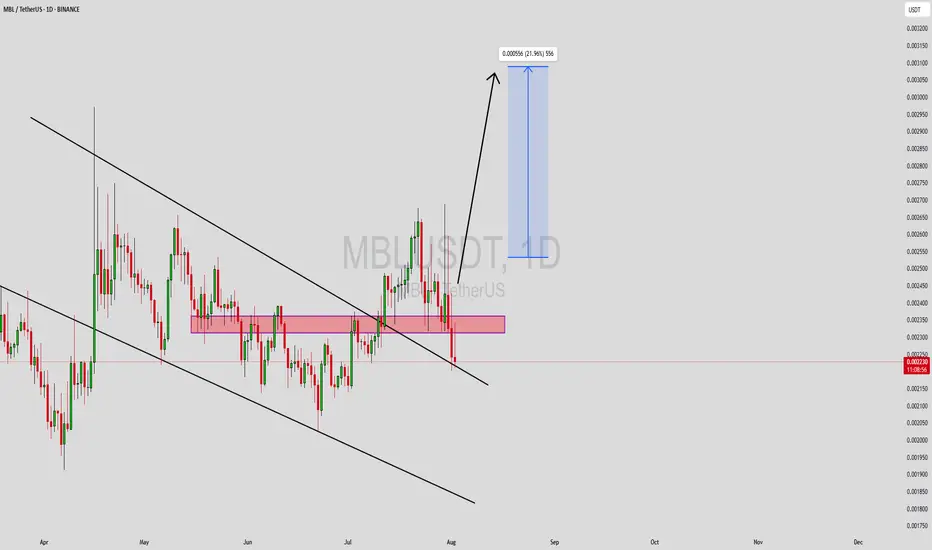
MBLUSDT Forming Bullish ReversalMBLUSDT is currently exhibiting signs of a bullish reversal pattern, indicating a potential trend shift in favor of the bulls. After an extended downtrend, the price appears to have found strong support, which is now serving as a base for upward momentum. This structure is often seen before a breakout rally, especially when paired with a steady increase in trading volume—suggesting accumulation by informed investors.
The recent price action confirms growing investor confidence in the MBL project. With volume picking up and a bullish reversal structure forming on the chart, traders are beginning to position for an anticipated move to the upside. Technical indicators support this sentiment, aligning with a potential gain of 20% to 30%+ in the short term if the current momentum is sustained.
As broader market sentiment continues to recover, MBLUSDT stands out with a clean technical pattern that offers a favorable risk-to-reward ratio. The combination of healthy volume, a well-defined support zone, and early signs of bullish continuation make this setup appealing to both swing traders and mid-term holders watching for breakout confirmation.
MBL’s fundamentals are also garnering interest, adding to the technical strength seen on the chart. If buyers continue stepping in near support levels, the breakout target could be reached faster than expected.
✅ Show your support by hitting the like button and
✅ Leaving a comment below! (What is You opinion about this Coin)
Your feedback and engagement keep me inspired to share more insightful market analysis with you!
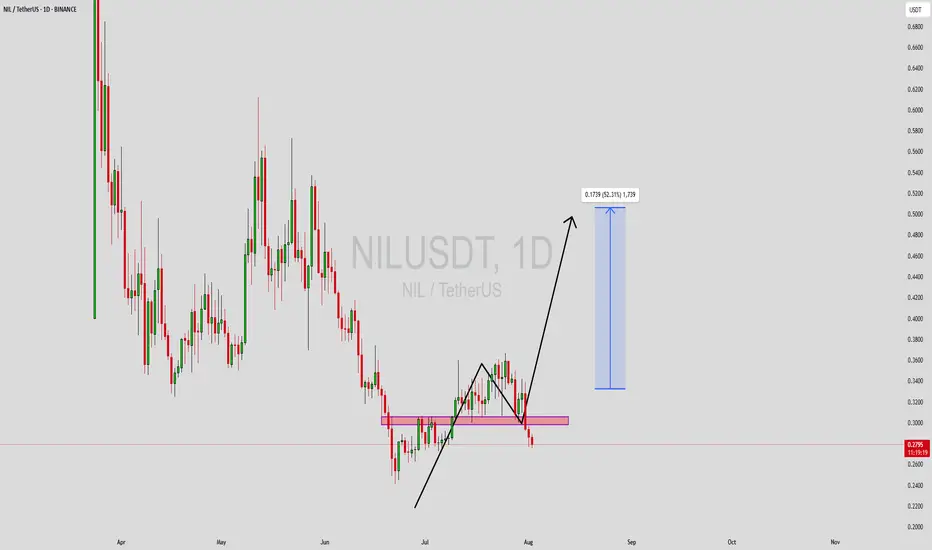
NILUSDT Forming Potential BullishNILUSDT is currently forming an interesting technical setup on the daily chart, hinting at a potential bullish move in the near term. The price structure recently broke out from a consolidation phase and tested the previous support-turned-resistance zone, which is now acting as a key demand area. The market has shown some short-term correction but is likely preparing for a bounce from this level, targeting a potential gain of 40% to 50%.
The projected move is supported by a healthy uptick in volume, suggesting accumulation and growing investor interest. With price action forming a potential higher low near the support zone, this area could become a strong launchpad for the next leg up. The market sentiment for NILUSDT seems to be shifting toward the bullish side, which aligns with the setup shown on the chart.
Technically, if buyers regain control and push the price above the recent local high, we may see rapid movement toward the target zone marked around a 52% gain from current levels. This makes NILUSDT a favorable candidate for short to mid-term traders looking to capitalize on breakout continuation setups.
Overall, NILUSDT appears to be at a crucial technical junction. The current zone could offer a good risk-to-reward entry opportunity for trend-following traders watching for bullish confirmations.
✅ Show your support by hitting the like button and
✅ Leaving a comment below! (What is You opinion about this Coin)
Your feedback and engagement keep me inspired to share more insightful market analysis with you!
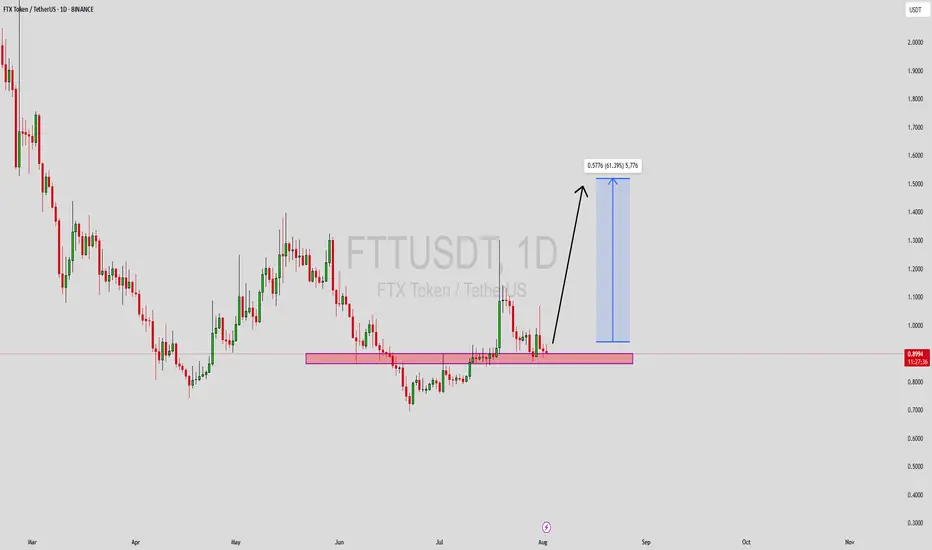
FTTUSDT Forming Bullish MomentumFTTUSDT is showing renewed strength with a clean breakout setup, supported by good volume and strong technical structure. The current chart reveals a clear horizontal support zone that has been tested multiple times and held firmly, indicating buyers are stepping in with confidence. After the recent consolidation, the price appears ready to move higher, potentially offering a 40% to 50% upside in the near term. This setup attracts attention from technical traders looking for confirmation through volume spikes and bullish candlestick formations.
What makes this chart setup even more compelling is the emerging bullish momentum following the reclaim of a key support area. The market has seen a steady accumulation phase, and the subsequent price action shows strength above the highlighted zone, suggesting a possible retest and continuation to the upside. With investor sentiment improving around FTX Token (FTT) and increasing market activity, the possibility of a significant rally becomes more likely, especially if price closes firmly above recent resistance levels.
Investors are taking interest in this project again despite past uncertainties, as the price action begins to signal recovery potential. The projected target from this setup points toward a measured move that aligns well with a 40%+ gain, assuming the broader market remains favorable. It's a promising opportunity for mid-term traders watching for bullish continuations backed by strong volume and sentiment.
If this breakout sustains, FTTUSDT could regain traction as a high-risk, high-reward play. Watching how the price behaves around the current support and near-term resistance will be critical for short-term traders aiming to capitalize on this potential upside.
✅ Show your support by hitting the like button and
✅ Leaving a comment below! (What is You opinion about this Coin)
Your feedback and engagement keep me inspired to share more insightful market analysis with you!
MDTUSDT Forming Bullish WaveMDTUSDT is currently forming a bullish wave pattern, indicating a strong potential for continued upward momentum. This wave structure reflects healthy market cycles, with higher highs and higher lows suggesting that bulls are steadily gaining control. As this wave pattern matures, the current market setup hints at a possible breakout, which could push prices significantly higher in the near term.
The volume backing MDTUSDT is robust, which provides a solid confirmation for the ongoing trend. Good volume during the accumulation and breakout phases is essential for sustaining a bullish wave. If the pair maintains its current buying pressure, traders could expect a strong rally, with a projected gain between 90% to 100% based on historical wave completions and resistance breakouts.
Investors and traders have started showing increasing interest in MDT, further validating its bullish potential. This growing attention not only boosts market confidence but also contributes to stronger liquidity, which is critical for smooth and sustained upward movement. Technical traders watching for confirmation of the next wave will likely key in on breakout zones and RSI/volume confluences.
In summary, MDTUSDT is showing signs of entering a powerful bullish continuation phase, supported by strong volume and increasing market interest. As the wave structure plays out, this pair could offer an excellent opportunity for swing traders aiming for mid-to-high double-digit returns.
✅ Show your support by hitting the like button and
✅ Leaving a comment below! (What is You opinion about this Coin)
Your feedback and engagement keep me inspired to share more insightful market analysis with you!

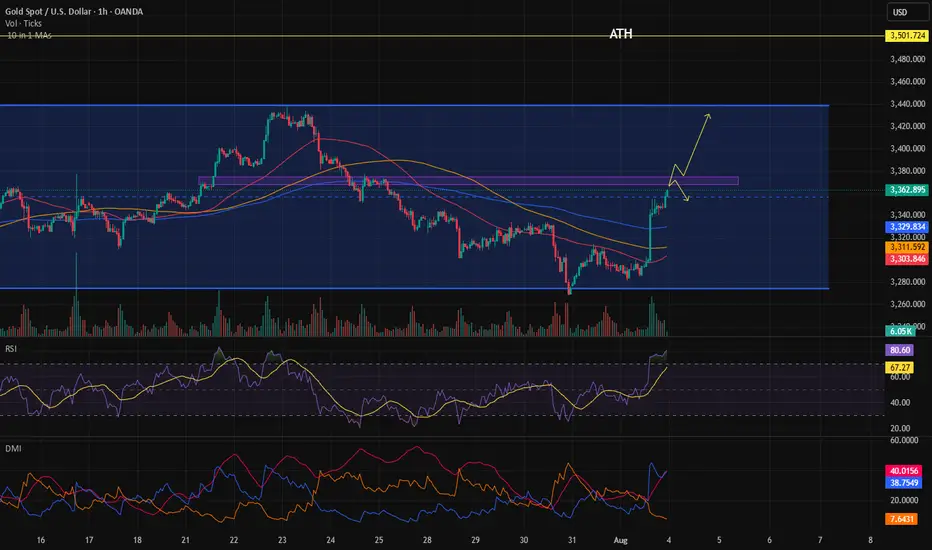
Trend continuation or reversal?Gold bounced strongly from the bottom of the higher time frame channel, and we should also consider that this bounce was triggered by news that was negative for the dollar on Friday. Now we need to wait and see whether this move is truly strong or if it's going to turn out to be a fake and head back down toward the bottom of the channel.
Downtrend not over yet !First upside attact till $171.
Then continue about to $150.
Up for 2 days, down for 2-4 days last time before the next mid term uptrend.

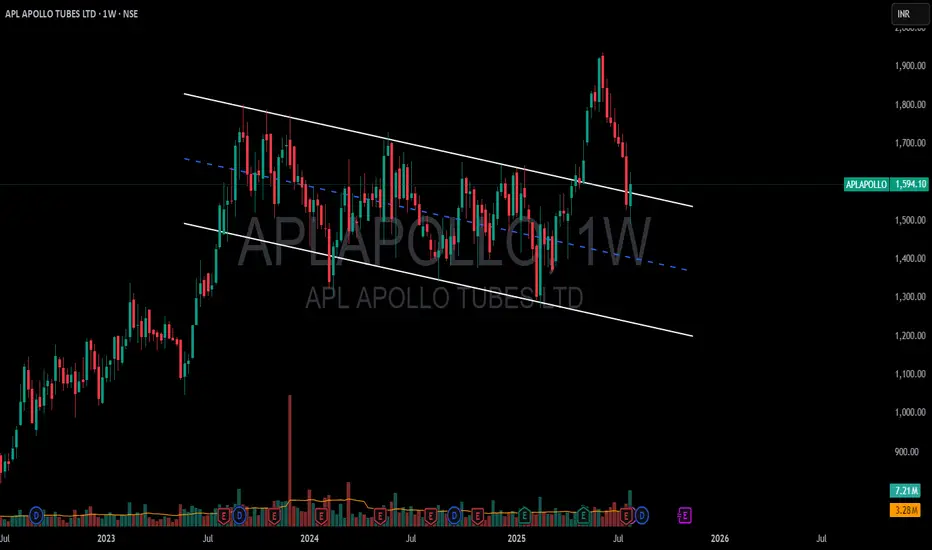
APL APOLLO TUBES Ltd. 1W📈 APL Apollo Tubes Ltd. – Bullish Channel Breakout
🔍 Pattern Insight:
Pattern: Bullish Channel (Falling or Rising?) Breakout
(Most likely a falling channel, which is bullish when broken upward)
Current Price: ~₹1594
Breakout Status: ✅ Breakout done
Current Action: 🔁 Retest phase underway
All-Time High (ATH): ₹1,685 (approx as per recent charts)
📊 Technical Setup:
Aspect Details
🔓 Breakout Type Bullish channel (indicates trend reversal or continuation)
🔁 Retest Currently testing breakout zone (bullish if holds ~₹1580–1600)
🔥 Confirmation High volumes + bullish candle near ₹1600
📈 Next Resistance ₹1640 → ₹1685 (ATH)
🧨 Break Above ATH Blue sky breakout; target can go into uncharted territory
🎯 Target Zones After Momentum:
Phase Target
✅ Breakout Sustains ₹1640 (minor supply)
🔼 ATH Challenge ₹1685 (strong resistance)
🚀 Post ATH ₹1750 → ₹1800 (based on Fibonacci or channel projection)
🛡️ Risk Management (Invalidation Levels):
Retest below ₹1575–1560 with strong red candle and volume = ⚠️ weak setup
Better to keep a stop-loss below ₹1550 if swing trading
📅 Strategy Suggestion:
🧪 If you're planning an entry:
✅ Entry Zone: ₹1590–1600 (post confirmation of support)
🛑 Stop-loss: ₹1548 (safely below breakout zone)
🎯 Targets:
1st: ₹1640
2nd: ₹1685
3rd (if ATH breaks): ₹1750+
📌 Summary:
APL Apollo has shown a bullish channel breakout ✅
Retest in progress → if buyers defend ~₹1580–1600 zone with volume, uptrend may resume
Potential to break ATH of ₹1685 if momentum continues
Watch volume and Nifty Metal Index for broader confirmation
Disclaimer: The information provided is for educational and informational purposes only and should not be considered as financial advice. Investing in the stock market involves risk, and past performance is not indicative of future results. Please consult with a certified financial advisor or conduct your own research before making any investment decisions. We are not responsible for any losses incurred as a result of using this information. Stock market investments are subject to market risks; read all related documents carefully.
Overhyed Punishment This is what happens when everyone starts to fomo.
Lucky things, I sold some of my Altcoin with profit when BTC went into overbought band as in my chat.
BTC is bearish as long as below 117.6 to 118k :) . Good luck

Long-Term Technical Outlook: Critical Decision Point Approaching
The chart illustrates a long-term technical structure where the price has been following an ascending channel after a prolonged bearish trend. However, recent price action indicates a breakdown below the green ascending trendline, raising concerns about a potential shift in market sentiment.
Currently, the $117 level is acting as a pivotal support zone. A sustained breakdown below this level — and more critically, below the red lower trendline — would validate the bearish scenario. This could trigger a deeper correction phase, with downside targets aligned along the red projection path. Such a move may lead to significantly lower price levels in the medium to long term.
🔽 Bearish Scenario:
If the price fails to hold above $117 and breaks below the red trendline, this would confirm the start of a bearish leg. Based on historical structure and projected trajectories, this could result in a descent toward the $93 level initially, with the possibility of extending further downward depending on market conditions.
🔼 Bullish Scenario:
On the other hand, if the price manages to reclaim the green trendline and more importantly, stabilize above the $204 resistance zone, it would signal renewed bullish strength. Such a move would open the path toward higher highs, potentially re-entering the previous upward channel and continuing the macro uptrend.
🧭 The price structure is now approaching a decisive zone, where either a confirmation of bearish continuation or a bullish recovery will likely unfold. Both scenarios have been visually outlined — green lines indicating bullish continuation, and red lines representing bearish momentum.
📌 Note: This analysis is for educational purposes only and should not be interpreted as financial advice.

Nifty : Technical levels metAs shared last week the nifty support 24510 , 24850 levels were worked as support exactly.
Now we may see sideways market and range bounded moves.
Sharing fresh levels:
Support : 24460
Resistance: 24660, 24850

Cardano sellll shorts All markets have TB in August.
Cardano sellll short
Tp1:0.50
Tp2:0.44
Tp3:0.29
Tp4:0.16😄😄😄😄😄

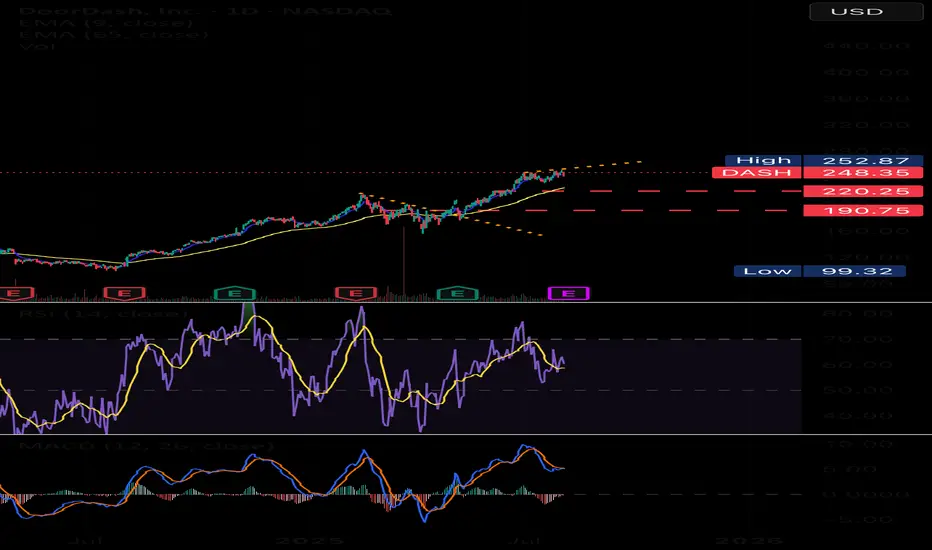
$DASH NASDAQ:DASH buyers look hesitant to buy right now after the weak job report and the Fed signaling no rate cuts anytime soon. This adds pressure on consumer pockets, limiting discretionary spending. If this trend continues, we might see DoorDash consumers slow down their activity, which could impact the company’s revenue growth.
With macro headwinds and reduced consumer demand, NASDAQ:DASH price action could remain under pressure in the short term. A break below key support levels may trigger further downside unless the market sentiment shifts with improved economic data.
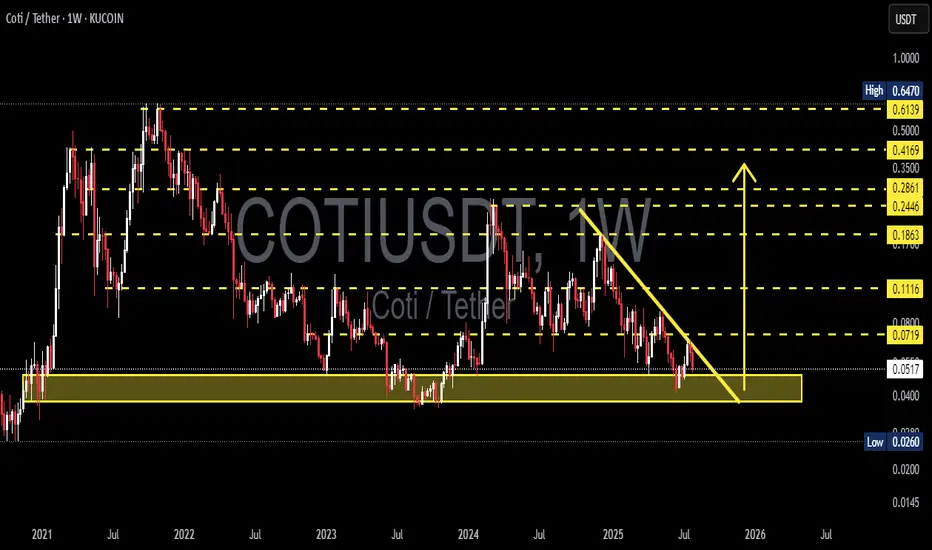
COTIUSDT Weekly Analysis Potential Reversal?📍 Current Price Position – On Top of Historical Support!
The COTI/USDT pair is currently testing a crucial support zone between $0.0400 – $0.0517, which has been a key demand zone since early 2021. This isn't just any support — it's a macro psychological area that has repeatedly triggered strong reversals in the past.
We are at a make-or-break level, where the next move could define the mid-term trend.
---
🧩 Price Structure and Pattern
📐 The chart shows a descending triangle pattern with:
Consistently lower highs (marked by the downward yellow trendline),
Flat horizontal base around the major support zone.
This pattern can result in:
A powerful breakout if the trendline is broken, or
A sharp breakdown if the horizontal support fails.
---
📈 Bullish Scenario: Reversal Momentum Building?
If price:
Breaks above the descending trendline (~$0.0719), and
Closes a weekly candle above that resistance zone,
➡️ We could see a breakout move with targets at:
Resistance Level Target
Initial Target $0.1116
Mid-Term Target $0.1863
Strong Zone $0.2446 – $0.2861
Long-Term Bullish $0.35 – $0.4169
📌 A confirmed higher high and higher low structure above $0.11 would strengthen the bullish case.
---
📉 Bearish Scenario: Breakdown from Support
If:
Price fails to hold the $0.0517 – $0.0400 support area,
and prints a weekly close below this zone,
➡️ The next bearish targets could be:
Support Level Target
First Support $0.0260
Psychological Level $0.0200
Extreme Panic Zone $0.0150 – $0.0100
⚠️ This would indicate a capitulation phase, likely to trigger panic selling and deeper lows.
---
🧠 Strategy Notes for Traders
✅ For Position Traders:
The $0.040 – $0.0517 area is a prime watch zone for reversal setups with tight stop-loss below $0.040.
Excellent Risk:Reward potential if reversal confirms.
✅ For Swing Traders:
Breakout above the trendline offers a solid entry signal.
Targets up to $0.1863 look achievable with strong volume.
✅ For Conservative Traders:
Wait for breakout + retest confirmation before entering.
Avoid FOMO — let the weekly candle close guide your decision.
---
⚡️ Final Takeaway
> COTI/USDT is at a tipping point!
This long-standing support is the last line of defense for the bulls. A breakout can trigger a macro trend reversal, while a breakdown will extend the downtrend and invite heavier selling pressure.
Watch for the weekly close, trendline reaction, and volume behavior — the next major move is likely just around the corner.
#COTI #COTIUSDT #CryptoAnalysis #AltcoinWatch #DescendingTriangle #BreakoutTrading #SupportAndResistance #PriceAction #ChartPattern #WeeklyAnalysis
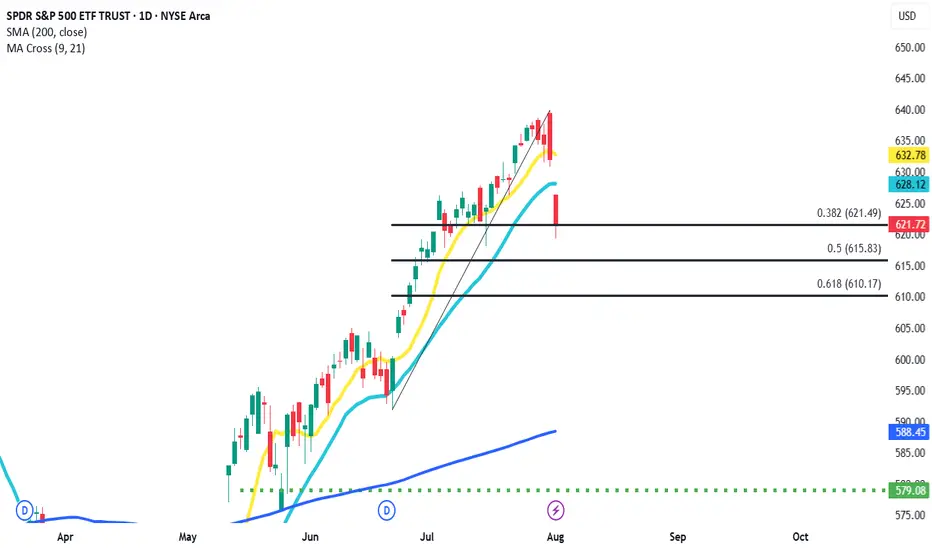
FIBO touch and goPretty violent last couple of days in July, but I honestly think it might be over for now. Price action couldn't break past .38 fibo retracement. If I'm right we could see continuation of uptrend in coming weeks.
EURAUD BULLISH MOVE CONTINUESOur analysis is based on a multi-timeframe top-down approach and fundamental analysis.
Based on our assessment, the price is expected to return to the monthly level.
DISCLAIMER: This analysis may change at any time without notice and is solely intended to assist traders in making independent investment decisions. Please note that this is a prediction, and I have no obligation to act on it, nor should you.
Please support our analysis with a boost or comment!

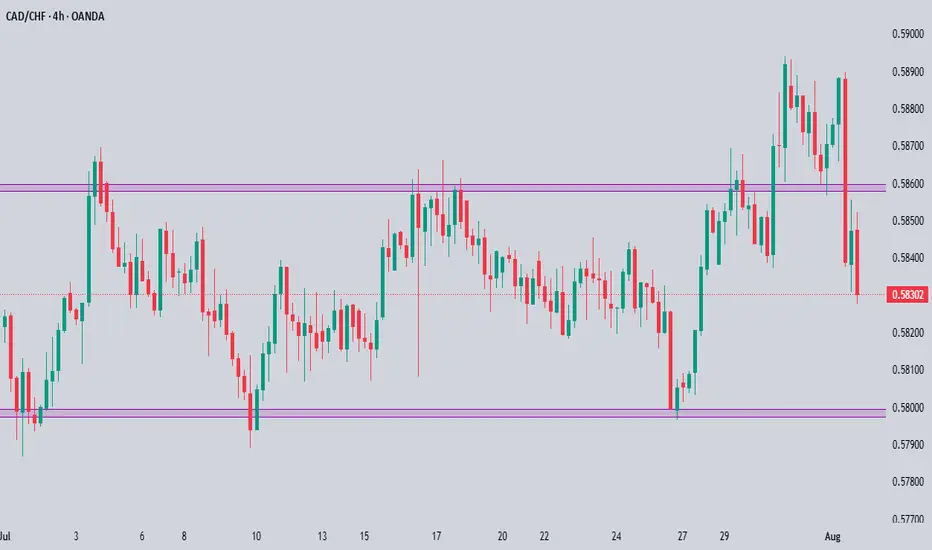
CADCHF Technical & Order Flow AnalysisOur analysis is based on a multi-timeframe top-down approach and fundamental analysis.
Based on our assessment, the price is expected to return to the monthly level.
DISCLAIMER: This analysis may change at any time without notice and is solely intended to assist traders in making independent investment decisions. Please note that this is a prediction, and I have no obligation to act on it, nor should you.
Please support our analysis with a boost or comment!
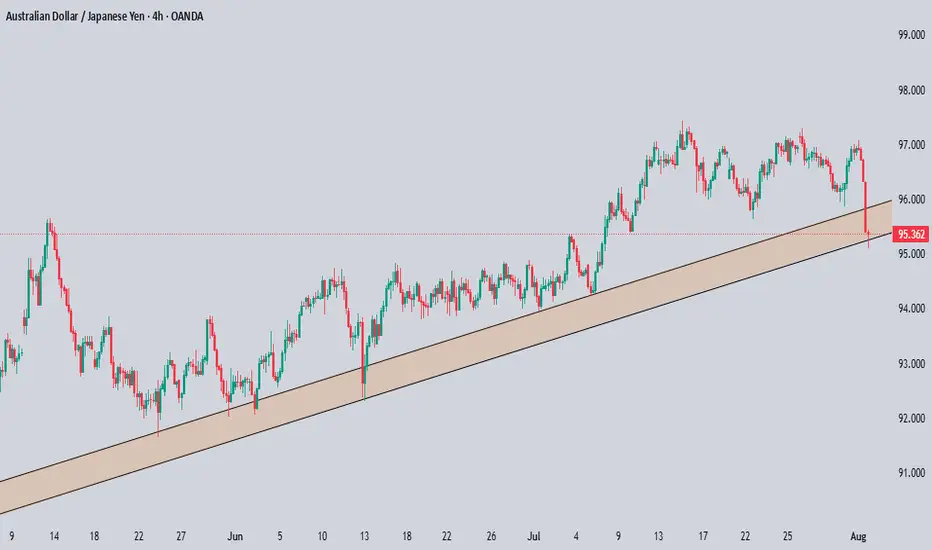
AUDJPY Technical & Order Flow AnalysisOur analysis is based on a multi-timeframe top-down approach and fundamental analysis.
Based on our assessment, the price is expected to return to the monthly level.
DISCLAIMER: This analysis may change at any time without notice and is solely intended to assist traders in making independent investment decisions. Please note that this is a prediction, and I have no obligation to act on it, nor should you.
Please support our analysis with a boost or comment!
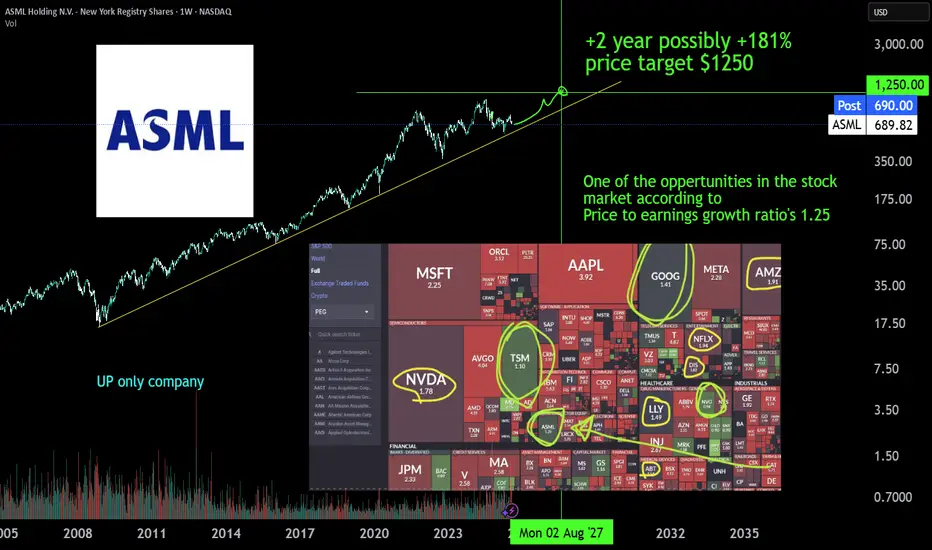
ASML monopolist, AI expanding +181% | 2Y oppertunity ASML is the monopoly Extreme ultra violet machinery company. There is no one close to it's technology or there is no one investing enough to R&D a thing like it. The whole AI datacenter and cloud chip growth depends on EUV machinery of ASML developed in 2013 (>10y of PhD level R&D deveopment). The first new High-NA EUV systems have been deployed at Intel in July 2025 for research purposes and will scale just like the EUV already does to keep pace with moore's law. TSMC has stated it will not yet depoly the machines but has to expand with to 10 year older tech EUV machines just to get the AI chip demand going. AI chip demand at NVIDIA is growing harder than expected comfirmed by latest earnigns of alphabet, microsoft, meta and amazon.
Also don't sleep on BESI a packing machinery wonder due to hydrid bonding technology, which makes 3D chip staking possible.
#GoHighTechNetherlands
Daily Orderflow on ES and NQ. 01.08.2025, NFP FridayCME_MINI:NQ1! CME_MINI:ES1!
Orderflow explanation. Sessional delivery and New York Price action

Reversal from Channel Bottom or a Real Breakdown? Identifying th
🎯 BTCUSDT - Analysis
🔹 Analysis Date: 1 August 2025
📉BTCUSDT:
Price is currently moving inside an ascending channel and has touched the bottom of the channel again, offering a potential buy opportunity.
However, for those seeking a low-risk entry, the zone around 118,000 could be ideal—if price returns to the channel and confirms support.
Although it seems the channel’s lower boundary might break, this could be a fake break to mislead traders before a rebound.
The support at 110,000 is a crucial short-term level; if it fails, a deeper correction toward 98,090 or even 94,000 is likely.
Our targets remain at the upper boundary of the channel.
⚠️ Risk Management Tip: Wait for confirmation near 118,000 if unsure, and always size positions based on overall volatility.

xauusd sellsell xauusd
XAUUSD
idea order block active with high volume here
and it back to test it
OANDA:XAUUSD

BTC CLS RANGEWaiting for the daily candle to close inside of the range as seen on the graph with the horizontal line.
Then I will be immediatly looking for an entry, either a FVG or a OB or an IFVG. (I will update the entry points asap)
Then I will target 50% of the range as seen on the graph market 0 .5 on the fibonacci retracement where I will take 75% of the position.
Then I will set my SL at my entry price and target the opposing range or LQ which is at 119500-120000K
