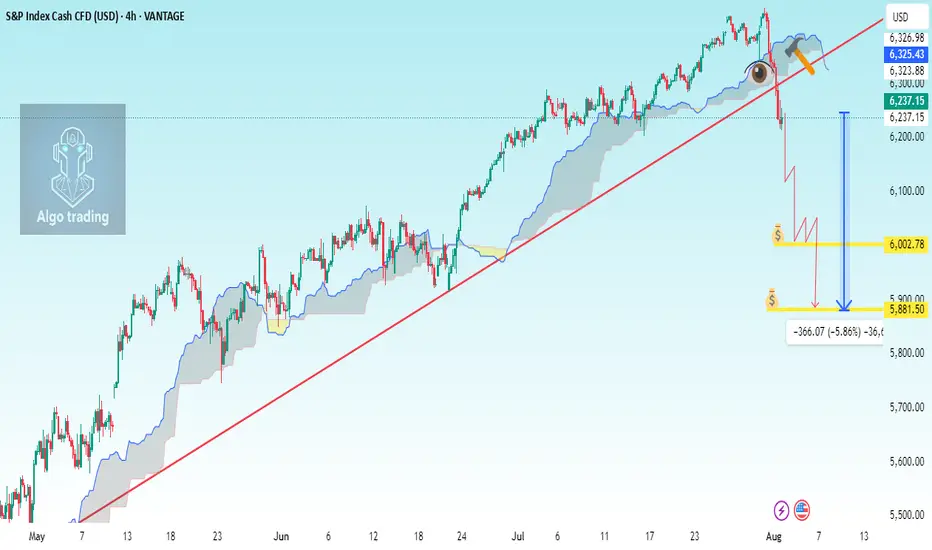
SP500 H4 analysis Breakdown TrendlineChart Components Observed:
Ichimoku Cloud: For trend and support/resistance visualization.
Uptrend line (manually drawn): Connecting higher lows since early May 2025.
Support break: Price has recently broken below the trendline and below the Ichimoku cloud.
Current Price: 6,237.15 (▼ -1.64%)
---
📉 Analysis Summary:
The trendline and Ichimoku cloud were acting as major dynamic support.
A bearish breakdown has occurred — price closed below the trendline and the cloud.
This suggests a potential trend reversal or correction underway.
---
🎯 Trade Setup Suggestion (Short Entry)
🟢 Entry Target (Short Position):
Sell Entry: Around 6,237 – 6,245 (current zone or slight pullback)
If price retests the underside of the broken trendline/cloud, that's a better entry confirmation.
📉 Take Profit Levels:
1. TP1: 6,130 (recent consolidation zone)
2. TP2: 6,000 (psychological + historical support)
3. TP3: 5,880 (next major support based on previous consolidation in early June)
🛡 Stop Loss:
SL: 6,300 – 6,310 (above the cloud and broken trendline for safe buffer)
---
📊 Risk Management:
Position size should be based on your account size, using 1–2% risk per trade.
Watch the S&P futures and macro news (e.g., U.S. data, Fed news) to avoid whipsaw.
Harmonicpattren
BTC Double BottomFibonacci sequence is a mathematical concept; it appears in various aspects of everyday life and nature. It's not directly used in a calculated way, but its principles are reflected in the patterns we see around us. Its key for traders to pinpoint these reversal areas to keep a positive risk/reward ratio. Bulls will target 116k if this low can be sustained.

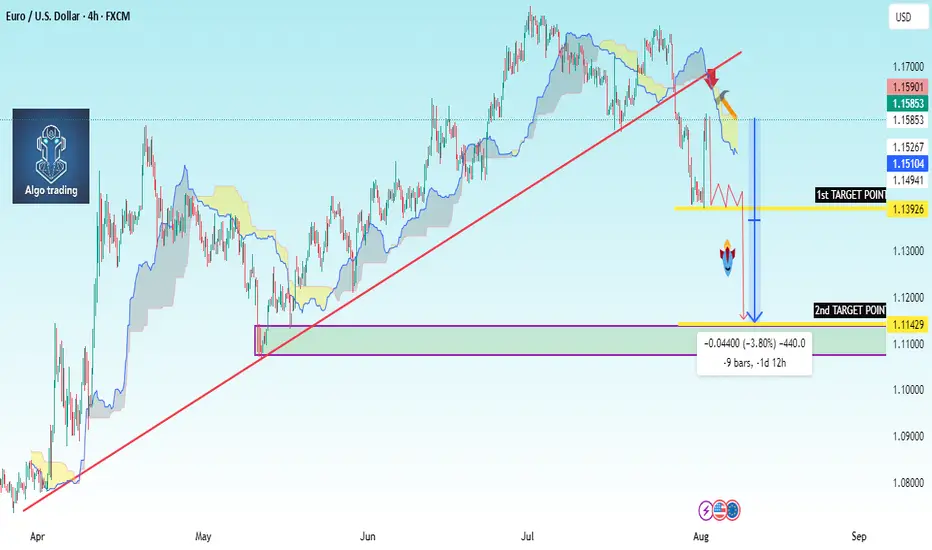
EUR/USD Chart Summary (Bearish Setup):Trendline Break: A long-term bullish trendline has been broken.
Price below Ichimoku Cloud: Indicates bearish momentum.
Bearish Retest: Price pulled back to retest the broken trendline and is now forming a bearish continuation pattern.
Double Target Zones Identified:
1st Target Point: ~1.1329
2nd Target Point: ~1.1144
---
🟠 Suggested Trade Setup:
🔹 Entry (Sell):
Around 1.1585 (where price is hovering now; or on a small pullback).
🔻 Take Profit (TP):
🎯 TP1: 1.1329 (short-term target)
🎯 TP2: 1.1144 (main target if bearish momentum continues)
🛑 Stop Loss (SL):
Place above the recent swing high or cloud resistance — around 1.1670
---
📊 Risk-Reward:
TP1 = ~250 pips
TP2 = ~440 pips
SL = ~85 pips
This gives you a favorable risk-reward (1:3+ to TP
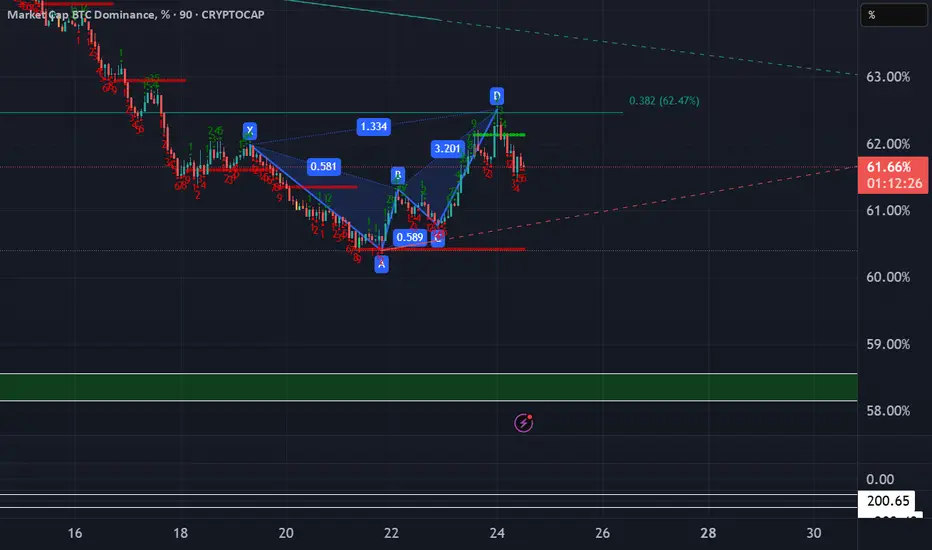
BTC Dominance continues downward Despite the recent aggressive fall in BTC Dominance, we still see a path down towards 58%. This ratio, which is determined by dividing the total value of the cryptocurrency market by the market value of Bitcoin, can help us understand where the market will go.
TITAN ' s Key Point | Breakout | Swing.This is the 4 hour Chart of the TITAN COMPANY.
Titan has formed a Cup and Handle pattern and given a breakout .
Two possible scenarios:
If the breakout sustains with volume, the rally may continue.
If it retests the breakout level, it would offer a safer entry before the next leg up.
If this level is sustain then we may see higher prices in Titan.

Volume Spread Analysis - Understanding Traps & ConfirmationDespite the fact that the so-called “Big Players” in the game of ups and downs we call the market have the power to manipulate it in ways some cannot even imagine, what they ultimately seek is a healthy market. I’ve mentioned in previous posts that the market behaves like a living organism — and like any organism, it must be healthy in order to grow.
In simple terms, the traps institutional players set are there because they need cash flow — liquidity — to achieve that growth. But why do they need to use traps at all? The answer lies in the numbers: one institutional player is equivalent to hundreds, if not thousands, of uninformed or poorly trained retail traders. So, to sustain growth, they are not just inclined but sometimes forced to create traps.
Now imagine this: in a market with enormous capital, one big player is equivalent to 100 retail traders. If 25% of those traders were skilled — truly good at the game — think of how much more cash flow would occur, and how much healthier and more stable that growth could be.
But don’t be fooled — while big players may benefit from a small portion of skilled retail participants, it’s not their actual goal. Still, it wouldn't hurt them either, as long as liquidity and volatility are preserved. In fact, a higher percentage of skilled players could deepen liquidity and reduce the need for extreme manipulation.
However, if too many retail traders become skilled, the game tightens. Profit margins shrink. The edge that institutions hold becomes harder to maintain. And in such a scenario, consistent profitability becomes more difficult — for everyone.
As I’ve emphasized in previous ideas, there is a way to understand institutional traps — and one of the keys is learning how to interpret the Relative Strength Index (RSI) properly. However, since RSI is by nature an oscillator, its signals require confirmation. And what better tool to use for confirmation than Volume — specifically through the lens of Volume Spread Analysis (VSA)?
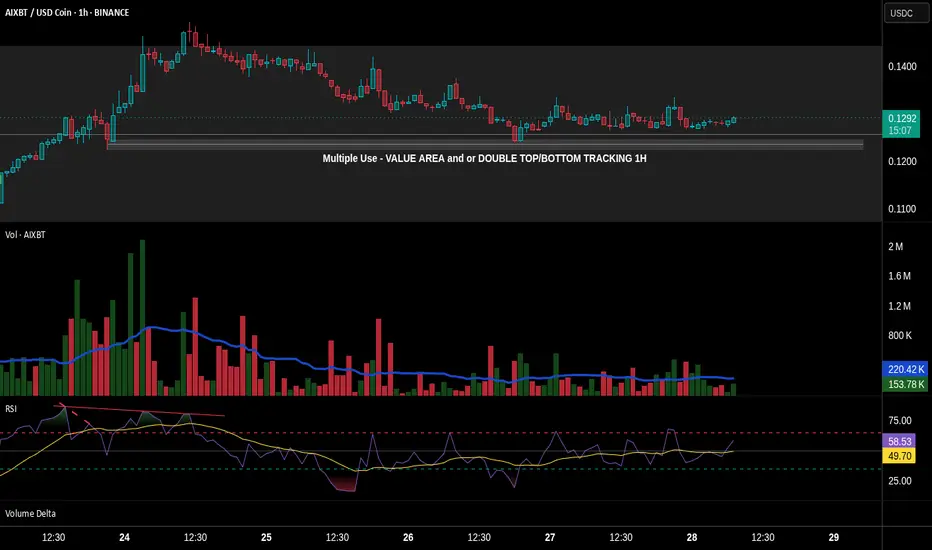
In this post, we’ll partially explore how these traps are revealed, using basic tools available on TradingView. We'll also uncover a potential trap in the chart of AIXBT/USD Coin from Binance, using the 1-hour time-frame.
🔹 1. Pre-Top Volume Cluster
Let’s begin at the very top of the chart. Just before this top, we can spot a bullish volume cluster — four consecutive volume spikes with rising price. In VSA, such a cluster often suggests that the current trend is reaching exhaustion.
⚠️ Important Note: Not all clusters mark a reversal. Even if we see one or two bearish candlesticks after-ward — even if they are engulfing — that alone does not confirm the reversal. The real signs are already present in the volume indicator.
As I’ve said in the past, in previously posted ideas: Big Players always leave footprints. Learning to read those footprints is the language every serious retail trader must eventually understand. And one of the clearest footprints is what we’ll discuss next.
🔻 2. The Buying Climax
A Buying Climax is a tell-tale sign of professional distribution — it appears (in our case) as a large bullish volume spike accompanied by a bearish candlestick, signaling the potential end of a rally.
In our AIXBT/USD Coin chart, we observe two buying climaxes:
• The first comes at the end of the bullish volume cluster, followed by a bearish candle.
• The second follows right after, repeating the same bearish confirmation.
🧠 Even though price was making a new Higher High — these repeated climaxes on increasing volume suggest supply is entering the market, and the uptrend is likely unsustainable.
✅ Conclusion
This is just one piece of the larger puzzle, but even basic tools like RSI and Volume, when read in the context of structure and intent, can reveal traps set by institutional hands. The more we train ourselves to see these signs, the closer we get to trading in harmony with the market’s true rhythm — not against it.
Now let’s take a look at another signal that hints at a possible reversal. But before we continue, keep in mind: what I’m about to describe doesn’t always play out in the simplified way I’ll mention here. The market behaves differently at any given moment — so this kind of analysis always requires a careful and adaptive approach.
This time, I’m referring to a smaller bearish cluster, made up of three volume spikes, each of them clearly above the 20-period Moving Average — and appearing just before the bullish cluster I highlighted earlier.
• The fact that the first spike in this bearish group breaks above the MA is a strong signal that bearish pressure is stepping in.
• The fact that all three spikes remain above the MA adds weight to that signal.
However — and this is crucial — just like I mentioned before, this alone doesn't confirm a reversal. It still requires confirmation.
Even though this smaller bearish cluster forms a new low, and even though it aligns with a bearish RSI divergence marked with a dashed trend line, it’s not a signal to enter a trade. Why? Because volume confirmation is missing. And that's exactly why RSI alone isn't enough. It can point to weakness — but not confirm the turn.
True confirmation only comes with the next bullish volume spike, which:
• a) breaks above the MA,
• b) is higher than the first bearish spike in the previous cluster,
• c) appears with an engulfing candlestick, and
• d) is supported by an RSI plot that follows the move.
This collective behavior — the interaction between price, volume, and momentum — is not random. It’s one of the many harmonies that exist in the market’s structure. And learning to recognize these harmonies is key to understanding when the market is genuine — and when it's trying to trap you.
🔚 Conclusion
All of this leads me to one conclusion — based not just on theory, but on direct experience.
We’ve all seen the countless videos across platforms where retail traders explain things like RSI divergences as if they’re guaranteed signals. But the truth is: not all of these videos are made by successful traders — and blindly following them can be dangerous.
Early in my trading journey, I made that exact mistake. I followed those “educational” videos without question, and nearly blew my account in the process.
Can you imagine what would happen if someone entered a trade solely based on the divergence we discussed — without waiting for confirmation?
If you’ve followed this chart example to its end, you already know the answer.
Worse, this kind of psychological frustration often leads to even bigger mistakes — especially if you haven’t applied one of the simplest protective tools: the Stop Loss. And sadly, many traders skip it.
So let this be a reminder:
A divergence is not a signal. Confirmation is everything.
Let’s now take things a step deeper — by partially revealing something that remains known only to a small circle of elite traders.
Something that’s rarely discussed in public — yet sits hidden in plain sight.
Many traders know that Volume Spread Analysis (VSA) is based on the teachings of Richard Wyckoff and expanded through Tom Williams in Master the Markets. And yes — the most of VSA’s power comes from those principles.
But that’s only part of the story. What did these two big names revealing in secret code using multiple paragraphs and terminologies, but purposely do not reveal it in simple words in a few lines. And they are doing the right thing. Because if I said to myself that if everyone knew that then the market might crashed, then for sure they had that thought as well
What truly sets VSA apart, and what gives it its real power, is that it operates in two distinct languages.
🧩 The Hidden Language of VSA — What Most Don’t See
Let’s now go a step deeper — by partially revealing something known only to a few traders who’ve spent enough time observing the market beyond surface-level signals.
Something that’s often overlooked, yet has always been in plain sight.
We all know that VSA stands for Volume Spread Analysis.
And we commonly refer to “spread” as the distance between the open and the close of a candlestick. This is what many traders fixate on — the relationship between price movement and volume.
But that’s only part of the story.
What did names like Wyckoff and Tom Williams really reveal?
They spoke in code — long paragraphs, obscure terminology, layered ideas — never quite saying "this is the hidden key" in a few plain words.
And they were right to do so.
Because I’ve thought the same thing myself:
If everyone knew this… if it was simplified and passed around like a hack… the market could collapse into chaos.
If I’ve had that thought, I’m certain they did too.
So instead, they left trails. Patterns. Puzzles.
They left the second language in the open — but made sure only those with patience, discipline, and time in the charts would ever truly hear it.
There are things the open and close can’t tell you, but...
That… is part of what I meant earlier when I said VSA speaks in two languages.
Some of you already sense what I’m pointing toward.
For the rest — keep watching.
You’ll know it when you see it.
And once you do, you’ll never unsee it again.
Let’s begin with what most traders already know.
We say "spread" in VSA to refer to the range between the open and the close of a candlestick. This spread, in relation to volume, tells us whether a candle shows strength or weakness.
• A wide spread on high volume may signal professional activity.
• A narrow spread on high volume could suggest absorption or hidden effort.
This is the first language — the most commonly taught, and the most widely shared.
But what about the second?
Here's where things get interesting.
Let’s revisit our AIXBT/USD Coin chart, and specifically the large engulfing candlestick that forms around 18:30, just after the very top.
Now ask yourself:
• 🔍 Where did this candle open?
• 📍 What previous zone did it revisit or retest? What’s the story behind on that retest?
• Have you noticed the macro scale Hidden bearish divergence between RSI & PA?
What you're seeing is not just a rejection.
It’s a trigger zone — a price level left behind earlier by institutional activity.
This candle, with its precise open, combined with the volume behavior, is no coincidence. It's not just a rejection — it's a setup, part of a pre-engineered trap. By stealing what Tom Williams said: Big players are simply saying to uninformed traders – “thank you for your money”.
The interaction of price levels over time, the zones formed by previous activity, and how volume behavior aligns with those zones to signal intent.
Most traders never see this and even fewer can interpret it.
Why This Matters
That engulfing candlestick is not just a visual cue — it's a multiple level footprint.
It confirms everything we discussed earlier about how the market is manipulated — often in ways most traders can’t even begin to imagine. Two opposite forces within a zone. One prevails while the other reveals a future!
So now, let this sink in:
To truly master VSA, one must learn to read both languages.
The visible structure, and the hidden context.
One without the other is incomplete.
Now you know why Confirmation is so crucial.
That’s all for now. I hope that all the above paragraphs were able to give you a hint of how things work! And remember: Everything I write is just a small glimpse of the whole that needs to be considered.
Until next time — stay safe, trade wisely, and never stop learning.
Strong Stock!FFL
Closed at 15.22 (27-06-2025)
Sustaining 13.81 on Monthly basis
would be a healthy sign.
Also Monthly Closing above 16.12
would be a very positive sign.
On the flip side, 12 - 14 may act
as a Good Support zone.
Upside targets can be 19 - 20
& then 22 - 23 initially.

Beautiful ABCD pattern appearing on bigger tf.Beautiful ABCD pattern appearing on
bigger tf.
Crossing 101 - 102 with Good Volumes may
trigger new highs towards 120 atleast.
78 - 80 is an Immediate Resistance area.
On the flip side, a Very Strong Support is
around 68 - 70 & then around 62 - 63

BITCOIN SHORT TERM UPDATE!!! Recently we have seen a great price move from 100K to 110K. We got clear Change Of Character , which indicates a sign of strength. Also we got bearish cypher harmonic pattern formed. So now we can expect a slight pullback up to 106-103k region from there we may see price reversing. But price should hold 100.3K region to remain bullish in short term.

SBI towards 650? Butterfly pattern to complete "W"SBI is on the verge to form Butterfly pattern it has potential to reach 650 target with following support.
720 / 700 / 680 / 650

BITCOIN - Bullish Ahead !!!!Bitcoin is in bullish trend making series of HH and HL, Market is making perfect AB=CD pattern and therefore we can project our TP at "D" point which could be a potential reversal zone.
Entry at Breakout of "B" and SL below HL.

EURUSD - AB=CD harmonic Pattern | BULLISH TREND continuationThis analysis is done on 4H time frame, as it can be seen that market is making series of HH and HL which is our Bullish Trend. however, market took a deep correction and broke the HL which seems trend reversal. Since there is no divergence before correction therefore it is more weighted toward continuation pattern. Having said that, Market took a deep correction till FIB level of 0.618 which forms a AB=CD Harmonic Pattern.
The point D is our Potential Reverse Zone, and it also coincides with the 4H good resistance level (Perfect confluence of PRZ). Therefore we can project our market to reach there.
Entry Points : IN our case we shall plan safe entry on Break-of-Neckline, however the neckline is already broken, therefore we can instant enter into the market OR wait to break again the Market with Good Bullish candle (with good momentum / body).
Our 1st TP will be with R:R of 1:1 and 2nd TP would be 1:2 R:R , As usual SL would be placed below HL as market in the chart.
Regards,

INFY 1H Chart Analysis (Bullish Bat + Falling Wedge)NSE:INFY
INFY 1H Chart Analysis (Bullish Bat + Falling Wedge)
In this 1-hour chart of Infosys Ltd (NSE: INFY), a Bullish Bat Harmonic Pattern has completed at point D, suggesting a potential reversal zone. Additionally, a falling wedge formation adds to the bullish confluence.
1. Pattern Structure:
The chart displays a complete Bullish Bat Pattern (X-A-B-C-D).
Point D aligns with the PRZ (Potential Reversal Zone), with a CD leg extending \~1.618 of BC, supporting a bullish reversal.
2. Falling Wedge Pattern;
A falling wedge, generally a bullish pattern, has formed from point C to D.
A breakout above the wedge trendline may confirm a bullish move.
3. Price Action:
The price is testing the upper boundary of the wedge.
Buying interest is visible at the P,R,Z near ₹1,540–₹1,545.
Trade Plan:
Buy Entry: Above ₹1,555 (confirmation breakout above wedge)
Stop Loss: Below ₹1,538 (beneath point D and wedge support)
Target 1: ₹1,568 (previous resistance)
Target 2: ₹1,611 (mid-term resistance)
Target 3: ₹1,631 (major swing high)
A strong bullish confluence exists with the harmonic pattern and falling wedge. Wait for confirmation above ₹1,555 before entering. Maintain proper risk-reward with a stop below ₹1,538.
NSE:INFY NSE:NIFTY NSE:CNXIT

2 Bullish Patterns under Construction ;-)APL Analysis
Closed at 460.36 (29-05-2025)
2 Bullish Patterns under Construction ;-)
Imemdiate Resistance is around 468 - 470
which needs to Cross & Sustain on Weekly basis.
It may then easily touch 550.
On the flip side, 441 - 445 may act as a Good Support.
& breaking 440 will bring more selling pressure towards
410 - 415.

Gartley harmonic pattern EURUSD DOWNThe D point marks the completion of the Gartley pattern and is typically a potential reversal zone (PRZ).
Given the strong bullish move to the D point, the pattern suggests that the upward trend may soon reverse, leading to a bearish move.
Stay Green :)

Though Bullish but..
Though Bullish but Bearish Divergence has appeared
on bigger TF.
ABCD Pattern intac but only if 155 is Crossed & Sustained
with Good Volumes.
Upside Targets can be 200+
Good Support levels are 136 - 138 and then around 123 - 125

BTC Forecast The Shark Harmonic pattern has clearly formed on the daily chart of BYBIT:BTCUSDT and could lead to some corrections.


XAIUSDT — profit protection, risk management, area of interestXai (XAI) - is a cryptocurrency designed to revolutionize the gaming industry by enabling real economies and open trade within video games. Developed by Offchain Labs, Xai operates on the Arbitrum platform, a layer-2 scaling solution for Ethereum, which enhances its efficiency and scalability.
One of the standout features of Xai is its integration of Explainable AI techniques. These techniques make automated trading bot systems more transparent and trustworthy, addressing a significant concern in the cryptocurrency space. This transparency is crucial for fostering trust among users, particularly in the context of in-game economies where players trade valuable items.
📍 CoinMarketCap: #373
📍 Twitter(X): 308.5K
___________________________________________
🛡️ Risk Management and Approach:
When trading low-liquidity coins , I allocate a specific portion of my portfolio in advance for such trades.
These funds are split across different projects , which allows for diversification and helps mitigate potential scams .
If one coin pair dies — it's not critical , as long as the portfolio is structured properly.
📉 Current Situation:
On the broader view, the price is moving within a large descending channel .
Right now, it's near the outer support of the inner channel.
Since I’ve already allocated funds for this coin, I’ve taken a small entry near the support of the inner channel , and I plan to add more in the lower marked zone .
There’s a high probability of price chop due to news (tariffs, rates, debt ceiling, refinancing), and I take that into account.
💭 General Thoughts:
Diversification is key. You can never rule out the possibility that any project might end up as a scam. But with proper portfolio structure, that’s not a major issue .
There’s nothing to fear if you have a clear plan and tactics for different scenarios.
Like many other coins right now, I see the current accumulation zones as solid .
🔁 Additional Observation:
The recent mass delistings on Binance mainly target projects listed during the 2021–2022 distribution phase.
There’s a chance the exchange is cleaning up future risks , while “fresh” coins listed under the new conditions may stay longer.
📌 This post is not financial advice. It reflects my observations, actions, and logic in managing the position.

AUDNZD Bullish Trade Breakdown — 9.99R Return Using Harmonics +
Hello traders!
If you enjoyed my previous post on the XAUUSD buy setup, then you're going to love this breakdown on AUDNZD—especially if you're interested in combining Harmonic Patterns with Smart Money Concepts (SMC) for precise trade entries. If you haven’t seen the Gold analysis yet, be sure to check it out below this post.
Let’s dive into this AUDNZD trade:
🔹 Weekly Analysis
On the weekly timeframe, price was reacting strongly to a key support level, which was confirmed by a long rejection wick:
🔹 Harmonic Pattern Setup
I anticipated a retracement toward the 0.786/0.886 Fibonacci levels of the previous bullish impulsive move, with the expectation of forming a Bullish Harmonic Pattern. And that’s exactly how it played out:
🔹 Pattern: Bullish Gartley
The setup was a classic Bullish Gartley, with the PRZ (Potential Reversal Zone) aligning perfectly with the 0.786 level. Price tested this area and confirmed the setup:
🔹 Entry Strategy: SMC x Harmonics
Entry Model: S2D (Supply-to-Demand) Flip Entry
Confirmation: After a CHOCH (Change of Character) on the M15 timeframe
H1 Sniper Entry: Not tagged, but our setup remained valid
Stop Loss: A tight 15 pips, limiting potential loss if the market didn’t respect the analysis
🔹 Trade Outcome
The entry was triggered successfully, and the trade hit:
✅ TP1
✅ TP2
✅ TP3 (at the 0.786 retracement level)
📊 Result: +9.99R
That’s nearly 10R return on a single trade—an excellent example of how combining Harmonic Patterns with SMC execution models can yield high-probability setups and strong returns.
💬 What About You?
Did you catch this move on AUDNZD, or perhaps take a different approach?
Let me know in the comments below—I’d love to hear how you approached it.
And don’t forget to stay tuned for more in-depth trade breakdowns like this, where I blend Harmonics + SMC to find precision entries.
Thanks for reading, and happy trading! 🚀

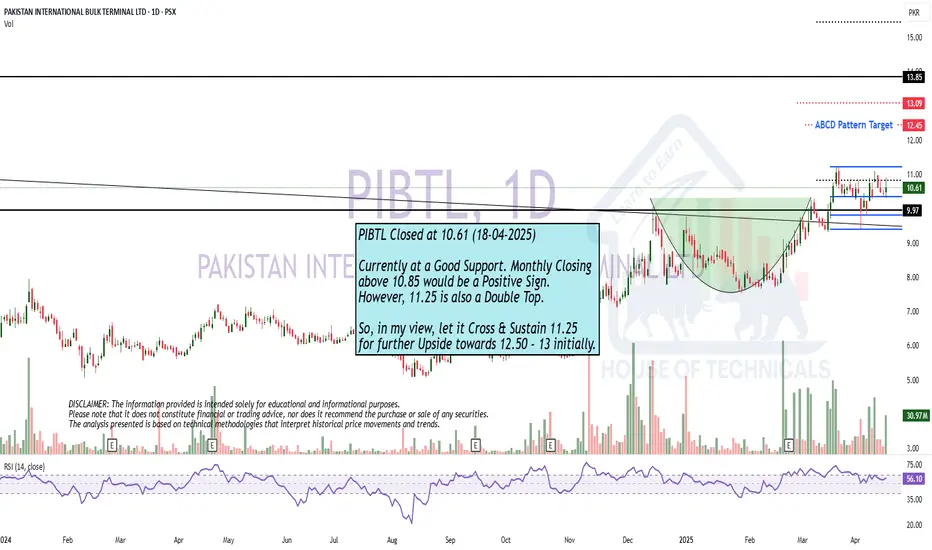
Monthly Closing MattersCurrently at a Good Support. Monthly Closing
above 10.85 would be a Positive Sign.
However, 11.25 is also a Double Top.
So, in my view, let it Cross & Sustain 11.25
for further Upside towards 12.50 - 13 initially.
BTC Bearish GarleySummary of Confluences
Trade Setup Long Trade (Buy at C)
Key Confluences
✅ Fibonacci 0.618 - 0.633 Retracement (XA Leg)
✅ Weekly FVG Support
✅ Market Structure Pivot & Liquidity Grab
Short Trade (Sell at D)
✅ Bearish Gartley Completion (1.27 - 1.3 Fib Extension of BC)
✅ Anchored VWAP from ATH (Resistance)
✅ Bearish Order Block & Supply Zone
1. Long Trade Setup (From C to D – Bullish Move within the Gartley)
🔹 Trade Type: Counter-trend long (buy from C to D).
📌 Entry Criteria:
Buy at Point C (~0.633 Fib retracement of XA leg).
Stop Loss: Below A (~1 ATR buffer).
Take Profit Levels:
TP1: B (~0.642 Fib level of XA retracement).
TP2: D (~1.3 Fib extension of BC leg).
🔹 3 Confluences for the Long Trade:
✔ Fibonacci & Harmonic Confluence:
Point C aligns with the 0.618 - 0.633 Fibonacci retracement of XA.
This is a well-known harmonic reversal zone, increasing the probability of a bounce.
✔ Weekly Fair Value Gap (FVG) Support:
Price is filling a weekly FVG, a strong liquidity zone where buyers tend to step in.
Institutions may use this level for long entries.
✔ Market Structure Pivot & Previous Low Rejection:
The chart shows a first weekly lower low in a Market Structure Break (MSB).
Previous liquidity grab suggests a potential bullish reversal from this level.
2. Short Trade Setup (From D – Bearish Reversal at Gartley Completion)
🔹 Trade Type: Trend-following short (sell from D after pattern completion).
📌 Entry Criteria:
Sell at Point D (~1.27 - 1.3 Fib extension of BC leg).
Stop Loss: Above D (~1 ATR buffer).
Take Profit Levels:
TP1: B (~0.642 Fib level of XA retracement).
TP2: C (full pattern retracement).
🔹 3 Confluences for the Short Trade:
✔ Bearish Gartley Completion & Fibonacci Reversal Zone:
The Bearish Gartley pattern completes at D, a major reversal point.
The 1.27 - 1.3 Fib extension of BC historically acts as strong resistance in harmonic patterns.
✔ Anchored VWAP from All-Time High (ATH) as Resistance:
VWAP from ATH is acting as dynamic resistance, confirming institutional selling.
If price rejects off VWAP, this increases the probability of a downtrend continuation.
✔ Bearish Order Block & Supply Zone:
Point D aligns with a key Bearish Order Block (OB) where previous heavy selling occurred.
Historical supply zone suggests potential aggressive selling pressure upon reaching D.
