AUD/JPY – Bearish Move Within Bullish Bat StructureAUD/JPY is developing a Bullish Bat harmonic pattern on the 4-hour chart . While the full pattern has not yet completed, a potential short-term bearish opportunity is emerging as the pair begins forming the CD leg.
A clear b earish divergence on the RSI at Point A suggests waning bullish momentum, and a break below Point B may confirm the start of the final leg down toward Point D , completing the harmonic structure.
Trade Setup
Sell Stop Entry: 96.009 (break of Point B – confirms CD leg underway)
Stop Loss: 96.978 (above Point C – invalidates CD leg projection)
Take Profit 1: 95.040 (1:1 risk-to-reward level)
Harmonicsignals
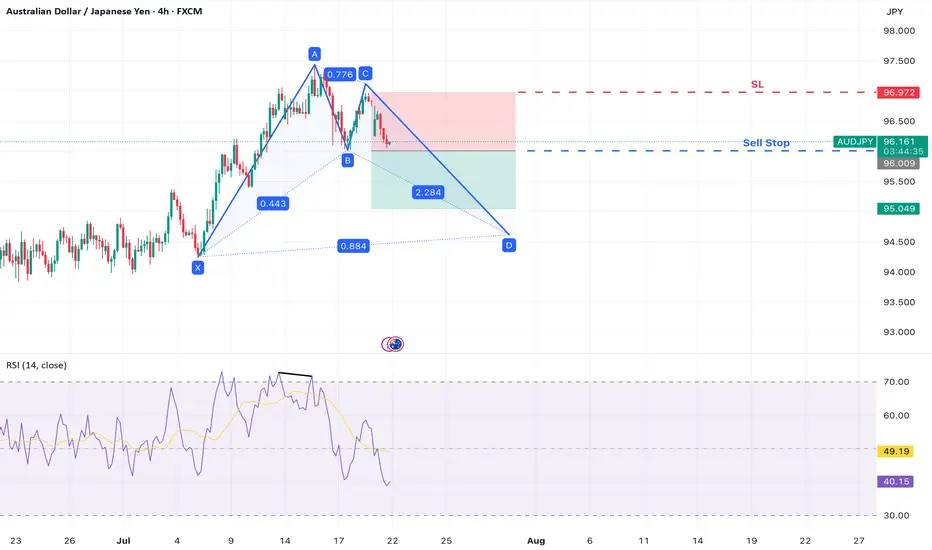
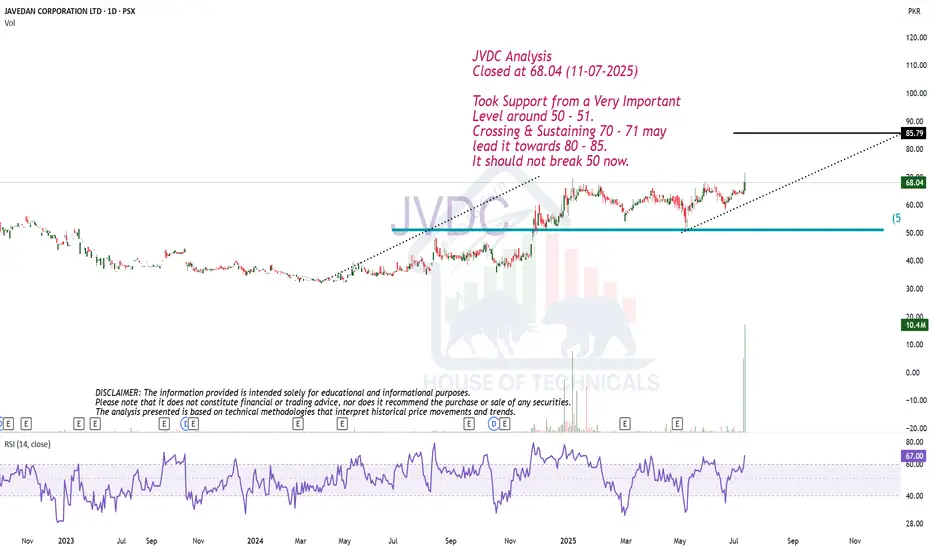
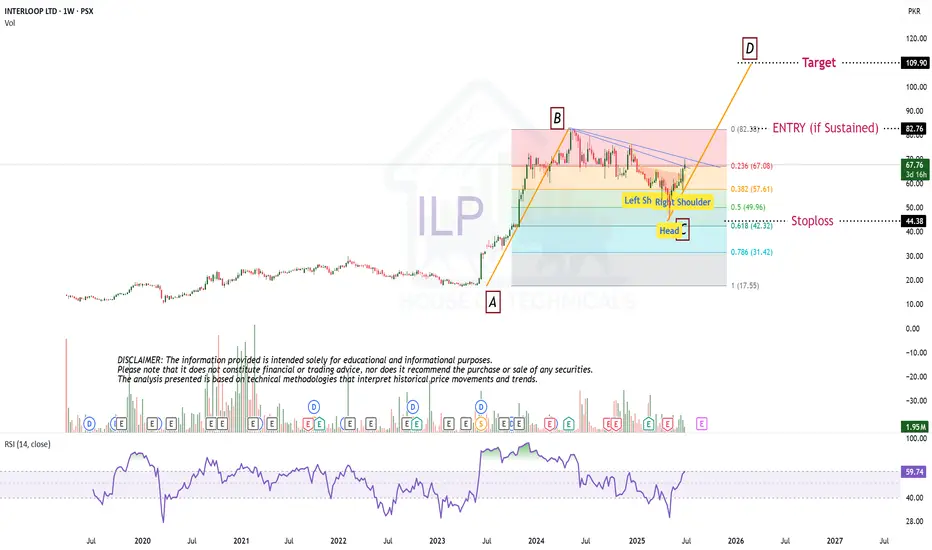
ABCD Possible.JVDC Analysis
Closed at 68.04 (11-07-2025)
Took Support from a Very Important
Level around 50 - 51.
Crossing & Sustaining 70 - 71 may
lead it towards 80 - 85.
It should not break 50 now.
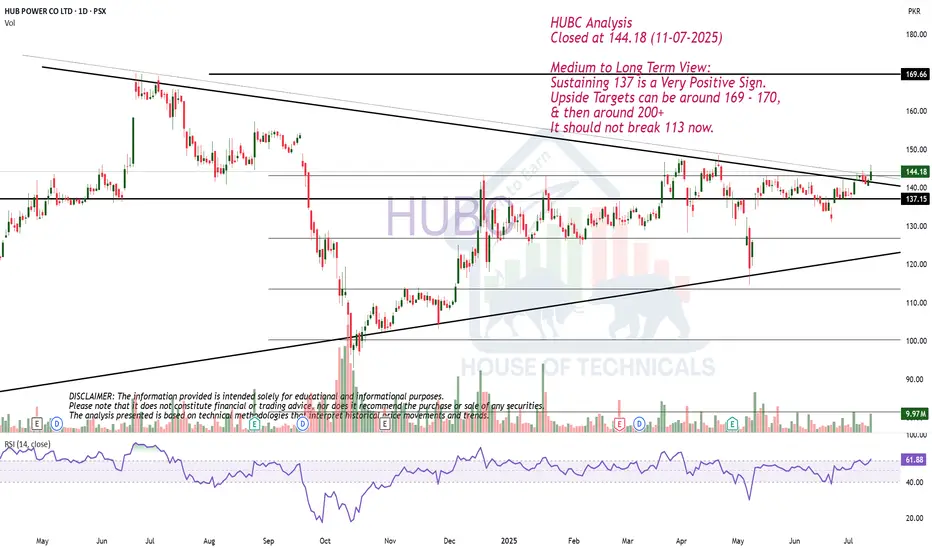
Medium to Long Term View.HUBC Analysis
Closed at 144.18 (11-07-2025)
Medium to Long Term View:
Sustaining 137 is a Very Positive Sign.
Upside Targets can be around 169 - 170,
& then around 200+
It should not break 113 now.
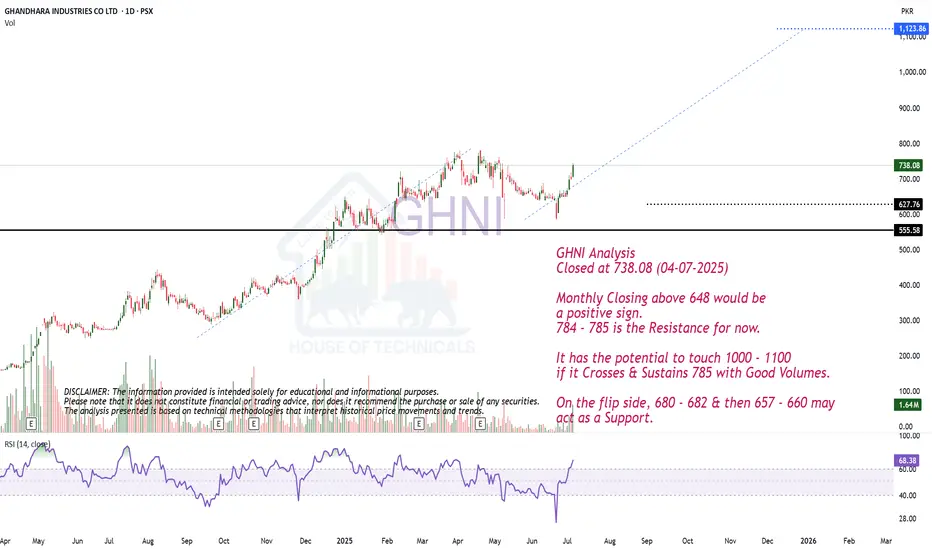
ABCD PatternGHNI Analysis
Closed at 738.08 (04-07-2025)
Monthly Closing above 648 would be
a positive sign.
784 - 785 is the Resistance for now.
It has the potential to touch 1000 - 1100
if it Crosses & Sustains 785 with Good Volumes.
On the flip side, 680 - 682 & then 657 - 660 may
act as a Support.
SP500 - Cycle Analysis; New V-Bottom24 Dec 2018 - V-Bottom Trough:
This marks a clean V-bottom. Both the 227-ROC and 114-ROC showed simultaneous positive acceleration after price reacing its low. Shortly after, both crossed their 57-SMA almost in sync — increasing the probability of a sustained bullish move. Price confirmed this by breaking resistance and forming a V pattern. This was further validated by the centered moving average crossover (114-CMA crossing above 227-CMA).
25 Mar 2020 - Deep COVID Crash Trough:
During this phase the priced broke below the support, creating a deep trough. Altough both ROC lines initially showed strong negative acceleration due to the COVID-19 crash, they soon reversed above their 57-SMAs, signaling a major shift in momentum. This coincided with the price breaking above the key resistance which was also crossed in 2019 when confirming the old V-pattern. After this breakout, a brief pullback followed before the uptrend resumed with increasing strength.
22 Jun 2021 to 19 Dec 2023 - Pattern
During the initial period a bearish divergence was visible in the ROC, nevertheless price and rate of change both declined making a low in early October 2022. A technical pattern began to form, which appears to align more closely with a symmetrical triangle; So when measuring its height and projecting it from the breakout point aligns with the new all-time highs that were reached on 27 June 2025.
21 Mar 2025 - New Cycle Trough
A new V-bottom formed shortly after the current cycle began. Both ROC indicators had already crossed their SMAs to the upside, showing early signs of positive acceleration, days before of price broke through the resistance and reached the new record high.
The 227-SMA is likely to cross from below the fast SMA while a possibility of a pullback increase.
Following that, the 114-CMA will probably has the chance to cross back the 227-CMA, with the price potentially confirming a new support level and resuming its uptrend - in line with the broader cycle timeline.

Beautiful ABCD pattern appearing on bigger tf.Beautiful ABCD pattern appearing on
bigger tf.
Crossing 101 - 102 with Good Volumes may
trigger new highs towards 120 atleast.
78 - 80 is an Immediate Resistance area.
On the flip side, a Very Strong Support is
around 68 - 70 & then around 62 - 63

EURAUD - Bearish Trend to Start - Harmonic + Divergence ComboHello Friends, Market after making series of HH and HLs, have finally made a fantastic Bearish Divergence on 1H time frame which is clear sign of correction.
Further market has almost completed AB=CD harmonic pattern, which is suggesting Potential Reversal Point as marked.
these confluences suggest a bearish trend to start
We are waiting for the neckline (HL) to break with a good candle and then we enter into the market with TP1 and TP2 with a R:R of 1:1 and 1:2 respectively. Further, place stoploss slightly above the HH.

Good Stock for Medium to Long TermClosed at 181.52 (05-06-2025)
Printed HH on Daily tf.
Should retrace towards 177 - 178
& then may be around 165 -166 to print
HL.
188 - 195 is the resistance for now that
needs to be sustained.
Crossing this may move the price towards
235 - 236.
Medium to Long term target can be around
290 - 300 if 260 is crossed with Good Volumes.

GBPJPY - Formation of Gartley Bearish Pattern Market is forming Gartley Pattern - We can enter into the market upon formation of any bearish candle-

AUDUSD BULLISH RUNAUDUSD is expected to buy to complete the Deep crab pattern. With higher than expected CPI figures AUD is expected to bully the green-back which is struggling with low interest rate figures as a result of declining inflation figures nearing its 2024 inflation target of 2% and global trade wars.
expecting AUDUSD to hit around0.66000 psychological level

NZDUSD BUYSNZDUSD is expected to buy to complete the crab pattern around 0.61200 psychological level BOUNCING FROM A 1HR FVG(Fair value Gap). we saw an expected rate cut of NZD interest rate at 25 basis point(0.25%) was was a dovish stand by the central bank. with investment sentiment still high on risk-on assets, I expect nzd to bully the green-back which is struggling with low interest rate figures as a result of declining inflation figures nearing its 2024 inflation target of 2% and global trade wars.

NZDJPY Analysis Potential Temporal Sell for Continous Buy
I just conducted a very powerful analysis on NZDJPY. Please watch the video to learn more.
Also remember to drop your comment below this video, thank you all.


GBPUSD: Bearish Order FlowSpread out across multiple days, GBPUSD has been ranging now. Maybe it's time GBPUSD reached the peak of this distribution with this Shark Pattern. Let's see how it plays out.

Buy with SLCan buy with SL 0.03454
TP 0.03480
Crossing & Sustaining 0.03509
may lead it towards 0.0565

NZD/CHF SELL IDEA (R:R=3.6)Selling NZD/CHF now. A wonderful BUTTERFLY just formed on the 1 hour chart. Currently making lower highs and lower lows on larger timeframes.
Stop Loss is: 0.49350
Please move SL to break even when trade is 75+ pips in profit.
Target: 0.47500
Happy Trading! :)

Bullish on All Time Frames.Bullish on All Time Frames.
Monthly Closing above 211 - 212 would
be very positive for OGDC.
Retested the Previous Breakout Level
around 194 - 195.
Hidden Bullish Divergence on Daily Tf.
227 - 228 is the Weekly Resistance that
seems to break this time.
If this level is Sustained, we may witness
250+ initially.

Will you dare to short NVDIA at 122? Shorting NVDIA something no one would have dared to do in 2024 and rightfully so. It was having a massive uptrend and there was no reason to go against it.
2025 is completely different story. The emergence of DeepSeek has dampened its prospects and NVDIA saw a massive double top at 152 (The same time S&P reversed at 6144).
It has now fallen to a low of 107 and made its way back to 121 where there is a pattern to sell. Here is our thinking:
1) It is in a daily downtrend
2) It is following the H4 trend
3) There is a pattern to sell
4) RSI divergence is present
We will sell around 122 with a stop loss of 125.50 and target the low of 107.
Yes, we just follow the trend and not the news or sentiments.

USD/CHF: Bearish Continuation Towards Key SupportUSD/CHF has maintained a strong bearish trend, forming a series of lower highs and lower lows. The chart highlights a **Deep Crab** harmonic pattern, which previously triggered a corrective move before resuming its overall downtrend.
Currently, price action is trading near **0.8767**, approaching a key support zone at **0.8722** (HOP level). The recent rejection from the **H4 supply zone** around **0.8920** further confirms bearish momentum, suggesting sellers remain in control.
**Key Considerations:**
- A breakdown below **0.8722** could accelerate further downside, extending losses towards lower psychological levels.
- A potential pullback may occur if buyers step in at support, but the overall bearish structure remains intact unless a significant reversal signal appears.
**Conclusion:** USD/CHF remains under bearish pressure, with a high probability of further declines. Traders should monitor price action at support for potential continuation or reversal signals before committing to new positions.

Recently made LL on Shorter TF, but..Recently made LL on Shorter TF,
but also it is a Support level with Double Bottom.
Hidden Bullish Divergence on Daily TF.
Immediate Support lies around 86 - 89
& Immediate Resistance is around 91 - 92.
Sustaining 91 - 92 on Weekly TF, would
lead it towards 98 - 99.
Ultimate Target (if 109-110) is Sustained,
is around 128 - 130.
Should not break 81 now.

GBP/USD SELL IDEA (R:R=5)Selling GBP/USD now. I placed a sell earlier at 1.29276 after seeing a wonderful BUTTERFLY form on the 30 min chart. Already starting to form lower highs and lower lows on smaller timeframes.
Stop Loss is: 1.29552
(Due to SL hunting)
Please move SL to break even when trade is 100+ pips in profit.
1st Target: 1.26730
2nd Target: 1.26072
3rd Target: 1.25680
Happy Trading! :)
