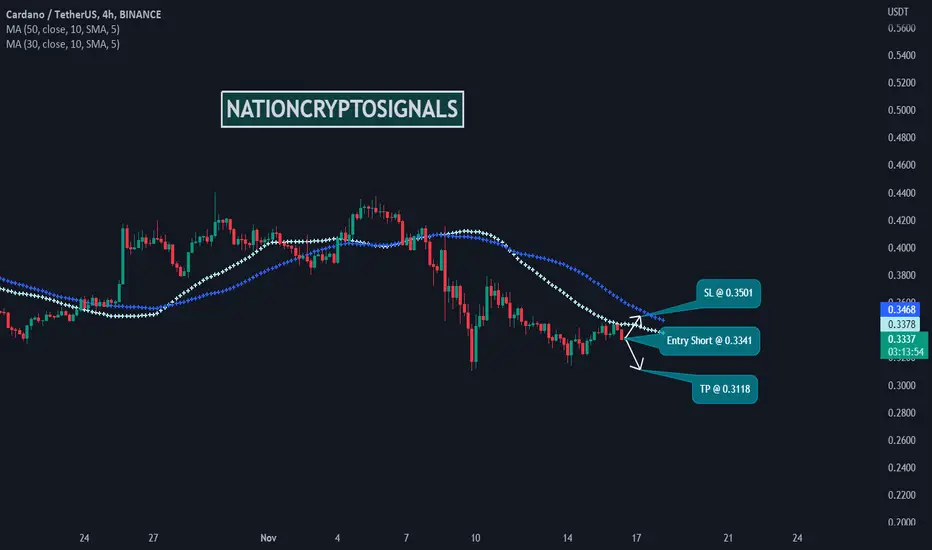
ADAUSDT ShortTime Frame: 4H
Symbol: ADAUSDT
Entry: 0.3341
TP: 0.3118
SL: 0.3501
Bias: Short
Crypto pairs are in constant drive for a bearish price trajectory. As we see the price pattern is oscillating between dynamic support and resistance for several weeks in same range , we have projected our set ups according to our expectation from the ranges.
Harmonicsignals
ADAUSDT ShortTime Frame: 4H
Symbol: ADAUSDT
Entry: 0.3401
TP: 0.3150
SL: 0.3566
Bias: Short
For crypto pairs our goal is to look for small opportunities in tight ranges. The study of dynamic support and resistance do not seem to be very appealing for a strong directional bias. We can expect some impulsive moves from current price points.

ADAUSDT ShortTime Frame: 4H
Symbol: ADAUSDT
Entry: 0.3336
TP: 0.3043
SL: 0.3552
Bias: Short
The overall crypto trend is heading downward and we do not see any short term come back. For the long term investors crypto is more suitable now than short term opportunity seekers.

ADAUSDT ShortTime Frame: 4H
Symbol: ADAUSDT
Entry: 0.3625
TP: 0.3339
SL: 0.3801
Bias: Short
For this instrument our bias is bearish. We are looking for a selling trade opportunity.

ADAUSDTOn the four-hour and daily time frame, we have a positive RSI divergence, which is accompanied by the harmonic patterns of CYPHER & Nen Star
On the other hand, the support range of $0.2755 has been maintained for now, but we don't have any highs.
If the $0.2755 range is maintained, there is a high probability of breaking the long-term downtrend line.
What do you think?

ADAUSDT LongTime Frame: 4H
Symbol: ADAUSDT
Entry: 0.3600
TP: 0.3854
SL: 0.3362
Bias: Long
For this instrument we are neutral but in some cases we have chosen to take directional bias. However, the overall movement and volatility do not imply any strong price movement possibility or any type of future outcome that will be strongly based up directional bias. So the vast majority of our set up selections are based upon recent price fluctuations.

RODRIGO ( RODRG)create postive BAT Harmonic patern
by passing 26.30
T1 : 27.32 (1.HEDEF)
T2 : 28.00 (2.HEDEF)
T3 : 28.82 (3.HEDEF)
STOP LOSS : 25.60
GOOD LUCK

ADAUSDT ShortTime Frame: 4H
Symbol: ADAUSDT
Entry: 0.3629
TP: 0.3283
SL: 0.3822
Bias: Short
We are bearish for crypto pairs. Our hair splitting analysis reveals that there is a higher probability of further price drop. We have projected according to our recent understanding of the market.

Bandhan BankHello and welcome to this analysis
Upon completing a Bearish 5-0 Harmonic pattern it has formed a Bullish Harmonic AB=CD (62/162) at 225 and at the same time activated another Bullish Harmonic AB=CD (38/224) 225-215 PRZ.
Bullish reversal is being seen today. As long as its above 215 it can do 250/275. Accumulate in the zone of 225-235
Good risk reward set up at current level
Happy Investing

ADAUSDT ShortTime Frame: 4H
Symbol: ADAUSDT
Entry: 0.3832
TP: 0.3584
SL: 0.4046
Bias: Short
The recent price pattern shows some mediocre possibilities for the relevant pairs. Considering the current gap and the support and resistance we have projected the upcoming price moves.

ADAUSDT LongTime Frame: 4H
Symbol: ADAUSDT
Entry: 0.4100
TP: 0.4311
SL: 0.3941
Bias: Long
We are planning an impulsive long opportunity from the current price context.

Sun PharmaHello and welcome to this analysis
On daily time frame it has activated a Bearish Harmonic Deep Crab
The stock could see a pullback till 1025-975 as long as it is below 1080

ADAUSDT LongTime Frame: 4H
Symbol: ADAUSDT
Entry: 0.4063
TP: 0.4288
SL: 0.3880
Bias: Long
The study of dynamic support and resistance displays a narrow range and the price is oscillating between two extremes but the volatility factor is low. That is why we cannot expect a high potential trade from the current price context. Considering the price pattern we can expect some price move from support to resistance and resistance to support.

ADAUSDT LongTime Frame: 4H
Symbol: ADAUSDT
Entry: 0.3934
TP: 0.4217
SL: 0.3705
Bias: Long
We are bullish for this instrument as price is oscillating between two extremes, there is a possibility of moving upward.

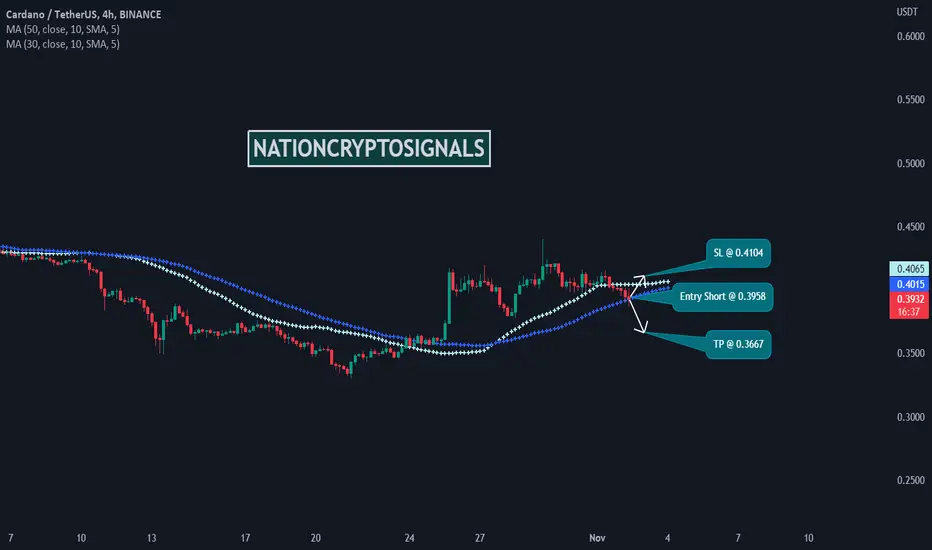
ADAUSDT ShortTime Frame: 4H
Symbol: ADAUSDT
Entry: 0.3958
TP: 0.3667
SL: 0.4104
Bias: Short
The current price pattern of the forex pair is denoting a paradigm shift because of recent price fluctuation. The study of recent support and resistance proves that the course of price action will abide by our projected trajectory.
ADAUSDT ShortTime Frame: 4H
Symbol: ADAUSDT
Entry: 0.4081
TP: 0.3823
SL: 0.4347
Bias: Short
For this instrument our goal is to capitalize from the narrow range. We strongly believe that history repeats itself and there will be no exception here.

BANK NIFTYHello and welcome to this analysis
Bank Nifty has activated a Bearish Harmonic Bat in daily time frame.
The anticipated retracement levels are 38-50-62% of the upmove. The view would be negated if it sustains above 41530.
As per Ichimoku Time and Wave Theory also we have a turn date activated. Until it sustains below 41530 it would remain weak. In case it breaks on the upside then the low of Friday October 28 would be considered as a stop loss for longs

📉✌BTC 30min Short Position✌📈BINANCE:BTCUSDT
COINBASE:BTCUSD
Hi traders, first look at my previous analysis (linked below).
💥A quick short position can have a good chance of winning.
between now and the yellow area above, you can open short position in two steps.
If the price falls and reaches the TP1, you can risk-free the position.
TP1-2-3-4-5-6 ---> short position.
The optimum stop-loss is on the chart.
Please share ideas and leave a comment,
let me know what you think.
CrazyS✌

ADAUSDT ShortTime Frame: 4H
Symbol: ADAUSDT
Entry: 0.4138
TP: 0.3885
SL: 0.4339
Bias: Short
The crypto pairs are narrowed down by lack of momentum and volatility recently. However we see some clear price actions last week which signify a sharp up and down swings in various crypto pairs due to some fundamental and technical factors.

📉✌BTC 30min Long Position✌📈BINANCE:BTCUSDT
COINBASE:BTCUSD
Hi traders, first look at my previous analysis (linked below).
💥If the price trend does not break the bottom of the yellow zone, a quick long position can have a good chance of winning.
between now and the yellow area, you can open long position in two steps.
If the price reaches the risk-free level, you can risk-free the position.
TP1-2-3-4-5 are on the chart.
The optimum stop-loss is on the chart.
Please share ideas and leave a comment,
let me know what you think.
CrazyS✌

xxxUSD ShortInflation is just at corner ...
We should be expecting 5th wave completion ...
This excitement might be temporal.
Dollar index is still bullish ...
Looking for shorting entry will be much safer ..

CYPHER Harmonic Pattern - Made Easy For Everyone !The Cypher harmonic pattern is a technical analysis indicator used by traders to identify valuable support and resistance levels based on the Fibonacci sequence of numbers and detect trend reversals.
Here, in this article, we explain how the Cypher harmonic pattern works, identify it, and trade it.
What is the Cypher Harmonic Candlestick Pattern?
The Cypher harmonic pattern is a technical analysis formation indicating a price-action reversal.
The pattern was discovered by D. Oglesbee and is known as a relatively advanced pattern formation. In structure, the Cypher pattern is similar to the butterfly harmonic pattern; however, the Cypher is not a very common chart pattern due to its unique Fibonacci ratios.
The Cypher pattern, which can be either bullish or bearish, has five points (X, A, B, C, and D) and four legs (XA, AB, BC, and CD). Like any other harmonic pattern, the theory behind the Cypher chart pattern is that there is a strong correlation between Fibonacci ratios and price movements.
Eventually, the market is expected to reverse from point D after the four market swing wave movements
How to Identify and Use the Cypher Harmonic Pattern in Forex Trading?
Much like any other harmonic chart pattern, several conditions must occur so you can identify the Cypher pattern:
B point retracement of the primary XA leg ranges between 38.2% to 61.8% Fibonacci levels
C point is an extension leg with a Fibonacci ratio that should be between 127.2% to 141.4% of the primary XA leg
D point should break the 78.6 retracement level of XC
Let’s see what the Cypher harmonic pattern looks like on a trading chart.
Cypher Pattern – Set a Stop Loss
A reasonable stop-loss level when trading the Cypher pattern is simple and does not necessarily require the combination of Fibonacci retracement.
All you need to do is to place the stop loss somewhere below the D level because if this level breaks, the entire Cypher pattern is invalidated. So, the stop would be placed at the next support or resistance level, which is the X-point
Cypher Pattern – Set a Take Profit Target
The simple Cypher pattern trading method is using its points as profit targets, meaning the A and C levels.
How accurate is the Cypher harmonic chart pattern?
The Cypher harmonic pattern has been historically proven to be a fairly reliable and accurate chart pattern. According to various studies, the pattern has an accuracy rate of around 70%.

IBM 4HR ANTI BAT HARMONIC SHORTVery familiar stock Vol at about 7M pattern looks fairly clean could get in at entry, only paper trading this one myself.
