Bat Harmonic Pattern - Made Easy For Everyone !The BAT pattern gets its name from the bat-shaped end product. Identified by Scott Carney in 2001, the BAT pattern is made up of precise elements that identify PRZs.
The bat harmonic pattern follows different Fibonacci ratios. One of the major ways to differentiate it from a Cypher pattern is the B point which, if it doesn’t go above the 50 percent Fibonacci retracement of the XA leg then it is a bat, otherwise it can turn into a cypher structure.
The market strategy of the pattern is suitable for all time frames and all markets types. Traders have to keep in mind that on lower time frames using the bat pattern market strategy has some challenges because the pattern tends to appear on less frequent on lower time frames.
How to Draw a Bat Pattern :
As mentioned earlier, the bat harmonic pattern looks very similar to the Gartley pattern . It has four different legs marked as X-A, A-B, B-C, and C-D.
X-A: In its bullish version, the first leg appears when the price sharply increases from point X to point A. This is the longest leg of the pattern.
A-B: The A-B leg then sees the price switching direction and retracing 38.2 to 50 percent using the Fibonacci retracement of the distance covered by the X-A leg. Have it in mind that the A-B leg can never retrace beyond point X. But if it does, the pattern is considered invalid. As you can see, if the price with a spike reaches a point under 50% but with the body above, this will be Valid. The candle Body's important.
B-C: Here, the price changes direction for a second time and moves back up, retracing anything from 38.2 to 88.6 percent of the distance covered by the A-B leg. If it retraces up above the high of point A, the pattern is considered invalid.As you can see, if the price with a spike reaches a point above 88.6% but with the body is below, this will be Valid. The candle Body's important.
C-D: This is the last and most significant aspect of the pattern. As with the Gartley pattern , this is where the bat harmonic pattern ends and traders place their long (buy) trade at point D. ( PRZ Potential Reversal Zone )
The 88.6% percent retracement of the X-A leg is our Entry Point. D POINT or PRZ
Before trying and trading the pattern, confirm from this checklist that the pattern is real. It should include these vital elements:
A-B : 38.2 to 50% max percent using the Fibonacci retracement
B-C : An 38.2 to 88.6% max percent Fibonacci retracement of the X-A leg
C-D : The 88.6% percent retracement of the X-A
Market strategy:
Step 1: Drawing the pattern
Begin by clicking on the XABCD pattern indicator that is found on the right-hand side toolbar of Tradingview
Identify the beginning point X, which can be any swing high or low point on the chart.
You should get 4 points or 4 swings high/low points that join and form the harmonic bat pattern strategy as explained Above
Step 2: Trading the pattern
The 88.6 percent Fibonacci ratio provides traders a more reliable risk/reward ratio which is why the market strategy of the bat pattern is such a very popular as a market strategy. The best entry point is the 88.6 percent Fibonacci retracement which is a very accurate market turning point.
It is recommended that traders should enter as soon as they touch the 88.6 percent figure. Oftentimes the harmonic bat pattern strategy doesn’t go much above this level.
Step 3: Placing a stop-loss
Usually, traders should place their protective stop-loss lower than the point X of a harmonic bat pattern . That is the only logical location to hide the stop-loss because any break below will automatically invalidate the pattern.We use as manual the 113% Fibo of X-A as a picture below.
Step 4: Take-profits
There can be several ways to manage your trades, but the best target for this pattern should be to use a multiple-take profit formula. For this pattern strategy, take the first partial profit once you hit wave-B level and the remaining half wave-C.
Once the price reaches the first target you should move the Stop Loss at BE ( breakeven - entry point ) or close the position in profit.
By doing this you will accomplish two things:
first, you’ll ensure that you accumulate profits and secondly, if the markets reverse, you ensure you’re stopped at BE and don’t lose any money.
There are many ways to calculate the Take profits Target, this is one of the most used and we suggest starting in this way.
Identical rules to draw and set parameters like stop loss and take profits are for the Bearish version. Nothing changed.
Please note this is an introduction to the BAT pattern , for beginners. I tried to make it more easy and simple as I can.
Harmonicsignals

ADAUSDT NeutralTime Frame: 4H
Symbol: ADAUSDT
Bias: Neutral
For this instrument our bias is neutral. We do not see any strong directional bias from the current price context.

ADAUSDT ShortTime Frame: 4H
Symbol: ADAUSDT
Entry: 0.4304
TP: 0.4111
SL: 0.4450
Bias: Short
For crypto our bias is not strong for any specific direction. Current price patterns do not signify any pattern strongly. We had better look for better opportunities in future and should not over-indulge in current set up.

ADAUSDT ShortTime Frame: 4H
Symbol: ADAUSDT
Entry: 0.4239
TP: 0.4050
SL: 0.4427
Bias: Short
The crypto is range-bound today. The core driving force of crypto is not very strong today. Our goal is to adapt with the dynamic micro trends that are showing up here and there and try to avail any significant opportunity. Our goal is to seek long and short opportunities following the action plan that we have drawn on chart.

ADAUSDT ShortTime Frame: 4H
Symbol: ADAUSDT
Entry: 0.4320
TP: 0.4132
SL: 0.4463
Bias: Short
The price pattern of these instruments is getting more range bound and offering less scope to take a bigger or bold directional steps. The price levels are hardly getting broken due to lack of fervor in the market. Our goal is to seek opportunities from the inefficiencies that exist in the market.

ADAUSDT ShortTime Frame: 4H
Symbol: ADAUSDT
Entry: 0.4249
TP: 0.4042
SL: 0.4399
Bias: Short
The current price pattern of this pair is showing a bearish propensity and the oscillations and momentum is also in bearish direction. So we go for a sell trade.

vite/usdtvite/usdt looking good for short trade
buy at 0.02874
stoploss 0.02986
take profit will be 0.02650 almost 8% profit

Bat Harmonic Pattern - Made Easy For EveryoneThe BAT pattern gets its name from the bat-shaped end product. Identified by Scott Carney in 2001, the BAT pattern is made up of precise elements that identify PRZs.
The bat harmonic pattern follows different Fibonacci ratios. One of the major ways to differentiate it from a Cypher pattern is the B point which, if it doesn’t go above the 50 percent Fibonacci retracement of the XA leg then it is a bat, otherwise it can turn into a cypher structure.
The market strategy of the pattern is suitable for all time frames and all markets types. Traders have to keep in mind that on lower time frames using the bat pattern market strategy has some challenges because the pattern tends to appear on less frequent on lower time frames.
How to Draw a Bat Pattern :
As mentioned earlier, the bat harmonic pattern looks very similar to the Gartley pattern. It has four different legs marked as X-A, A-B, B-C, and C-D.
X-A: In its bullish version, the first leg appears when the price sharply increases from point X to point A. This is the longest leg of the pattern.
A-B: The A-B leg then sees the price switching direction and retracing 38.2 to 50 percent using the Fibonacci retracement of the distance covered by the X-A leg. Have it in mind that the A-B leg can never retrace beyond point X. But if it does, the pattern is considered invalid. As you can see, if the price with a spike reaches a point under 50% but with the body above, this will be Valid. The candle Body's important.
B-C: Here, the price changes direction for a second time and moves back up, retracing anything from 38.2 to 88.6 percent of the distance covered by the A-B leg. If it retraces up above the high of point A, the pattern is considered invalid.As you can see, if the price with a spike reaches a point above 88.6% but with the body is below, this will be Valid. The candle Body's important.
C-D: This is the last and most significant aspect of the pattern. As with the Gartley pattern, this is where the bat harmonic pattern ends and traders place their long (buy) trade at point D. ( PRZ Potential Reversal Zone )
The 88.6% percent retracement of the X-A leg is our Entry Point. D POINT or PRZ
Before trying and trading the pattern, confirm from this checklist that the pattern is real. It should include these vital elements:
A-B : 38.2 to 50% max percent using the Fibonacci retracement
B-C : An 38.2 to 88.6% max percent Fibonacci retracement of the X-A leg
C-D : The 88.6% percent retracement of the X-A
Market strategy:
Step 1: Drawing the pattern
Begin by clicking on the XABCD pattern indicator that is found on the right-hand side toolbar of Tradingview
Identify the beginning point X, which can be any swing high or low point on the chart.
You should get 4 points or 4 swings high/low points that join and form the harmonic bat pattern strategy as explained Above
Step 2: Trading the pattern
The 88.6 percent Fibonacci ratio provides traders a more reliable risk/reward ratio which is why the market strategy of the bat pattern is such a very popular as a market strategy. The best entry point is the 88.6 percent Fibonacci retracement which is a very accurate market turning point.
It is recommended that traders should enter as soon as they touch the 88.6 percent figure. Oftentimes the harmonic bat pattern strategy doesn’t go much above this level.
Step 3: Placing a stop-loss
Usually, traders should place their protective stop-loss lower than the point X of a harmonic bat pattern. That is the only logical location to hide the stop-loss because any break below will automatically invalidate the pattern.We use as manual the 113% Fibo of X-A as a picture below.
Step 4: Take-profits
There can be several ways to manage your trades, but the best target for this pattern should be to use a multiple-take profit formula. For this pattern strategy, take the first partial profit once you hit wave-B level and the remaining half wave-C.
Once the price reaches the first target you should move the Stop Loss at BE ( breakeven - entry point ) or close the position in profit.
By doing this you will accomplish two things:
first, you’ll ensure that you accumulate profits and secondly, if the markets reverse, you ensure you’re stopped at BE and don’t lose any money.
There are many ways to calculate the Take profits Target, this is one of the most used and we suggest starting in this way.
Identical rules to draw and set parameters like stop loss and take profits are for the Bearish version. Nothing changed.
Please note this is an introduction to the BAT pattern, for beginners. I tried to make it more easy and simple as I can.

ADAUSDT ShortTime Frame: 4H
Symbol: ADAUSDT
Entry: 0.4316
TP: 0.4129
SL: 0.4465
Bias: Short
The bearish side outweighs the bullish side. We can land for a selling opportunity.

ADAUSDT NeutralTime Frame: 4H
Symbol: ADAUSDT
Bias: Neutral
There is no strong directional bias for this instrument. We have to wait for a better signal opportunity.

ADAUSDT LongTime Frame: 4H
Symbol: ADAUSDT
Entry: 0.4319
TP: 0.4539
SL: 0.4156
Bias: Long
The price trajectory that we see today has no new paradigm for strong bullish or bearish momentum creation. Our goal is to look for trading opportunities from the inconsistency of the price loops that dictate the current crypto market.

ADAUSDT LongTime Frame: 4H
Symbol: ADAUSDT
Entry: 0.4593
TP: 0.4845
SL: 0.4376
Bias: Long
The oscillation of price levels between support and resistance signify a weaker price action set up. The major bias for this pair is long and we strongly believe that the weakness that is seen recently in different crypto pairs will result in a long drive . We can anticipate long opportunities in a narrow range from the current price context.

ADAUSDT ShortTime Frame: 4H
Symbol: ADAUSDT
Entry: 0.4405
TP: 0.4173
SL: 0.4578
Bias: Short
The price movement of different crypto pairs has a common trend. The weakness of the price trend or low volatility is resulting into neutral decisions . However, in some cases we can anticipate short or long opportunities which may be subject to upcoming volatility and trend power.


ADAUSDT ShortTime Frame: 4H
Symbol: ADAUSDT
Entry: 0.4560
TP: 0.4321
SL: 0.4740
Bias: Short
We are bearish. There is a high probability of a strong price fall following by the current price oscillations that we have seen recently.

OIL INDIA LTDHello and welcome to this analysis
Oil India in the daily time frame after activating a Bullish Harmonic ABCD completed a 38% Fibonacci retracement. In the process it activated an Ichimoku C Clamp in the weekly time frame.
Stock could be accumulated between 180-190 for 210 (short term) 240 (medium term) and 350 (long term)
View would be invalid below 170
Happy Investing

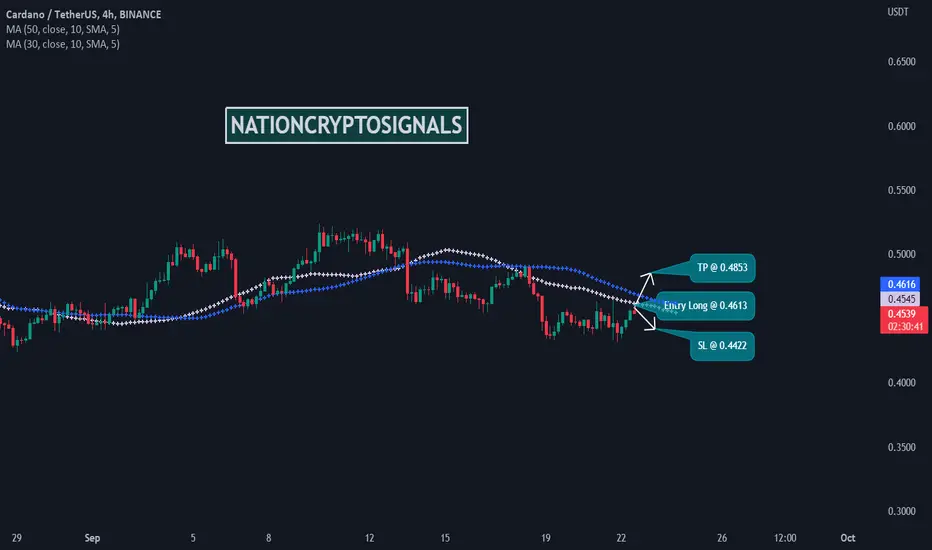
ADAUSDT LongTime Frame: 4H
Symbol: ADAUSDT
Entry: 0.4613
TP: 0.4853
SL: 0.4422
Bias: Long
Considering the current set ups and volatility our goal is to go for a long trade for this pair.
VEDANTAHello and welcome to this analysis
VEDL has given a Bullish Harmonic Sea Horse breakout indicating a target near 415-425 with a stop loss at 255. It could be accumulated between 325-285 with a stop loss at 255.
Medium term bullish structure with a good risk reward set up
Happy Investing

How to trade AUDUSD after the massive crash?Yesterday was the biggest sell off on the US equities in over 2 years.
We caught a great sell on SPX and also AUDUSD.
The market is recovering from the big sell off. I see a chance to buy AUDUSD with a very tight stop loss below 0.6705.
There is a harmonic pattern with M15 and M30 divergence.

BNBBTC NeutralTime Frame: 4H
Symbol: BNBBTC
Bias: Neutral
We are neutral and we do not see any significant directional bias.

ADAUSDT NeutralTime Frame: 4H
Symbol: ADAUSDT
Bias: Neutral
We are neutral for this pair. We do not have any bias for the time being.
SOLUSDT ShortTime Frame: 4H
Symbol: SOLUSDT
Entry: 38.43
TP: 35.53
SL: 41.05
Bias: Short
The price pattern is displaying bias for a selling opportunity. Considering the current price levels we can sell the instrument.

ETHUSDT ShortTime Frame: 4H
Symbol: ETHUSDT
Entry: 1742.23
TP: 1622.25
SL: 1851.92
Bias: Short
The pair is showing a positive tendency to push the price down . Though apparently the pattern is demonstrating a bullish trend , the hidden cycle of price is insinuating a bearish scope.
