Harmonictraders
BEARISH BAT ON USOIL was a huge successWhat a successful trading opportunity on usoil, the bearish bat pattern was in alignment with the weekly order block. A full video breakdown of this trade and more will be posted soon, and the link is attached to this video for you all to learn.

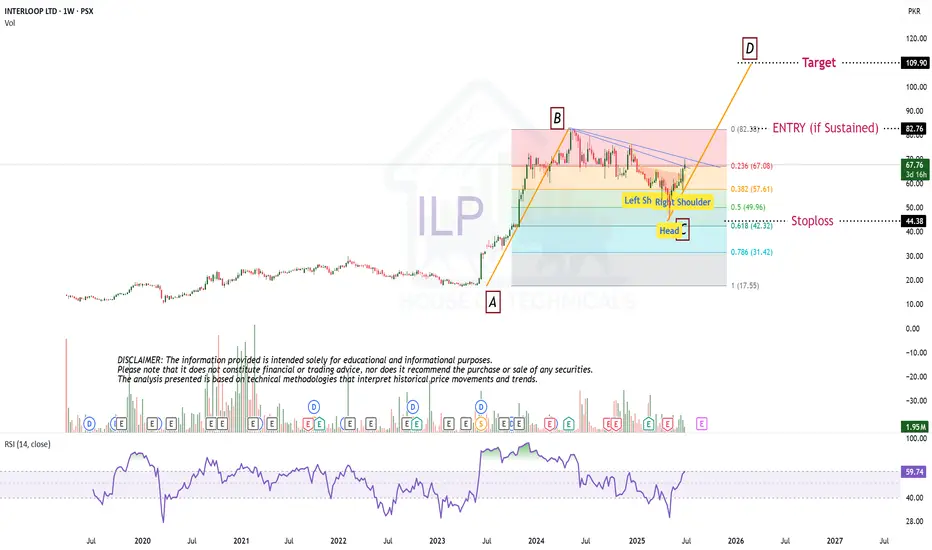
Beautiful ABCD pattern appearing on bigger tf.Beautiful ABCD pattern appearing on
bigger tf.
Crossing 101 - 102 with Good Volumes may
trigger new highs towards 120 atleast.
78 - 80 is an Immediate Resistance area.
On the flip side, a Very Strong Support is
around 68 - 70 & then around 62 - 63

Good Stock for Medium to Long TermClosed at 181.52 (05-06-2025)
Printed HH on Daily tf.
Should retrace towards 177 - 178
& then may be around 165 -166 to print
HL.
188 - 195 is the resistance for now that
needs to be sustained.
Crossing this may move the price towards
235 - 236.
Medium to Long term target can be around
290 - 300 if 260 is crossed with Good Volumes.

INFY 1H Chart Analysis (Bullish Bat + Falling Wedge)NSE:INFY
INFY 1H Chart Analysis (Bullish Bat + Falling Wedge)
In this 1-hour chart of Infosys Ltd (NSE: INFY), a Bullish Bat Harmonic Pattern has completed at point D, suggesting a potential reversal zone. Additionally, a falling wedge formation adds to the bullish confluence.
1. Pattern Structure:
The chart displays a complete Bullish Bat Pattern (X-A-B-C-D).
Point D aligns with the PRZ (Potential Reversal Zone), with a CD leg extending \~1.618 of BC, supporting a bullish reversal.
2. Falling Wedge Pattern;
A falling wedge, generally a bullish pattern, has formed from point C to D.
A breakout above the wedge trendline may confirm a bullish move.
3. Price Action:
The price is testing the upper boundary of the wedge.
Buying interest is visible at the P,R,Z near ₹1,540–₹1,545.
Trade Plan:
Buy Entry: Above ₹1,555 (confirmation breakout above wedge)
Stop Loss: Below ₹1,538 (beneath point D and wedge support)
Target 1: ₹1,568 (previous resistance)
Target 2: ₹1,611 (mid-term resistance)
Target 3: ₹1,631 (major swing high)
A strong bullish confluence exists with the harmonic pattern and falling wedge. Wait for confirmation above ₹1,555 before entering. Maintain proper risk-reward with a stop below ₹1,538.
NSE:INFY NSE:NIFTY NSE:CNXIT

GBPAUD SHORT TERM SELLS BEFORE TE BUYSGbpAUD is expected to sell for a short term correction before the major buys

AUDNZD Potential Bullish Cypher Hello guys, this is my view on AUDNZD. so I will update you guys as things progress on this trading opportunity either in a loss or in a profit.
Remember you are not in competition with anyone, is not about who is the best analyst. is all about making small/big consistent profits little by little over time.
Your personal encounter on the chart is going to be different from others. be real to yourself and trust yourself to make the right decision on the chart.
Love you all.

Navarro Harmonic & Pitchfork StrategyNavarro pattern formation is present. According to our pitchfork strategy, after the price exits the pitchfork channel, our target levels are 100%, 150% and 200% respectively. Good luck.

Gold Bearish Crab Signals Potential Reversal!FX_IDC:XAUUSD
Gold is currently testing a critical resistance zone near $2,947, where a Bearish Crab harmonic pattern has formed. This structure suggests potential downside risk as price approaches exhaustion at this key level.
🔹 Technical Breakdown:
📌 Resistance: $2,956
📌 Bearish Crab PRZ (Potential Reversal Zone): $2,947
📌 Support Levels: $2,916 → $2,795
If gold fails to break and hold above $2,947, we could see a pullback toward $2,795, aligning with the monthly fractal resistance. However, a sustained move above $2,956 would invalidate the bearish scenario, potentially opening the door for further upside.
Happy Trading,
André Cardoso
Risk Warning: Trading financial assets carries a high level of risk and may result in the loss of all your capital. Make sure to fully understand the risks involved before you start trading and carefully consider your investment objectives, level of experience, and risk tolerance. The data and information provided in this content do not constitute financial or investment advice and should not be considered as such. Only invest what you can afford to lose, and be aware of the risks associated with trading financial assets.

$BTCUSD Expansion or Reversal? Key Levels to WatchBITSTAMP:BTCUSD
Overview
We explore the key resistance and support levels, potential pattern formations, and what we should monitor in the coming sessions.
Bitcoin appears to be forming an expanding triangle within the broader range of its weekly fractals. Additionally, there is the potential emergence of a double top reversal pattern . This pattern has a critical support level at $89,164, which acts as a neckline. A breakdown below this support could threaten the weekly fractal support positioned at $91,530. If the breakdown confirms , Bitcoin may experience a significant decline, targeting the previously broken monthly fractal resistance at $73,794 , representing a potential 17% drop . This level coincides with the 200% Fibonacci extension, often seen as a default target for a double top reversal.
Despite the downside risks, a corrective move lower may provide a bullish setup. A key support level at $76,368 aligns with the 161.8% Fibonacci extension of the last bullish swing. A potential Bullish Deep Crab Pattern could form around this level, indicating a possible reversal. If Bitcoin reaches this zone, traders should monitor price reactions for signs of recovery.
Will Bitcoin break higher, or is a deeper correction on the horizon? Stay tuned for further updates!
Key Takeaways
Weekly Fractal Resistance: $109,359
Weekly Fractal Support: $91,530
Daily Fractal Resistance: $98,871 (rejecting 38.2% Fibonacci retracement at $98,314)
Daily Support: $93,340 (above weekly fractal support)
Critical Support Level: $89,164 (neckline for a potential double top)
Downside Target: $73,794 (previous monthly fractal resistance, aligning with 200% Fibonacci extension)
Bullish Reversal Zone: $76,368 (161.8% Fibonacci extension, potential Bullish Deep Crab Pattern)
It is important to remain neutral regarding bias unless the price confirms the pattern with a breakdown below the neckline. Until that happens, the market structure remains open to different scenarios, and traders should focus on confirmation signals rather than assumptions.
Happy Trading,
André Cardoso
Risk Warning: Trading financial assets carries a high level of risk and may result in the loss of all your capital. Make sure to fully understand the risks involved before you start trading and carefully consider your investment objectives, level of experience, and risk tolerance. The data and information provided in this content do not constitute financial or investment advice and should not be considered as such. Only invest what you can afford to lose, and be aware of the risks associated with trading financial assets.

S&P 500Hello & welcome to this analysis
The index has entered into the potential reversal zone (PRZ) of a Bearish Harmonic ABCD pattern suggesting a higher probability of completion of an uptrend and likely reversal.
The likelihood of reversal confirmation would require it to start sustaining below 5900 on weekly basis since this is a pattern formed in the monthly time frame.
Harmonic Patterns are based on unique structures backed by specific Fibonacci ratios.
Regards

GBPJPY LONGHarmonic Pattern Trading Strategy:
1. Combine patterns with 2-3 confirmations (e.g., MA, BB, RSI, Stoch) for increased accuracy.
2. Implement proper risk management.
3. Limit exposure to 3% of capital per trade.
4. Exercise caution: Not every Harmonic Pattern presents a good trading opportunity.
5. Conduct thorough diligence and analysis before trading.
Disciplined approach = Enhanced edge.

AUDCAD BAT PATTERNHarmonic Pattern Trading Strategy:
1. Combine patterns with 2-3 confirmations (e.g., MA, BB, RSI, Stoch) for increased accuracy.
2. Implement proper risk management.
3. Limit exposure to 3% of capital per trade.
4. Exercise caution: Not every Harmonic Pattern presents a good trading opportunity.
5. Conduct thorough diligence and analysis before trading.
Disciplined approach = Enhanced edge.

GBPCAD BAT PATTERNHarmonic Pattern Trading Strategy:
1. Combine patterns with 2-3 confirmations (e.g., MA, BB, RSI, Stoch) for increased accuracy.
2. Implement proper risk management.
3. Limit exposure to 3% of capital per trade.
4. Exercise caution: Not every Harmonic Pattern presents a good trading opportunity.
5. Conduct thorough diligence and analysis before trading.
Disciplined approach = Enhanced edge.

A Lot is Happening on Gold!While the price of Gold (XAU/USD) has been rangebound since December 2024, a possible AB=CD harmonic support zone at US$2,471 continues to call for attention. A 61.8% Fibonacci retracement ratio also complements this support at US$2,473. Investors will also likely take note of the double-top pattern around the December 2024 peak of US$2,726. The pattern’s neckline at US$2,605 has been breached, and its profit objective conveniently resides just above the AB=CD support at US$2,483.
So, two patterns indicate that a push lower could materialise before buyers attempt to step in. However, given Gold’s clear uptrend, a bullish move above the December 2024 peak also remains possible.

near is nearhello friends
Considering the pressure of the price in the triangle and the upward trend before it, we can expect its failure and get a good profit.
Don't forget capital management...
good luck

Trade Execution on EURNZD|PRZ Area of Interest Simplified I hope you got value from the video, more to come, and wishing you all a more profitable trading opportunity.

Bullish BAT Supported by Volumewe have a bullish formation of BAT pattern on NYSE:NU which is supported by relative volume.
✅ Target 1 : $14.25
✅ Target 2 : $15.07
⛔ Stop Loss: $13.5
Have a good weekend! 🫡✌️

APOLLO TYRE BUY VIEW Stock Name - Apollo Tyre
Trend - Uptrend
Executed - Buy
Trade Reason :
Weekly - Uptrend and complete Correction at 0.618 Levels
Day - Harmonic Pattern - Bat Formation Valid and
Trend Reversed .
Entry - 520 Rs
Target - 555 Rs
Stoploss - 484 Rs
Expected Return - 7 %

USDCAD - Technical Analysis [Long & Short Setup]🔹 USDCAD Analysis on 1HR chart
- The current Trend Seem neutral
- Bearish Divergence is Present
- No Reversal pattern
- Found Harmonics AB=CD Pattern
- Waiting for a Break of Structure for Confirmation Either at Point C or At Point B.
- If point C break we short.
- If point B break we long.
🔹 Trade Plan At Point C
- Entry Level = 1.35589
- Stop Loss = 1.36036
- TP1 = 1.35137
- TP2 = 1.34681
🔹 Trade Plan At Point B
- Entry Level = 1.36297
- Stop Loss = 1.35783
- TP1 = 1.36757
- TP2 = 1.37213
🔹 Risk Management
- First TP is 1:1
- Second TP is 1:2
🔹 How to Take Trade?
- Only risk 2% of your portfolio
- Take 1% risk entry with 1:1 RR
- Take 1% risk entry with 1:2 RR
Like and subscribe to never miss a new idea! ✌🏼

GME Strong Bearish Harmony!Nice approved Bearish Harmony. looking to take profits at target 2 and 4. 🤘🏻✌️

Harmonics on Tadawul Saudi IndexTADAWUL:TASI
Harmonics pattern drawn on TADAWUL:TASI shows the bullish trend till 11100-11200.
Bearish reversal zone may start from this zone and may correct around 10960-10860.
After taking correction, #tadawul will continue its move towards 11625 as showing strong bullish trend.

ABBV Harmonic Setup to go higher! Here are my 3 profit targets and my stop loss (after hitting first profit target we can make the stop loss trailing and bring it higher).
Enjoy The ride 🚀👌💎🤑
