CADJPY HUGE RETRACEMENT BOUNCE Pair: CADJPY
Timeframe: 1H , 4H
Analysis: Round number level, trend line, volume profile, support and resistance, ascending triangle, bounce off key levels
—————
Key Takeaway: Seen a big retracement for the pair of the past couple of weeks down to a critical level that has now been touched, we are looking for a big swing of bullish momentum before signs for entry can be found. We have stalled and are consolidation when high volume level and support level has been touched and also hit key fib levels.
—————
Level needed: need a close by —
—————
Trade: Long
RISK:REWARD —
—————
DO NOT ENTER OUR SETUPS WITHOUT CONFIRMATION
Harmonictraders

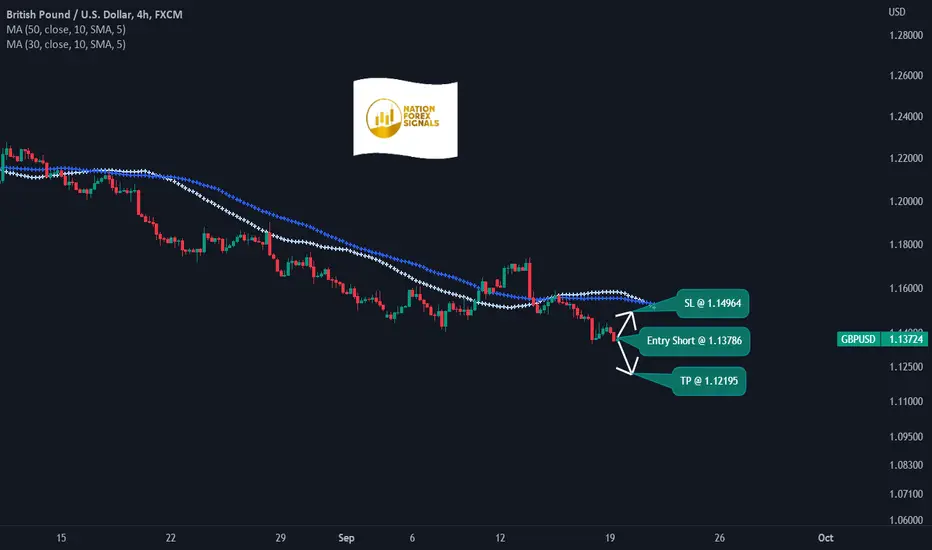
GBPUSD ShortTime Frame: 4H
Symbol: GBPUSD
Entry: 1.13786
TP: 1.12195
SL: 1.14964
Bias: Short
As we study the recent price action of this instrument, our core hypothetical stand point goes in favor of shorting the pair. The bias is explicitly bearish and we can safely avail a selling opportunity from the current price pattern.
EURUSD ShortTime Frame: 4H
Symbol: EURUSD
Entry: 0.99793
TP: 0.98345
SL: 1.00748
Bias: Short
The current price pattern of this instrument is displaying a short bias and the recent price fluctuations is more or less showing a bearish tendency and therefore we can anticipate a short opportunity set up.

XAUUSD ShortTime Frame: 4H
Symbol: XAUUSD
Entry: 1662.512
TP: 1627.552
SL: 1685.069
Bias: Short
For this instrument our bias is short . As we see the dynamic support and resistance are demonstrating a bearish sentiment and the sentiment will prevail for next few days .

USDCHF ShortTime Frame: 4H
Symbol: USDCHF
Entry: 0.96654
TP: 0.95484
SL: 0.97805
Bias: Short
The price pattern is displaying a bearish bias . If we consider the current price actions and the current dynamic trends at macro or micro level, one specific pattern is obvious and that is the upcoming selling opportunity. Considering the sentiment and overall directional bias , we can go for a short set up.

BATUSDTWill the trend continue?
Will it touch the wave 5 targets (blue boxes) in the medium term?
Just an analysis that can easily be wrong.

Why we are selling AUDCHF nowThe AUDCHF is in a clear downtrend and hitting the H4 MA now.
The pattern to sell is at 0.6505 but the pair is running out of breathe to get there.
We are hence selling at Point C for a 40-60 pip ride.
Stops above 0.6520.

USDCHF RESISTANCE BREAKS Pair: USDCHF
Timeframe: 1D , 4H
Analysis: Round number level, trend line, volume profile, support and resistance, breakout
—————
Key Takeaway: There is a lot of strength for USD itself so the main bias is bullish, we will be looking for breaks of resistance. We have already broken high volume level we just need a close above resistance
—————
Level needed: need a close by 0.96725
—————
Trade: Long
RISK:REWARD 1:5
—————
DO NOT ENTER OUR SETUPS WITHOUT CONFIRMATION

AUDUSD HEAD AND SHOULDERS Pair: AUDUSD
Timeframe: 1D , 4H
Analysis: Round number level, trend line, volume profile, support and resistance, descending wedge pattern, head and shoulder pattern
—————
Key Takeaway: Seen alot of bearish pressure for the pair but the market closed near a pullback level last week. We need to see price maybe retrace a bit more before coming back down.
—————
Level needed: need a close by —
—————
Trade: Short
RISK:REWARD —
—————
DO NOT ENTER OUR SETUPS WITHOUT CONFIRMATION

GBPUSD BEARISH TREND CHANNEL BOUNCEPair: GBPUSD
Timeframe: 1D , 4H
Analysis: Round number level, trend line, volume profile, support and resistance, trend channel
—————
Key Takeaway: been ranging in our downward trend channel for some time and there are alot of bearish fundamentals for GBP, we need to see a bounce off broken support turned resistance and the top of our trend channel
—————
Level needed: need a close by —
—————
Trade: Short
RISK:REWARD —
—————
DO NOT ENTER OUR SETUPS WITHOUT CONFIRMATION

VEDANTAHello and welcome to this analysis
VEDL has given a Bullish Harmonic Sea Horse breakout indicating a target near 415-425 with a stop loss at 255. It could be accumulated between 325-285 with a stop loss at 255.
Medium term bullish structure with a good risk reward set up
Happy Investing

$BCH Looking To OUTPERFORM It's Peers- Bulls? WYA?+Just a update on BCH, We did have a nice move up and attempted to brute force that KEY area, but the Bears weren't having it and we took a shot down... Although, BCH is about to VALIDATE that last low and really start to dig its feet in and start pushing possibly. Both Indicators are showing at Hidden Bullish Divergence at the pattern completion zone @ the 886, This is textbook and from strictly technical analysis, this following the same parameters in recent history before a next leg up... Pushing past that Supply Line will let this thing RIP

$DOT/Broadening Wedge In the Money Zone (PENDING)$DOT has formed a nice broadening wedge at the 886 range from the last swing high to swing row and is now trying to establish/validate a new local higher low above $6.76 at the $7 range. The MACD and RSI has printed hidden bullish divergence on both oscillator's indicating that momentum is started to build back up to possibly break through the top of the wedge and have a nice run...
We were due for a pullback after the last few weeks being manly green candles.. Overall, this is healthy price action and I don't think anyone should be panicking, as this is just traditional price action after a good few weeks for crypto...We also got some good news from the ETH merge.
Cheers
**DISCLAIMER, THIS IS NOT AN ACTIVE TRADE ATM, I AM JUST FOLLOWING THE STANDARDS OF TRADITIONAL TECHNICAL ANALYSIS. ANYTHING CAN HAPPEN**

XAUUSD NeutralTime Frame: 4H
Symbol: XAUUSD
Bias: Neutral
We are neutrally positioned for this instrument. As we do not see or predict any strong move, we better go neutral for the time being.

USDCHF NeutralTime Frame: 4H
Symbol: USDCHF
Bias: Neutral
The price of dollar is rising from last few months steadily and has created a strong bullish bias and established itself as a strong counterpart of many currencies . However, for day traders we do not find any suitable trading opportunity.

AUDUSD Bullish AB=CD, will the bears dive into a trap?This pair has been held captive by the bears, plummeting the currency value since early 2021. A bullish ab=cd is in midst of the bears target. Will the bears be triumphed by their rivals the Bulls, or will they take a breather before devouring any Bulls along their way?

JPYUSD ShortTime Frame: 4H
Symbol: JPYUSD
Entry: 0.007041
TP: 0.006899
SL: 0.007150
Bias: Short
The current price pattern is displaying a bearish bias and we can expect a selling opportunity.

GBPUSD LongTime Frame: 4H
Symbol: GBPUSD
Entry: 1.17305
TP: 1.19359
SL: 1.15847
Bias: Long
We are bullish for this pair considering the current price structure and trend strength.

EURUSD ShortTime Frame: 4H
Symbol: EURUSD
Entry: 1.01823
TP: 1.00106
SL: 1.03067
Bias: Short
Planning a short entry for this pair considering the current price level and tendency for a bearish drive.

XAUUSD ShortTime Frame: 4H
Symbol: XAUUSD
Entry: 1729.702
TP: 1700.869
SL: 1752.641
Bias: Short
For gold our priority is for availing a selling opportunity. The current price level is not yet strong enough to jump upward with enough momentum to drive the level to a profit area and therefore our bias remains bearish.

USDCHF ShortTime Frame: 4H
Symbol: USDCHF
Entry: 0.95068
TP: 0.93392
SL: 0.96217
Bias: Short
The trend strength of this instrument is more inclined to selling opportunity and so we need to focus on bearish side.

AUDCAD DESCENDING TRIANGLE BREAKOUTPair: AUDCAD
Timeframe: 1H , 4H
Analysis: Round number level, trend line, volume profile, support and resistance, descending triangle pattern
—————
Key Takeaway: Alot of bullish momentum for AUD as it is altogether, we are at a critical level of reaction at the moment by the top of our descending triangle. We are looking for a close above this level on the 4H chart, a re-test would also give us the perfect confirmation we need to enter long
—————
Level needed: need a close by 0.89635
—————
Trade: Long
RISK:REWARD 1:9
—————
DO NOT ENTER OUR SETUPS WITHOUT CONFIRMATION

JPYUSD NeutralTime Frame: 4H
Symbol: JPYUSD
Bias: Neutral
We do not have any strong bias here. We stay therefore neutral.
