EURUSD LongTime Frame: 4H
Symbol: EURUSD
Entry: 1.01545
TP: 1.02956
SL: 1.00500
Bias: Long
Our plan is to run for a long opportunity from the current price context.
Harmonictraders

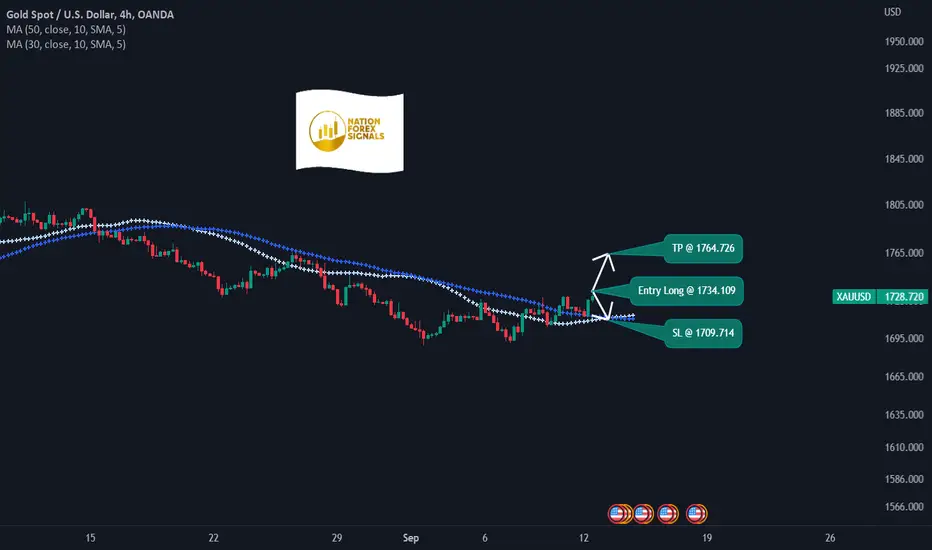
XAUUSD LongTime Frame: 4H
Symbol: XAUUSD
Entry: 1734.109
TP: 1764.726
SL: 1709.714
Bias: Long
We plan a buy trade for this pair . We think the current bullish bias will sustain and result in a long opportunity.
USDCHF ShortTime Frame: 4H
Symbol: USDCHF
Entry: 0.95344
TP: 0.93649
SL: 0.96505
Bias: Short
The core trend structure of this instrument is insinuating a strong bearish bias and therefore we are searching after a selling opportunity.

BTC 19.8k -> 21k+ -> back down to 20kJust used lower timeframe bearish harmonics mixed with higher timeframe fibonacci crossovers and noticed a pathway higher timeframes are VERY likely to go:
19,800 -> Between 21k and 21.5k
Between 21k and 21.5k -> 20k
Laddering shorts at 21k and 21.2k after closing LONG and expecting a max of 21.5k
then after we will see but probably up after that. 20k should hold

20,740 next wave down5 minute harmonic trade here - expecting a drop to 2.618 to 20740 before a small bounce
1.618 of XA meets 2.236 of BD

BTC LONG 20.1k -> 21.5kI'm seeing a lot of 0.5 / 0.886 symmetry in this market currently. I will be buying 20.1k with a target of the 0.886 retracement 21.5k and then opening a short to TP around the 20.1k level again.
From there, we will see. But essentially, price is VERY likely to hold 20k for a while, with probably only a quick break below for liquidity until the mid 22's.
Of course, this is all a scam, but I think we will see up movements for the next 1-3 weeks.

DOT.... JUICE!Dot, looking extremely good here. Followed through price action when she smashed through that demand line and is now looking to claim a new crucial support. DOT is one of the best looking charts atm pertaining to crypto. Scott Carney's mouth would be watering looking at this... REPSECT THE TA

shark harmonic on luncwe got a bearish dragon with a confirmation break at the blue color line, a BAMM (bad action magnet move) confirmation break at the green line, all withing a bullish shark harmonic. If those line break we will be going to the D leg of the harmonic. Target 88.6 to 1.13% retrace

JPYUSD NeutralTime Frame: 4H
Symbol: JPYUSD
Bias: Neutral
We are neutral for this pair. We do not see any strong directional bias.

GBPUSD ShortTime Frame: 4H
Symbol: GBPUSD
Entry: 1.15823
TP: 1.13824
SL: 1.17287
Bias: Short
A selling opportunity is more feasible than other options considering the current market sentiment.

EURUSD ShortTime Frame: 4H
Symbol: EURUSD
Entry: 1.00471
TP: 0.99187
SL: 1.01421
Bias: Short
We are looking for a selling opportunity from the current price context.

XAUUSD ShortTime Frame: 4H
Symbol: XAUUSD
Entry: 1720.331
TP: 1693.043
SL: 1737.185
Bias: Short
We are bearish for this pair. A selling opportunity awaits.

USDCHF LongTime Frame: 4H
Symbol: USDCHF
Entry: 0.96016
TP: 0.98032
SL: 0.94696
Bias: Long
The chart displays a bullish bias. After a bearish move there will be a correction move as there is no strong market moving sentiment prevalent for the time being.

CADJPY Longterm BUYsimply buy for longterm. no need of any second thoughts, if possible buy on everydip and accumulate asmap. and thankme later in 2-3years, the risk reward is aslo very good 1:2.

ENJUSDTIn a period of several months, we will see a further fall in the price in the form of wave 5
Just a personal analysis and opinion that can easily be wrong

$GSAT | Bearish Butterfly HarmonicGSAT has formed a bearish butterfly harmonic -> going short here
Highly likely it will go to 618 retracement -> ~40-50% downside

Bearish Shark Pattern (USDCHF)Beautiful formation of shark pattern respecting 0.886% of XC and
2.24% of BC. Entry is perfect as it forms an inverted hammer at Daily TF.
TP 1 and TP 2 are setup @0.38% and @ 50% of CD respectively. It will then
follow a 5-0 pattern opening a bullish entry at the 50% fib level.

Bullish Shark Pattern (NZDUSD)The Shark pattern is a distinct 5-point reversal structure discovered by Scott Carney in 2011. It is a retracement of 113.0% — 161.8% before reversing to the other side. The retracement of the reversal should be 161.8% and 113.0% from the beginning of the pattern.

Bearish Shark Pattern (USDSGD)Beautiful formation of shark pattern respecting 0.886% of XC and
2.24% of BC. Entry is perfect as it forms an inverted hammer at Daily TF.
TP 1 and TP 2 are setup @0.38% and @ 50% of CD respectively. It will then
follow a 5-0 pattern opening a bullish entry at the 50% fib level.

Beat the BATS - Harmonic Bat PatternsHi Traders, Investors and Speculators 📉📈
Ev here. Been trading crypto since 2017 and later got into stocks. I have 3 board exams on financial markets and studied economics from a top tier university for a year. Daytime job - Math Teacher. 👩🏫
In today's analysis, we'll look at a different way to speculate the next immediate price action of an asset : the Harmonic Bat Patterns. There is a really cool tool on the platform that you can use called the Cypher Pattern, you can find this in your drawing toolbar, 5th from the top under the T for text. It helps you plot the points and identifies the correct distance for you clearly. I'm using it HERE :
From the chart, you can clearly see the bullish and the bearish bat example. If you move your mouse over the grey anchors, you will find the values that the distances between two points need to be. Spotting these patterns are extremely difficult and it takes a trained eye to spot them on a chart. However, if you're lucky enough to spot one, you have a clear trading setup with a high probability of win rate. NOTE that even though there are similarities, these are not the same as W-bottom patterns or M-patterns.
I hope you enjoyed and found value in this educational post today!
_________________
👀 Follow us here on TradingView for daily updates and trade ideas on crypto , stocks and commodities 💎
👍Hit like & Follow 🔔
We thank you for your support !
CryptoCheck

JPYUSD NeutralTime Frame: 4H
Symbol: JPYUSD
Bias: Neutral
We do not have any directional bias for this instrument . We stay neutral.

GBPUSD ShortTime Frame: 4H
Symbol: GBPUSD
Entry: 1.15652
TP: 1.13654
SL: 1.16913
Bias: Short
The bias is set to bearish for this pair as we see the price drive is constantly dropping and the bearish pressure is always prevalent.

EURUSD ShortTime Frame: 4H
Symbol: EURUSD
Entry: 1.00288
TP: 0.99007
SL: 1.01212
Bias: Short
For this pair our bias is short. We are looking for a selling opportunity from the current context.
