DKNG - Draftkings Deep Crab Harmonic Weekly setup.DKNG - Draftkings, perfect harmonic deep crab setup with the 161% PRZ being respected and a nice bullish engulfing on the weekly to trigger entry. long with T1 @ 34.50 T2 @ 49.95 SL 9.65 RR @ T1 = 2 : 1, RR @ T2 = 3.88, SL moved to break even at T1 and half profits to be booked. weekly setup so patience required as setup will take a while to play out.
Harmonictraders
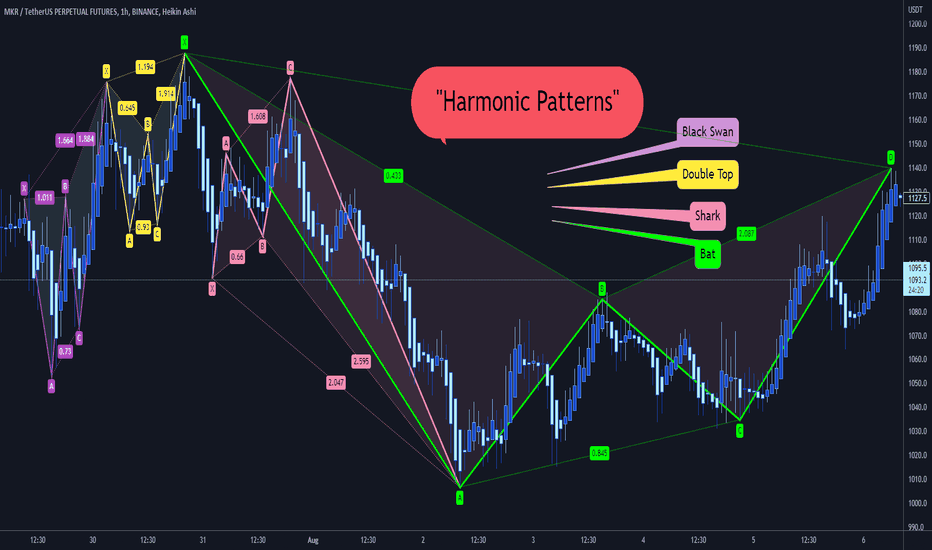
Harmonic PatternsHarmonic Patterns
we have so many kinds of “Harmonic Pattern”:
Black Swan
Bat
Crab
Butterfly
Gartly
White Swan
Shark
Zero_Five
Cypher
Double Top
Double Bottom
📚👌🏻 Each one of them has its unique Fibonacci levels.
⚡️ Do you want to know them?
😍 Happy to see what you find in the charts, please share yours with us
CHFJPY ASCENDING TRIANGLE BREAKOUT Pair: CHFJPY
Timeframe: 4H
Analysis: Round number level, trend line, volume profile, resistance, ascending triangle pattern
Key Takeaway: Need to see a break of ascending triangle and round number
—————
Level needed: Need to see price close by 139.695
—————
Trade: Long
RISK:REWARD 1:7
SL: 32
TP: 216
—————
DO NOT ENTER OUR SETUPS WITHOUT CONFIRMATION
Bullish for Malaysian Crude Palm Oil Hello there. This is what i found in the harmonic trading perspective in a close up market.
1. Bullish harmonic pattern which indicates the sign of reversal in opposite.
2. Expectation of price to do reversal in the area of RM4286-RM4577
Worst case scenario, it will move downwards up to RM3000-RM3600.
In addition, let me add up some "spices"
When the harmonic traders decided to make a decision within the extraction of reversal area. They must also decide to put their "optimal price" as their backup plan to avoid losing all of their money.
Which is im going to share with you guys of how harmonic trading could help us by making a complete decision(EP,TP,SL)
And also, always remember that the market doesn't favor with your decision as well all the time. So trade safe & control the risk.
This is just an idea for you to analyze. Please stay safe, control your capital & trade at your own risk.


