4th of July compression wedge?**Not financial advice** **DYOR** . Revised wedge formation taking into account recent "God market" dynamics. Though prepare for breakout at any time as new council members are announced.
Hashgraph

New pattern emerging? Hedera gaining real world traction** for entertainment purposes only ** ** not advice ** ** DYOR **
Following on from the last prediction, see great upward price potential as the network grows and new council members come on board.

HBAR / USDT Long Hbar/USDT Esta en un buen rango de acumulación con objetivos alcistas bastante pronunciados.
Si sumamos que la dominancia comienza a flojear y otras altcoins que estaban en figuras similares estan teniendo altos crecimientos, es cuestion de horas que estalle hacia arriba mientras que BTC se comporte.

Emergence of clear wedge structure? Possible breakout.**For entertainment purposes only**
Visible wedge-like structure. Breakout could be on the way.

Analyzing BTC trends using muli-plane grid techniqueTIP: Did you know that you can watch the price, volume and orderbooks (bids and asks) fluctuate on a bag of 10 different stable coins on our stable coin index @ vcdepth.io - This really helps to see when money is flowing in and out of the sidelines.
This chart depicts how I see trends and its applicable to almost any chart. I see an intersecting graph paper like grid with lines on different planes. Most of those lines I just copy and paste and move up or down. Here there are a total of 3 planes that provide the bulk of support and resistance for all the price action in this chart. Arguably there could be additional lighter lines on each plane in between some of the larger gaps. I tried to color each plane differently and emphasize the perceived strength of each line on its plane. Notice when price action occurs at the intersection of multiple planes, support and Resistance are usually stronger with combined support from the multiple trendlines, the more trend lines in support, the stronger the support. Furthermore I add Orange horizontal lines that depict horizontal historic support and resistance. The sharp descending channel we just broke out of appears to be a freefall and is now is trying to snap back to the grid.
From here there are 4 likely paths,
-The continuation of the sharp descending trendline, seemed the least likely, we have halted descent and broke the channel and have at least 3 planes of support with one of the other 3 paths are more probable. That said, we just broke all the supports while I was typing this, in support of this arrow. This path could see a low around $7800 as early as a week from now. This would most likely be a great entry point and the lowest we will see BTC for a long time.
-Continue along the bottom of what may become a large descending channel with an absolute low of $8000 possible mid-March. Right now this is definitely possible but it feels like one of the others may be more likely based on global order book support @ vcdepth.io
-There has been a decent amount of support and resistance sitting almost perfectly $1000 above the long term ascending trendline. This could hold and in fact could be bottom of a long term ascending channel with the top of channel sitting around $10k right now and also in a lighter red. If we are stuck in this channel we end up in the same place as the next option.
-There is a chance we take this little sub ascending channel to $9450 by mid-March where there is a large chance we will confirm this as a descending channel and likely follow it all the way down to the 5 year trend line before making its next big run to hopefully surpassing February highs with a low around $8400 mid-april.
*Note there is a chance if we drop to $8200 that we could form a nasty head and shoulders. Also watch all these lines, whichever direction we go from here, it will likely bounce between a set of these lines which can help identify entry and exit points.
This is not investment advice, do your own research!


Hashgraph - HBARUSD Idea Hashgraph like many other shitcoins is looking good to attempt a swing trade here.

HEDERA - Beyond Blockchain?!Is this the fastest one with 1 Million Transactions per Second?
Become the new Trustlayer of the new Internet Gen?

HBAR (4H)HBAR to return to 50MA, and to continue to new highs, as both 'daily' and 'weekly' candles strongly suggest.
(Updates to continue here)

Hedera Hashgraph Possible EntryPretty straight forward chart... possible 3:1 RR or maybe just a good possibility for a longer term entry setup

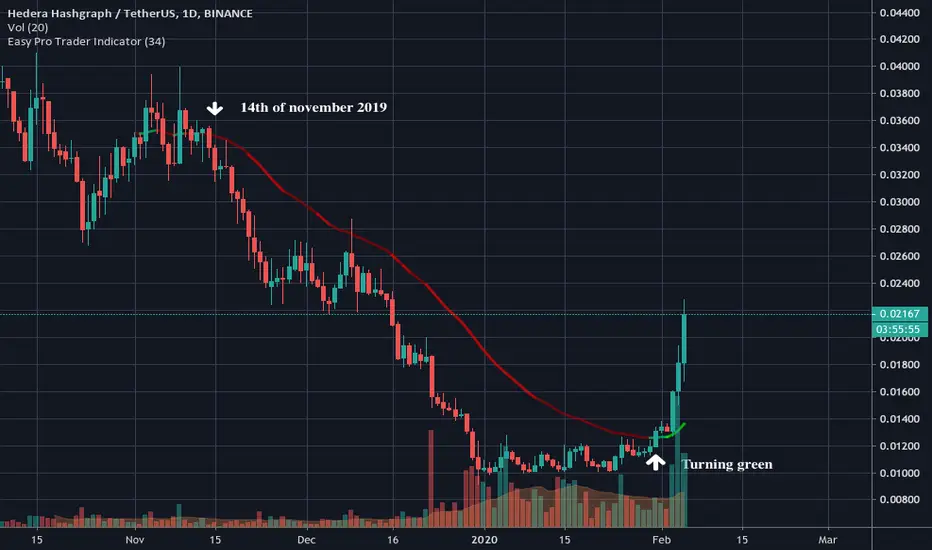
HBARHere's a quick glance at what has been going on with HBAR since the beginning.
The all-time low turned out to be just around 0.010, right at my entry point at 0.0105. People still interested in entering a position with HBAR can do so literally any time as this is going to go way higher. HBAR will imitate XRP's type of surge (without the negatives), as continued demand (and API calls) will drive its value to much higher levels. Hashgraph was recently accepted by Google for developer projects and is expected to see exponential growth within the next two years. Considering what Hashgraph delivers, you'll witness more and more investors dropping Blockchain based crypto currencies and services, for Hashgraph based currencies and services.
I'll say this again, at current levels HBAR is extremely undervalued . This is an investment that you should keep and forget about for 1-2 years. At this point it's unclear whether HBAR may revisit lower levels for those "late to the party", which is evidently not the case.
I'll keep updating this chart below as more candles will form a clearer picture in terms of direction evaluation.

Most traders are wrong.. HashGraphMost traders are wrong..
Why? Because you can't predict the future.. But you can follow the trend..
Bullish for 3rd-gen enterprise ledger tech**For entertainment purposes only**
Steady linear downward trend since launch day ($0.10 to $0.12).
Tightening price range. Bullish pressure release.
Initial target price is $0.10
Strong technology fundamentals. Strong leadership and governance. Hedera has a zero-to-one business model.

HBAR UpdateBy taking use of an old trick, we can now pinpoint HBAR's main performing formation, as 'Descending Channel'. We do that by connecting 2-point axis lines at exact 'open' and 'close' coordinates to imitate continuous performance into the future (see below). This method can be traced back to the 18th century of Japanese rice trade, where the usage of candlesticks originates from.
Step-Line 2-point axis connection for higher precision:
Moving to the fun part: expect a massive price surge once (and if ) performance has passed the 'century'-VWAP level. This makes finding the bottom even more important – which I personally believe to be around half a cent (0.005). We'll be able to determine a more precise level once the next SAR point breaks (should be any day now). We will then be able to mirror the entire SAR series' drop of -56%, from that point downward, to determine an approximate "strong oversold" area, or in other words "the bottom". This area could be strategically used to place downward incremental buy-orders. A recent buy order of some 10+ million shares @ 0.01 (roughly $100k worth) was registered, showing how quickly word is spreading about HBAR.
Key level is the intersecting level between the (blue) intermediate downward channel and the lower main channel trend-line. Breaking this level is an indication for a continuation and an exit below the channel, where bullish accumulation can begin. Take note that HBAR could produce 'wicks' as high as the 20MA or slightly below the 50MA, but performance should remain 'intermediate channel'-bound (blue).
NOTE:
Considering all the bullish facts that Hedera Hashgraph boasts, it's imperative that you understand – the implications for – and problems with – "virgin" stocks or currencies, which have just recently started trade. This analysis was made using nearly 20y of experience in chart-analysis, and still, I'd like you to take this as an "idea" only (as all TradingView posts imply). This type of trade is extremely difficult to foretell and falls under the category of "high-risk", meaning that we only know what we know. Hidden factors (if there are any) cannot be calculated into this chart. Therefor I implore you to do your own due diligence parallel to this analysis and base your potential HBAR-trades with your own confidence, not with mine. In addition: as you know, price change is famously tied to supply and demand. If demand rises out of proportion prematurely, prices could start rising outside of these technical boundaries, potentially causing you (and us all) to "miss the train".
This post will be updated continuously when mentionable changes can be observed.

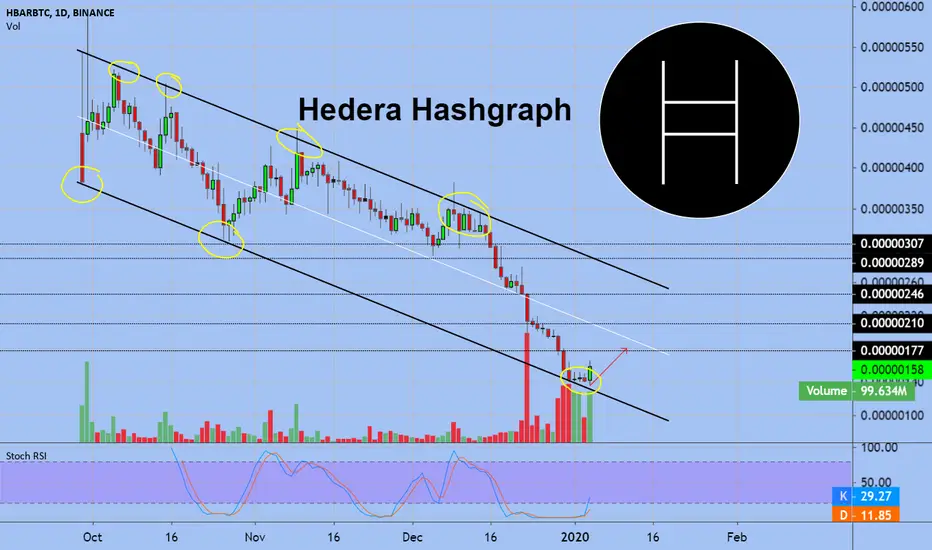
Hedera HashgraphHBARBTC moving in downtrend channel.We touched support line of this channel and I see volume is coming. We can reach midle line of this channel
Hashgraph
Before we get into the technicals, let me say this right off the bat. There is not a single doubt in my mind that Hashgraph is the future of ALL crypto currencies. It will replace the old and problem-infested system that we know today as Blockchain by finally solving the "unsolvable" Byzantine General's Problem (ultimately solved by Dr. Neemon Baird ). It solves scalability, security, speed, fairness (order of transactions), and especially sustainability, just to name a few out of so many.
Blockchain currently requires 5% of global energy usage! Let that sink in for a minute. If we were to replace the entire monetary system to Blockchain, it would require us to use twice as much energy as the entire world is currently using – completely unsustainable. In addition, Blockchain will soon reach a dead-end due to its coins running out and it's miners ultimately choosing to exit the market. It will become more and more difficult to mine, as requirements for more energy versus less return simply won't remain attractive. It will lead miners to select (which is already unfair practice) only high-fee blocks resulting in much longer transaction times (days!) leading to price shifts and so on and so forth.
Back in the day when the birth of the blockchain method was absolutely amazing compared to the corrupted FIAT currency system, it came to us already highly flawed . Major banks and institutions have now discovered Hashgraph and accepted its superiority over Blockchain as factual and mathematically proven. It's just a matter of time until the general public is made aware of the real implications for Blockchain , and why Hashgraph is to replace it sooner or later.
To find out more about how it works, simply look up YouTube for " hashgraph explained ". I found the simplest explanation to be by Mike Maloney (search for " From Bitcoin To Hedera Hashgraph Documentary " and skip to 4:12). I highly suggest to watch through all of Mike Maloney's 10 episodes about the financial systems to get a good idea of where we're headed. The content in his documentary is common knowledge today, but the explanation is made easily digestible for the average Joe.
TECHNICALS:
Hashgraph is brand new and has just started to trade this past September on the BITTREX exchange as HBAR (Hedera Hashgraph). Given the situation where a large sell-off occurs followed by a consolidation in a closing descending wedge (and exit below), HBAR could now slip down further towards 0.016 (technical low using the 1/3 rule), compensating for the sheer "falling force" of the sell-off. At the same time, keep in mind that growing public knowledge about HBAR could spark a premature rally without arriving at the proposed low.
Now, at such a young age (chart) I recommend using step-line only, and disregard the highs and lows of candles. Step-line is showing a possible miniature head-n-shoulder formation (still in the making) that could propel HBAR above the upper trend-line. Watch out for a large net-volume spike, at least double the size of the current largest one, as it will signal the trend change. Also keep an eye on RSI hovering below the mid-line (50). Breaking the upper dashed line (blue) could as well signal the trend change. I personally believe that we can expect the bottom to be between Now and February 2020, so this post could be right on time.
Once the resistances are out of the way, HBAR could quickly see price levels well above $1 and theoretically can mimic other past crypto rallies to far higher levels. Only this time it's a legit ever surviving system which will offer the fastest, most secure and sustainable transaction system in the world. Not just monetary! Any information sent across the internet using Hashgraph would arrive "untempered with" since there is always a consensus reached.
STEP-LINE
New stocks are the hardest to analyze since they offer the least information of trading psychology. So bear with me on this one, I'm here to help and I will keep updating this post along the way. Lines and connections have been averaged on step-line over log for higher precision. PM me for questions.


Consistent week-long down-trend. Be ready for the first up-legOpinion: consistent downtrend since launch.
Approaching price floor. Volume strengthening.
Up-leg must be accompanied by volume.
Expectation that macro crypto conditions will have minimal impact on HBAR price. Hedera generation 3 DLT underpinned by sound technology fundamentals.
