HBARUSD Short-term buy opportunityHedera (HBARUSD) is having a 3-day 1D candle bullish streak for the first time since the August 15 High. Considering the completion of a Bullish Cross on the 1D MACD and the fact that the 0.04555 level (Support 1) held, we treat this as a similar buy signal with March 16.
That fractal rose up to the 0.5 Fibonacci retracement level. That is our short-term target (0.06050) towards the end of the month.
-------------------------------------------------------------------------------
** Please LIKE 👍, FOLLOW ✅, SHARE 🙌 and COMMENT ✍ if you enjoy this idea! Also share your ideas and charts in the comments section below! **
-------------------------------------------------------------------------------
💸💸💸💸💸💸
👇 👇 👇 👇 👇 👇
Hbar

HBAR TECHINCAL ANALYSISThis chart is solely based on cyclical events.
Hbar is now back to critical accumulation levels from 2020.
RSI is extremely oversold on the weekly.
An early fed pivot could invalidate this analysis.
BTC halving: Apr 29, 2024

HBAR/USDT bullish MOVE!! 👀 Hedera Hashgraph Today Analysis💎 HBARUSDT is primed for a bullish trajectory, as it's maintaining a strong hold above the EMA 21, setting a bullish tone.
💎 Another factor bolstering the bullish outlook is the presence of a Demand Zone, which is expected to further fuel the upward move. Above this demand zone, we have a Bullish OB confirmed on a smaller timeframe, and the price is expected to retest this level.
💎 At the supply zone, there's an unmitigated OB. The price could potentially rise all the way up to mitigate this level before deciding on the next move.
💎 However, if the price enters the invalidation zone and breaks below it, we could see a downward move.
💎In the dynamic world of crypto, staying informed and adaptable is key. Stay tuned for more updates and enjoy your trading journey

Inverted HS Targets ~11-13.5 centsHedera Hashgraph daily chart may be forming an inverted HS here targeting at least 10-11 cents, and possible 13.5 or so.
This idea lines up with other longer-term charts published, which also target 10-11 cents and expect a move back into weekly resistance should that level hold up.
See related ideas in the links below.

HBAR 2-day: Head and Shoulders vibes, gotta wash it clean.HBAR 2-day Picture:
Fisher hooking up from -2.77 level. A preference would be around -3.5 ~ -4.0, but we'll take it.
Buy TD9 just printed.
Let's observe what happens closer to/inside the cloud.
The cloud aligns perfectly with the bear market support band.
Getting Head and Shoulders vibes, might need a thorough analysis.
I like my HBAR ISO 20022 big partnerships coin ;)
EXMO Study - Patience Is Key (PIK) team bringing you that peace of mind and perspective :)

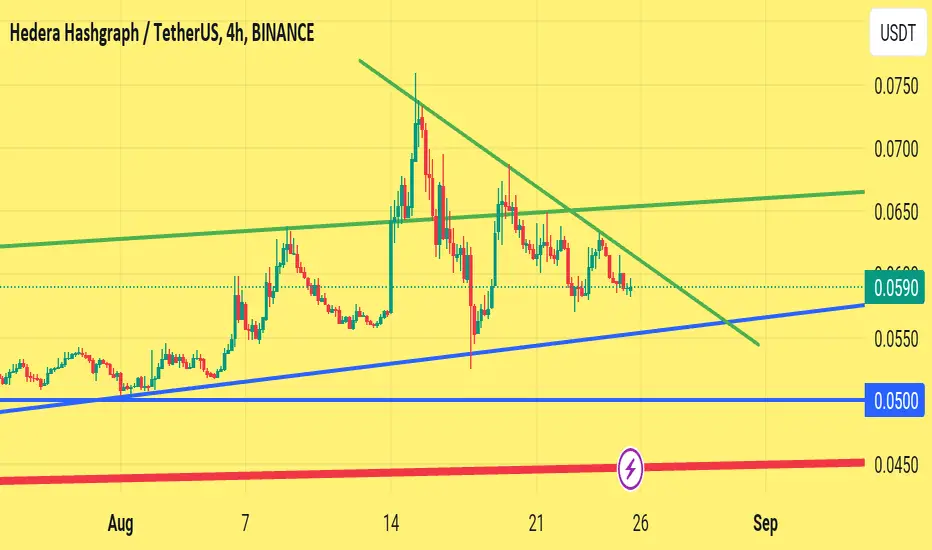
9-hr HBAR: Short-Term Base Formation and Fib Potential
Overview (9hr Timeframe):
HBAR forming a short-term base.
Breakout and retest of the descending trend line.
Fisher crossing the zero line.
RSI holding and gaining strength.
9hr Timeframe:
HBAR Short-term Base: HBAR is currently consolidating, indicating a potential upward movement.
Breakout Confirmation: We've seen a breakout and successful retest of the descending trend line from Aug 15, marked at 0.075.
Fisher Indicator: The Fisher indicator crossing the zero line is a positive sign.
RSI Strength: The RSI has held its ground, undergoing a retest and showing signs of gaining strength.
Fibonacci Analysis:
Possible Bounce Levels: We could see a Fibonacci bounce up to the 0.236 level, followed by a potential rejection, and a further upward move to around 0.382, which would be approximately at 0.058~0.059.
Challenge at 0.236 Fib: It's important to note that the 0.236 Fibonacci level presents a significant challenge, coinciding with the bear market support band.
Ichimoku Cloud: This positive scenario aligns with an edge-to-edge Ichimoku cloud move.
Key Consideration:
Volume Indicator: Keep a close eye on the volume. A sudden spike in volume could be a critical factor determining the outcome.
Please compare this chart with our next post on the 2-day chart.
PIK - Patience Is Key Analyst Team - EXMO Study

HBAR short As Bitcoin goes lower alt coins will make new lows. HBAR broke a support at 0.056 and retested now the downwards is likely to continue until the next support area at 0.042

🔥 HBAR Waiting For THIS Perfect EntryHBAR has been trading inside a bullish channel for over a year at this point. This trade assumes that the channel pattern will continue to play out in the future.
I'm waiting for more bearishness for this token. Ideally, we're going to move down towards the bottom support of the pattern. Placing an entry at the support, SL below the June lows with a target at the top resistance will result in a very good R/R trade. Patience is key here.

HBAR: Big Guy PlayThe last idea for today, will not write a long read and will keep it short instead.
With BINANCE:HBARUSDT we're moving inside the long shallow uptrend, then formed the triangle with the descending wedge inside, which guided us to the lower zone of this long uptrend. We're not having other chance than to get some new liquidity in and break out of the wedge for probably the last leg of this uptrend before coming down into the possible autumn correction.
What else adds confidence to these words? I just LOVE how this Big Guy indicator plays out on HBAR showing the good moves everytime after the zones with big guys walking in. And we've just had another one pop up.
We're currently AT the resistance zone and we might either break out right about now, or will test out the liquidity zone again within next few hours and pump!
Consider short Stop Loss below the yellow trendline, or the longer one below the previous higher low.
Have a good buy in and a calm night
👁️ A.I.Vision

Hbar Decision time #Hbar is in higher high higher low trend. This trend will break if Hbar breaks the red trendline and price will go down to black lines.
If Hbar breake green trendline then it will pump again.
High chance for red trendline breakdown.

Hbar Decision time#Hbar, if it breaks any green trendline then it pump.
If it breaks any blue trendline then it will dump because a trend of higher high higher low will breakdown.
Decision time is coming soon.
HBAR setting up for a huge move north.HBAR has been playing the rollercoaster game lately - up, down, up, down, up, down.. ect. If the current momentum continues I fully expect HBAR to break out of the descending wedge pattern to the upside in the coming days.

🚀📈 HBARUSDT Analysis - Bullish Momentum Detected! 📈🚀🚀📈 HBARUSDT Analysis - Bullish Momentum Detected! 📈🚀
🔔 Timeframe: H4
🐂 Trend: BULLISH
🎯 Key Levels:
- Resistance: 🚫🔝
- Support: 🛡️🔻
📊 Technical Indicators:
- Indument Close: 📈✅
- Confirmation Level: 🚀🔐
🧠 Smart Money Insights:
📌 Smart money concept indicates a strong bullish sentiment. 🐃💰
💡 Keep an eye on significant volume spikes and price action for potential entry signals.
🚀 Trade Strategy:
📋 Wait for the indument close above the resistance for confirmation.
⏰ Time your entry with precision to maximize gains.
🎯 Target the next resistance level for potential profits.
🛑 Risk Management:
🛡️ Set a stop-loss to protect your capital.
💰 Trade with an amount you're comfortable with losing.
Remember, trading carries risks. This analysis is not financial advice. Do your own research and stay updated on market trends. Happy Trading! 📈🤑📊

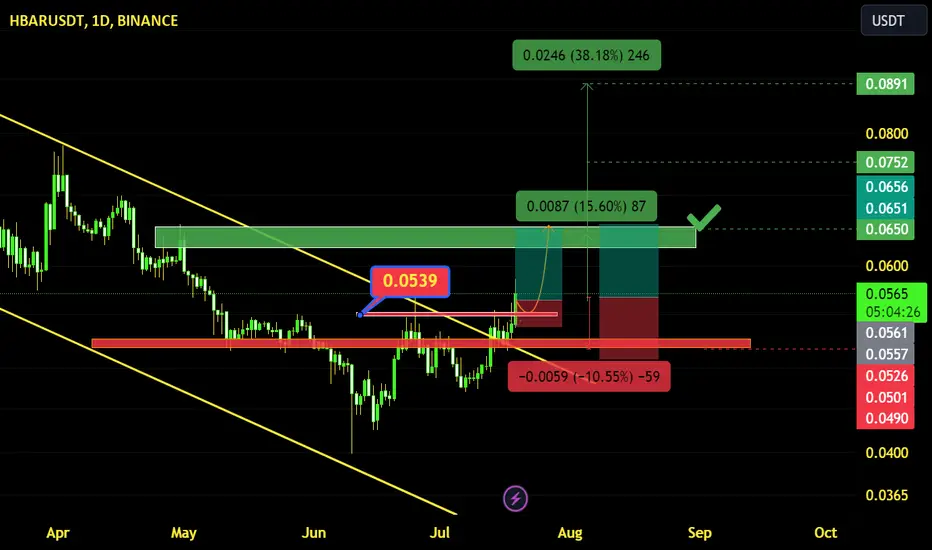
Cup n' HandleUnconfirmed cup n' handle pattern on the 1h chart for BINANCE:HBARBTC
What is confirmed?
- We have a cup
- We have a handle
- We broke above the handle and have held above it
- We've held above highs near the early formation of the left side of the cup
What's required to complete confirmation?
- Break and hold above the red line at 256 (252 was the highest close on the left side)
Target?
- 320 sats as an aggressive first target is displayed on the chart
- aggressive because it's measured from the cup shape and its wick lows rather than the candle close lows to cup top
- A more conservative target would be around 300, which may also act as a psychological resistance
My nice graphic got messed up when posting, so here it is again:
Notes:
- I also prefer to see it remain above 233, and it needs to get back above 246
- Links to related higher timeframe ideas for HBAR are linked below
- Cup top is the top of a current resistance area as seen on this other chart

HBAR/USDT Continue to Bullish Movement ?? Hedera HashHello Paradisers, One to Keep on Your Radar!
💎 HBAR continues to exhibit an upward trajectory, maintaining its position above the bullish trendline, which is a positive indicator.
💎Currently, HBAR is undergoing a retest in the demand zone, with the likelihood of resuming its ascent to challenge the resistance of the triangle pattern. Given the current market conditions, there's a good chance HBAR could break through this pattern to establish a new higher high.
💎The bullish outlook would be invalidated if HBAR closes below the resistance trendline and the green line.

HBAR is stable in support zoneHBAR hashgraph currency analysis
In this analysis, the important support areas namely 0.055, 0.051 and 0.046 were determined and we have different reactions on each of them.
In the first support zone, it is possible to return to the resistance of 0.062, but in the second zone, 0.051 Yen, this zone is probably not very valid and will break, but it is one of the important zones that has been able to turn the trend upwards three times in the past, and also in the third zone. Support means 0.046, which can be very important, so keep it in mind.
On the other hand, for the resistance areas, the first area that we mentioned is 0.0652 and the next area is at 0.068, where the price can even be at the level of a pullback (if the trend is completely upward) and we can consider correction from these areas.

HBAR long term holdThis is a longer term hold for me, I like how HBAR has been reacting to the latest crypto slide, an old cross on the weekly MACD is holding up well and RSI is showing strength on the larger time frames.

HBARUSDTBINANCE:HBARUSDT SHORT IDEA
⚠️Note:
In this type of signals, only the entry point and trade direction are specified, and stop loss and target are not determined.
If you are interested in entering these signals, please provide a stop loss and a logical market-based target.
⛔"Daily crypto market analyses I provide are personal opinions & not financial advice. Trading carries risks, so do your own research & seek advisor's help.#DYOR"
Don't forget to like and comment

🪜CLIMB THE LADDER OF HEAVEN WITH HBAR 🪜HBAR is looking to move to .06329 USD for a new local high
There are some importan Fib levels in this area from the trip down
It look like some trend lines that were holding us down have also been peirced
HABR is Jacobs Ladder
The Hash is THE Ladder
Use your Hedera and Have the Heavens
🪜CLIMB THE LADDER OF HEAVEN WITH HBAR 🪜

This currency is a bird! Learn to flyAfter exiting its downward channel, HBAR currency can be said to have formed a corner pattern, so there is a possibility of growth of up to 62% for this currency.
Two support ranges have been specified for this currency, one range is for daily time and the other is for 4-hour time.
Safe entry for this currency is after breaking the green range

Whether it can rise above 0.0731 is the keyHello?
Traders, welcome.
If you "Follow", you can always get new information quickly.
Please also click "Boost".
Have a good day.
-------------------------------------
(HBARUSDT 1M Chart)
The question is whether it can rise above 0.0731.
(1W chart)
If price holds above 0.0731, it will enter a sharp volatility zone with few support and resistance zones.
Therefore, the key is whether it can receive support around 0.0613 and rise.
(1D chart)
Whatever the picture, the full-fledged rise is expected to begin when it rises above 0.1037.
Therefore, it is important to check the support around 0.0613-0.0731.
-------------------------------------------------- -------------------------------------------
** All descriptions are for reference only and do not guarantee profit or loss in investment.
** The trading volume indicator is displayed as a candle body based on 10EMA.
Display method (in order of boldest)
More than 3x 10EMA trading volume > 2.5x > 2.0x > 1.25x > trading volume below 10EMA
** Even if you know other people's know-how, it takes a considerable period of time to make it your own.
** This is a chart created with my know-how.
---------------------------------

HBAR: Rising Wedge BreakoutHedera Hashgraph (HBAR) technical analysis:
Trade setup : Breakout from a Rising Wedge pattern and in an Uptrend. Notably higher volumes on up days recently, which is also positive. Upside to $0.08 resistance or even $0.10.
Trend : Uptrend on Short- and Medium-Term basis and Neutral on Long-Term basis.
Momentum is Bullish (MACD Line is above MACD Signal Line and RSI is above 55).
Support and Resistance : Nearest Support Zone is $0.050 (previous resistance), then $0.035. The nearest Resistance Zone is $0.060, which it broke, then $0.080 and $0.100.
