HBAR to $1.00If price breaks between the 50%-61.8% retracement I'm looking for a long position to $1.00.
Hbar

HBAR movingHBAR broke resistance and previous high
we might see a pullback before a continuation to the upside
if stopped out ... then look for re-entry on the 4hr break
of the newly created high ( not created yet )

HBARUSDT 4D AnalysisHBAR ~ 4D Analysis
#HBAR This is the closest support for now. Buy if you still have faith in this coin with a short term target of at least 15%+ from here.

HBARUSD: Final rally starting.Hedera is repeating the peak formation of the previous Cycle. Being bearish, almost oversold on its 1D technical outlook (RSI = 35.527, MACD = -0.005, ADX = 29.745) while being supported by its 1W MA50, makes it a buy opportunity again. We turn bullish, targeting the R1 level (TP = 0.39000).
## If you like our free content follow our profile to get more daily ideas. ##
## Comments and likes are greatly appreciated. ##

A Colossal Rally Scenario for HBAR to $1,966HBAR is the utility and security token of the Hedera network, a high-performance distributed ledger that aims to be a faster, fairer, and more secure alternative to traditional blockchains, specifically designed to meet the needs of mainstream and enterprise-level applications.
Chart Pattern Analysis
Major Pattern: Descending Triangle
The most significant pattern on this monthly chart is a large descending triangle that has been forming since late 2021.
The upper boundary is a descending trendline connecting the lower highs.
The lower boundary is a strong horizontal support line around the $0.042 level, which was tested and held multiple times throughout 2023.
Bullish Breakout and Retest
In early 2025 (according to the chart's timeline), the price has decisively broken out of the top of this descending triangle. A breakout from such a long-term consolidation pattern is typically a very strong bullish signal.
Following the breakout, the price seems to be performing a retest. It has come back down to touch the former resistance trendline, which is now acting as new support. This is a classic technical move that confirms the strength of the breakout.
Candlestick Analysis
The breakout candle is a strong, full-bodied green candle, indicating significant buying pressure and conviction behind the move.
The most recent candles are consolidating above the breakout level, holding the new support. This suggests that buyers are absorbing any selling pressure and preparing for the next move higher.
Price Prediction
Based on this technical setup, the outlook for HBAR is bullish.
Short-Term to Medium-Term: After successfully holding the retest of the broken trendline, the price is poised to continue its upward trend. The first major target would be the previous all-time high from 2021 (around $0.57).
Long-Term Projection: The analyst who created the chart has plotted a very ambitious long-term target at $1,966.87643. This is likely a calculated "measured move" of the triangle pattern, projected upwards from the breakout point. While the pattern itself is very bullish, this specific target is extremely optimistic and would represent a massive, multi-year bull run.
Summary
The chart suggests that HBAR has completed a long bearish/consolidation phase and has begun a new major uptrend. The breakout from the multi-year descending triangle, confirmed by a successful retest, is a powerful signal for future price appreciation.
The price is expected to go up. The immediate trajectory is likely continued upward movement, with key historical resistance levels as initial targets. The extremely high long-term target should be viewed as a highly speculative, best-case scenario.
Key Levels to Watch:
Support: The descending trendline (currently around 0.12−0.15) and the horizontal support at $0.11705.
Invalidation Point: A decisive drop back below the major support level at $0.04207 would invalidate this bullish thesis.

HBAR needs to set a foundation and a CHOCH would be greatHBAR fell through a large volume gap. Momentum remains in a downtrend, and the structure is not yet mature. A proper CHOCH would make things bullish, especially in oversold conditions.
Full TA: Link in the BIO

Technical Analysis – HBAR/USDT + TRADE PLANTechnical Analysis – HBAR/USDT (Daily Chart as of June 4, 2025)
Chart Pattern: Falling Wedge (Bullish)
The chart indicates a classic falling wedge pattern, often interpreted as a bullish reversal signal.
This pattern is marked by descending converging trendlines, suggesting declining volatility and potential breakout.
Breakout point is illustrated just above the wedge’s resistance line, with a bullish breakout expected.
Key Support & Resistance Levels
Immediate Support Zone: $0.1625 – $0.1723 (blue zone)
Primary Resistance Targets:
Short-term: $0.1849 (top of Bollinger Band)
Mid-term: $0.2070 – $0.2200
Long-term: $0.3400 (strong historical resistance)
Indicators Summary
Bollinger Bands: Price near the lower band, indicating potential upside volatility.
Volume Profile: Slightly increasing near wedge apex, often a precursor to a breakout.
VMC Cipher_B: Multiple green dots signal bullish divergence; momentum may be reversing upward.
RSI (14): Currently recovering from oversold territory (~39.5), suggesting bullish momentum building.
Money Flow Index (ArTy): Moving back into the green, indicating capital inflow and potential accumulation.
Stochastic RSI: Crossed upward from oversold zone (currently ~23), a common signal for trend reversal.
Trading Plan
Long Position Setup (Swing Trade)
Entry Zone:
$0.1650 – $0.1725 (upon retest of breakout from wedge or candle close above wedge resistance)
Stop-Loss:
$0.1580 (below wedge support and key structure low)
Take-Profit Targets:
TP1: $0.1850 (Bollinger Band and resistance zone)
TP2: $0.2070 (resistance from March 2025)
TP3: $0.2200 – $0.2400 (target zone for full wedge breakout)
TP4: $0.3400 (macro-level resistance, if rally continues)
Risk-to-Reward:
Minimum R:R of 1:2.5 to 1:5 depending on TP level.
⚠️ Risk Management & Strategy Notes
Wait for confirmation breakout candle with strong volume above wedge resistance before entering.
Scale in gradually between $0.1650–$0.1725 if confirmed.
Trail stop-loss after reaching TP1 to lock in profits.
Monitor Bitcoin price trend and overall market sentiment—HBAR tends to follow macro market structure.
The combination of the falling wedge, bullish divergence, and oversold momentum indicators supports a strong potential for bullish continuation. However, conservative confirmation is essential before committing capital.
Outlook: Bullish bias, pending confirmation breakout above the wedge resistance.

HBAR (Local) Elliot Wave ii UnderwayHBAR appears to have completed a leading diagonal for wave 1 after finding a bottom at the major support high volume node (HVN).
Wave 2 has retraced the expected 61.8% Fibonacci but alt coins have their own Golden Pocket at the 78.6% retracement which aligns with the S1 pivot and high volume node.
The descending resistance line has been tested as support leaving a doji but does not look strong enough to be the bottom yet.
Wave 3 should be a powerful move up.
This analysis is invalidated below macro wave 4 -$0.12556
Safe trading


HBAR Short Wait for Good EntryLike & Follow me for more details
HBAR Short,
BTC will break upward trend soon.
Will reach 103k

HBAR Masterclass: Fib Precision + ConfluenceHBAR has been a dream to chart lately — beautifully technical, clean reactions, and a strong respect for structure. When a chart follows fibs this precisely, charting becomes fun — like solving a puzzle that pays. You stop forcing trades and start enjoying the process.
Let’s break down where the next high-probability trade setup lies — and why.
Elliott Wave Context
HBAR recently completed a 5-wave impulse structure and is now unfolding a ABC correction:
✅ Wave A: Broke below Wave 4's low
✅ Wave B: Rejected cleanly at the 0.618 retracement of Wave A
🔄 Wave C: Currently unfolding, with price structure hinting at a Head & Shoulders forming to the downside
Interestingly, HBAR has been bouncing between golden ratios like a Fibonacci pinball machine. — reinforcing how well this asset respects technical structure.
🟢 Long Opportunity: The Golden Pocket Zone
By pulling Fibonacci retracement from the entire 5-wave leg (from $0.16941 to $0.22885), we uncover the golden pocket:
0.618 Fib → $0.19212
0.666 Fib → $0.18926
But what really strengthens this zone is the confluence:
📍 21-Day EMA → $0.19361
📍 21-Day SMA → $0.19229
📍 Anchored VWAP from the $0.15396 low → ~$0.19135
📍 4/1 Gann Fan support (if reached between May 15–17)
Together, they form a tight support band between:
🎯 $0.195 – $0.18926
📐 How We Projected the 1.618 Target
Here’s where the magic of planning comes in.
If Wave C finishes within this golden pocket, we can anticipate the next move by applying a trend-based Fibonacci extension. This gives us a realistic projection for the next impulsive move:
📈 1.618 extension lands at → $0.28654
This level also aligns with the yearly level and previous key high — forming an ideal final target
📘 Educational Insight: Why Golden Pockets Matter
In trading, the “golden pocket” — the 0.618-0.666 Fibonacci retracement zone — is often where high-probability reversals take place. It’s a zone where buyers (or sellers) return with conviction after a correction. When this area also aligns with EMAs, anchored VWAPs, Gann levels etc. and previous structure, it becomes more than just a level — it becomes a decision zone.
This is where confluence transforms a trade idea into a trade setup.
🟢 Long Trade Setup:
Entry: Laddered between $0.195 – $0.18926
Stop-Loss: Below $0.185
Take-Profit: $0.28654
R:R: ~10:1
Potential Gain: ~+50%
🔴 Short Setup (If Rejected at Extension):
If price hits $0.28654 and shows exhaustion or bearish reversal patterns (SFP, engulfing candle, volume spike), a short could be considered:
Entry: ~$0.286
Stop-Loss: $0.2967 (better above $0.3)
Target: $0.2622
R:R: ~2:1
HBAR is giving us a textbook case of structure, rhythm, and precision. Whether it’s the golden pocket, the 1.618 extension, or the alignment of multiple tools — this is how clean setups are built.
Set your alerts. Trust the plan. Let the chart come to you.
In trading, silence is a skill — knowing when not to act is as powerful as knowing when to strike.
____________________________________
If you found this helpful, leave a like and comment below! Got requests for the next technical analysis? Let me know.

HEDERA Not high hopes. Upside is limited.Hedera / HBARUSD is on a 1week MA50 rebound with the 1week MACD close to a Bullish Cross formation.
This is the very same pattern it followed near the end of the previous Cycle on the June 21st 2021 rebound.
See the identical 1week MACD patterns, even the similar price structure on the 2020 and 2024 Bull Flags that initiated parabolic rallies.
Actually HBAR topped 2 weeks after the 1week MACD formed the Bullish Cross. The Bearish Divergence there was evident.
As a result, since the previous Cycle topped on the 1.236 Fibonacci extension, we expect HBAR to rise to 0.5000 max. Nothing like the parabolic rally it had after the recent U.S. elections.
Follow us, like the idea and leave a comment below!!

Master HBAR with Fibonacci: The Golden Pocket BlueprintSince topping out at $0.20151, HBAR has spent the last nine days in a corrective pullback. Digging into a rich confluence of supports that offers a long trade setup. Here’s how to spot the high‑probability entries, manage your risk, and scale out for maximum reward.
Current Context
Two days ago, price was firmly rejected at the weekly open ($0.19029) right alongside the anchored VWAP drawn from the $0.28781 swing high.
HBAR now trades below the monthly open ($0.18210), the weekly open ($0.19029), and the daily open ($0.18024), sitting at about $0.177.
Just beneath today’s level lies the swing low at $0.17543. Breaching this could flush out stops before any meaningful bounce.
The Golden Support Zone
All signals converge between $0.170 and $0.1725:
The anchored VWAP from the $0.12488 low sits at around $0.17.
The 0.618 fib retracement of the $0.15396→$0.20239 move falls at $0.17246. Just under the swing low where the liquidity lies.
The secondary 0.666 fib retracement lands at $0.17014, reinforcing that floor.
Volume‑profile analysis of the past 27 days pins its Point of Control right at $0.17, great confluence with the anchored VWAP.
This “golden pocket” is your pivot for a low‑risk, high‑probability long.
Long Trade Setup
Ladder buy orders between the swing low ($0.17543) and the 0.666 fib at $0.17014.
Aim to average in around $0.1725.
Place a single stop‑loss just below $0.17
Scaling Your Exits
First Partial Exit at the monthly open ($0.18210). This offers roughly a 2:1 R:R.
Second Exit Zone around the weekly open and VWAP resistance (~$0.19) for about a 3:1 R:R.
Final Target at the 0.618 fib retracement of the entire down‑wave (from $0.28781 to $0.12488) near $0.2256. An astounding 10:1 payoff for the patient trader.
Keep in mind a potential false‑break (SFP) at $0.17543: if price briefly dips below then snaps back up, with increased volume.
Short Trade Setup
For traders looking to play the downside from the “golden pocket” flip, here’s a clear short strategy:
Entry Zone: Ladder short entries between the 0.618 fib at $0.22557 and the 0.666 fib at $0.23339.
Confluence: The 0.666 level aligns perfectly with the negative 0.618 fib from the prior swing, creating a resistance zone.
Stop‑Loss: Place your stop just above $0.23339, invalidating the confluence.
Take‑Profit: Target a return to around $0.206, where you can lock in gains as HBAR retests its previous high.
By scaling into shorts across that fib band, you balance your risk and capture the high‑odds reversal offered by stacked Fibonacci confluence. Let the golden pocket guide both your longs and shorts!
Key Takeaways
Confluence is king: VWAPs, Fibonacci retracements, Liquidity and volume‑profile all align in the $0.170–$0.175 zone.
Risk control: One stop‑loss under $0.17 protects the entire laddered entry.
Tiered targets: Small wins at $0.182, larger as you clear $0.19, and a big payoff if HBAR rallies toward $0.225. Trail your SL accordingly.
Patience pays: Wait for price to enter the golden pocket, avoid chasing!
With these confluences lining up and clear levels to work from, HBAR’s next high‑probability long setup is staring you in the face. Trade smart, size appropriately, and let the market reward your discipline.
Happy Trading!
___________________________________
If you found this helpful, leave a like and comment below! Got requests for the next technical analysis? Let me know.

HBARUSDT: Critical Zone Alert! HBARUSDT: Critical Zone Alert! 🚨
Folks, the blue box on HBARUSDT is a key area —absolutely critical from multiple angles. This zone could deliver some strong reactions, but let me remind you, this is a 1-hour chart . Don’t go in expecting massive percentage moves; instead, focus on disciplined, calculated entries.
Why the Blue Box Matters:
High-Precision Level: Carefully chosen using advanced tools—CDV, liquidity heatmaps, volume profiles, and volume footprints.
High Probability Area: A spot where buyers have historically stepped in.
Smart Trading Opportunity: If conditions align, this could be a strong setup for tactical traders.
Pro Tip: Set your alarms for this zone—it’s worth your attention, but always manage your expectations and risks carefully.
Want to trade smarter? DM me to learn how I use CDV, liquidity heatmaps, volume profiles, and volume footprints to find these precise zones.
If you find this helpful, don’t forget to boost, comment, and follow! Let’s elevate your trading game together. 🌟
Let me tell you, folks, this is amazing. Nobody does analysis like I do. Believe me. If this helps you, don't forget to boost and comment! It’s a big deal, motivates me to share even more winning insights with you. Tremendous insights.
I keep my charts the best, clean, simple, and clear. You know it, I know it, clarity leads to better decisions. No question about it. My approach? Built on years of tremendous experience. Incredible track record. I don’t claim to know it all, but I spot high-probability setups like nobody else. Trust me.
Want to learn how to use the heatmap, cumulative volume delta, and volume footprint techniques I use to determine demand regions with stunning accuracy? Send me a private message—totally free, folks. That’s right. I help anyone who wants it, absolutely no charge. Unbelievable value.
Here’s the list, long list, great list, of some of my previous incredible analyses. Each one, a winner:
🎯 ZENUSDT.P: Patience & Profitability | %230 Reaction from the Sniper Entry
🐶 DOGEUSDT.P: Next Move
🎨 RENDERUSDT.P: Opportunity of the Month
💎 ETHUSDT.P: Where to Retrace
🟢 BNBUSDT.P: Potential Surge
📊 BTC Dominance: Reaction Zone
🌊 WAVESUSDT.P: Demand Zone Potential
🟣 UNIUSDT.P: Long-Term Trade
🔵 XRPUSDT.P: Entry Zones
🔗 LINKUSDT.P: Follow The River
📈 BTCUSDT.P: Two Key Demand Zones
🟩 POLUSDT: Bullish Momentum
🌟 PENDLEUSDT.P: Where Opportunity Meets Precision
🔥 BTCUSDT.P: Liquidation of Highly Leveraged Longs
🌊 SOLUSDT.P: SOL's Dip - Your Opportunity
🐸 1000PEPEUSDT.P: Prime Bounce Zone Unlocked
🚀 ETHUSDT.P: Set to Explode - Don't Miss This Game Changer
🤖 IQUSDT: Smart Plan
⚡️ PONDUSDT: A Trade Not Taken Is Better Than a Losing One
💼 STMXUSDT: 2 Buying Areas
🐢 TURBOUSDT: Buy Zones and Buyer Presence
🌍 ICPUSDT.P: Massive Upside Potential | Check the Trade Update For Seeing Results
🟠 IDEXUSDT: Spot Buy Area | %26 Profit if You Trade with MSB
📌 USUALUSDT: Buyers Are Active + %70 Profit in Total
🌟 FORTHUSDT: Sniper Entry +%26 Reaction
🐳 QKCUSDT: Sniper Entry +%57 Reaction
📊 BTC.D: Retest of Key Area Highly Likely
And that’s just the start. The list goes on and on, folks. It’s a tremendous list, the best. I stopped adding because, frankly, it’s tiring. So many wins. People are amazed. You can check my profile and see for yourself, winning moves, all the time. Believe me, nobody does it better.

$HBAR Double breakout!!CRYPTOCAP:HBAR has officially broken out of the descending channel and completed a clean inverse head-and-shoulders pattern—one of technical analysis's most reliable bullish reversal signals!
Chart Pattern: Inverse Head & Shoulders
Trend Reversal Confirmed
🔹 Left Shoulder ✅
🔹 Head ✅
🔹 Right Shoulder ✅
🔹 Breakout + Retest Zone Holding Strong!
This bullish confirmation, paired with a reclaim above the 200-day EMA, sets the stage for a potential massive upside move, with the target pointing toward $0.40+.
Don’t ignore technicals — trade with clarity, not emotions.

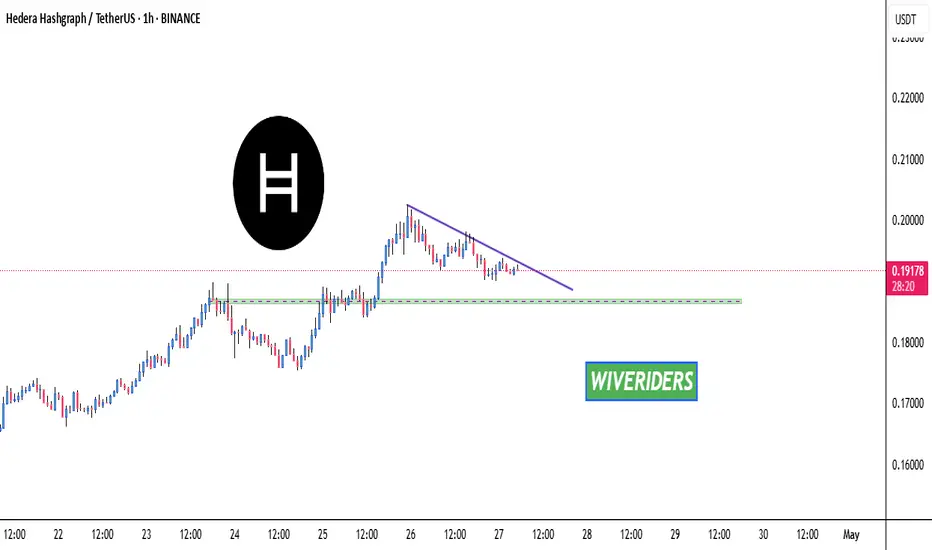
#HBAR/USDT#HBAR
The price is moving within a descending channel on the 1-hour frame, adhering well to it, and is heading for a strong breakout and retest.
We are seeing a bounce from the lower boundary of the descending channel, which is support at 0.1870.
We have a downtrend on the RSI indicator that is about to be broken and retested, supporting the upward trend.
We are looking for stability above the 100 Moving Average.
Entry price: 0.19000
First target: 0.1935
Second target: 0.1970
Third target: 0.2001

HBARUSDT – Bull Flag Breakout Confirmed!The recent price action on HBARUSDT is showing a classic bull flag breakout — a powerful continuation pattern often seen in strong uptrends.
Bull Flag Breakdown:
Flagpole:
Prior to consolidation, HBAR saw a massive rally of over 780%, forming a steep vertical move — this sets the stage as the flagpole.
Flag Formation:
Price entered a downward sloping channel with clear lower highs and lower lows. This consolidation formed the flag, which indicates temporary cooling before the next leg up.
Breakout & Retest:
HBAR broke out of the flag’s resistance, followed by a successful retest of the breakout zone and a bounce off the 0.5 Fibonacci level — all signs of strong technical confirmation.
With this breakout, HBAR is likely to follow through with a measured move, aiming for key targets:
TP1 (Futures): 0.24985
TP2 (Futures): 0.28904
TP1 (Spot): 0.57177
TP2 (Spot): 1.23275+
These targets align with historical resistance and projected flagpole extensions.
If you find this analysis helpful, please hit the like button to support my content! Share your thoughts in the comments, and feel free to request any specific chart analysis you’d like to see.
Happy Trading!!

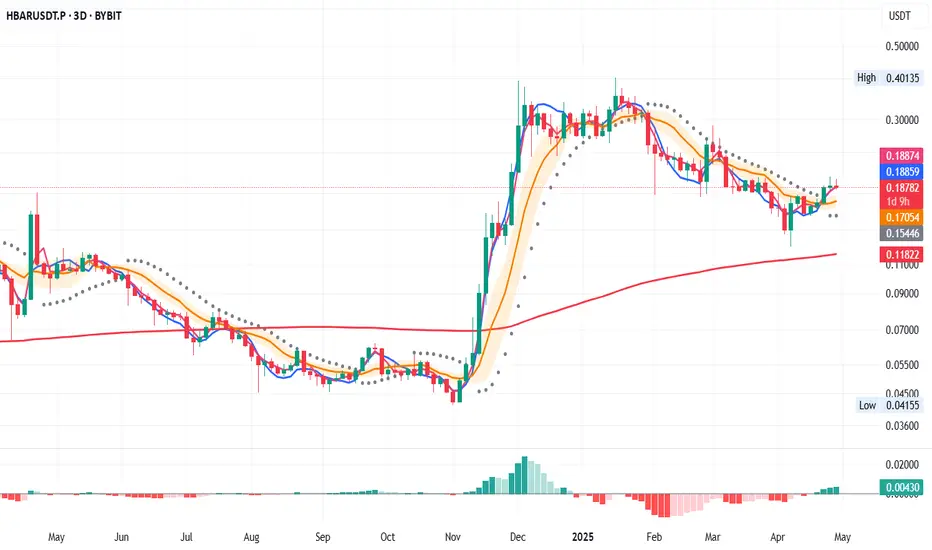
HBAR/USDT – 3D Long Signal Active📅 April 29, 2025
The system triggered a long entry at the last 3D bar close.
Currently, the price remains around the same levels.
✅ System conditions for a long are fully met:
MLR > SMA > BB Center > PSAR
Price is trading above the 200 MA on the 3D timeframe.
⚠️ Caution:
On the 1D timeframe, price is still below the 200 MA, which suggests some lingering weakness. Proceed carefully.
📍 Strategy Plan:
Consider entering long at today’s daily close or at the next 3D bar close.
Suggested stop-loss: below the latest PSAR dot for system integrity.
🔔 Keep an eye on updates and thank you for reading! 📈📊
HBAR Approaching Green Support Level 🚨 HBAR Approaching Green Support Level 🚨
HBAR is nearing a significant green support level. This area could provide a potential bounce and a good entry point for a long position. Wait for confirmation of support before entering the trade.
📈 Technical Overview:
Support Level: Green zone.
Potential Entry: Long position upon confirmation of support at the green zone.
HBAR is one of the most important cryptos to own long term.Hedera's technology is leaps and bounds ahead of nearly every other crypto in the space, both in terms of current capabilities and future potential. If you own crypto, you'd be crazy, in my opinion, not to hold HBAR.
Good luck, and always use a stop-loss!

HBAR/USDT HEAD AND SHOULDER PATTERN [BULLISH]Chart pattern HBAR/USDT showing head and shoulder pattern which mean bullish pattern. currently now on going for retest.

#HBAR Current Setup Showing Warning Signs | What's Next?Yello Paradisers! Is #HBAR teasing one last move up before everything collapses? Let’s break down what this suspicious structure on #Hedera is telling us:
💎#HBAR is currently trading at $0.183, sitting just beneath a heavy resistance zone around $0.190–$0.200. Price has been unfolding inside a clear Ending Diagonal structure—one of the most deceptive patterns in technical analysis. Wave 5 is still technically in play, but momentum indicators and volume behavior are telling a different story.
💎Volume has been steadily declining even as the price has been climbing, which is never a good sign this deep into a wedge pattern. On top of that, the RSI is pushing into overbought territory, showing that buyers are pushing the market higher, but with weakening strength behind them.
💎The resistance zone above current price is absolutely key. If #HBARUSD manages to break above the red zone and sustain momentum above $0.200, this would invalidate the current bearish setup and could open the door for an impulsive extension toward $0.220 and even higher. However, that scenario currently remains the less likely one unless we see a clear and strong breakout above the zone backed by volume.
💎Until then, bears are in control of the probabilities. The market structure favors a reversal from the Ending Diagonal, and if that plays out, the move could unfold quickly. First, we’ll be watching how price reacts at $0.142, which is the first major support and likely target if the wedge breaks down. A confirmed close below that level would likely lead to a continuation of the drop, with the next strong support zone near $0.125. This area has acted as a solid demand level previously and is also the region where the Volume Profile starts to spike again.
Play it safe, respect the structure, and let the market come to you!
MyCryptoParadise
iFeel the success🌴

HBAR Falling Wedge / Bull Pennant + RSI breakout (1D)BINANCE:HBARUSDT has spent months correcting after a strong rally and is now compressing within a falling wedge — which could also be interpreted as a bull pennant.
Two Potential Scenarios
• Falling Wedge – A classic reversal setup with bullish RSI divergence and declining volume. Measured target: ~$0.335.*
• Bull Pennant – A continuation pattern formed after the late-2024 impulse. Measured target: ~$0.525.*
Early Bullish Signs
• Declining volume as the pattern developed could signal waning seller strength.
• RSI breaking out of a multi-month downtrend, and retesting the resistance as support, can be a leading signal of a subsequent price breakout.
Key Levels
• $0.050 – Multi-year demand zone.
• $0.120 – Current support + HVN* + previous S/R + 0.786 Fib.
• $0.180 – Resistance + HVN + previous S/R + 0.618 Fib.
• $0.280 – HVN + prior swing high + likely resistance.
• $0.320–$0.460 – Monthly supply zone (in place since March 2021).
• $0.335 – Falling wedge measured target (depending on breakout timing)**.
• $0.360–$0.400 – Daily sell-side order block, expect resistance.
• $0.525 – Bull pennant target (depending on breakout timing)**.
* Wedge and pennant targets are measured from the breakout point, so the actual target will vary the longer we spend within the pattern.
** HVN: High Volume Node — zones of concentrated past trading activity, reinforcing S/R relevance.
⚠️ Until a clean breakout occurs, CRYPTOCAP:HBAR remains in a compression phase and a No-Trade Zone.
