🟢 HBARUSDT - 1D (06.10.2022)🟢 HBARUSDT
TF: 1D
Side: Long
SL: $0.054898
TP 1: $0.062470
TP 2: $0.066681
TP 3: $0.070084
TP 4: $0.073487
HBAR looks bottomed here and the only way is up. Buy and hold to end of the year.
Hbar

$HBAR - NARRATIVE PLAY Rapidly moving up - driven amongst other things by the planned CoinBase listing this month.
Nothing goes up forever however and I am looking for a potential reversal and covering of longs in the PRZ shown.
Will need some confirmatory metrics at the same time once in region but progressively looking like an interesting short.

HBAR S&R zones#HBAR/USDT
$HBAR hold above support zone and now is on a rally toward descending resistance line.
🐮 break out from descending resistance will increase price to touch resistance zone between $0.078 and $0.087.
🐻 rejection from descending resistance, will drop price toward support zone again.
#women_life_freedom

🎯 HBAR hit targets. What's next?Hello, dear TradingView members.
This is an HBAR idea.
We opened our positions on HBAR around the $0.055 area, which was a solid support level and a great buy/long opportunity.
So far, we have made about 10% (100% with a 10x leverage) profit, and it's safer and more logical to close all positions now. Do not FOMO.
As you can see on the chart, this coin has reached 2 levels of resistance on the hourly and daily timeframes based on the Fibonacci retracement.
There is a support level on the way down, which will let us open more long positions when we get more confirmation. But for now, we should wait and see.
RSI is overbought, and the price has more room to go down.
Now let's see your ideas. Let's have a discussion.
Let me know if you guys have any questions;
I will be more than happy to help.

uni / busd 1d binance short term bearish, BINANCE:UNIBUSD
rising channel on the 4 hr time frame, short term down side 68% chance of further slippage, tight stop losses always as uni can move fast in either direction, usually a precursor to bitcoin, Long term bullish when it breaks out this long term falling wedge for some big gains. could be couple weeks away judging by the charts.

HBAR | Bow Down For HederaGreat chart. We should be able to get back to our old levels at 30 cents to keep up our trend line.

Hedera HBAR Bear Market RallyFriday the S&P hit a new 52 week low, being oversold right now.
I expect a bounce in the stock market next week, which will determine a bear market rally in the crypto space too!
Hedera HBAR is one of the cryptocurrencies that have a lot of potential for a bull run.
HBAR/USDT
Entry Range: $0.052 0.059
Price Target 1: $0.065
Price Target 2: $0.073
Price Target 3: $0.082
Stop Loss: $0.045

HBAR | One Day From BreakoutNeed one day of sideways and we explode, maybe tomorrow we open on the right of the resistance line.
Remember we pumped to 50 cents

Bitcoin I see you hovering at resistanceIt won't be interesting if you just quickly liquidate the buyers then explode. We are the ones running the market. Must bounce big back biggg to keep up with that 50 degrees trend line. I heard HBAR to take over crypto and ROSE is top dog along with many other recommended coins.

HBAR / BTC in a Parallel Uptrend?Quick chart here. Is HBAR / BTC in a parallel uptrend? We still need 3 touches at top and bottom to confirm this. If this is correct, we're at the bottom of the trend now and should see another trip to the top.
Should we do that and stop at the top, expect to see a third trip to the bottom as well. MACD and RSI are also pointing to a reversal here, as confluence.
An alternative possibility, if we hold channel bottom and then break channel top, this could turn into a giant inverted head/shoulders and become much more bullish sooner.
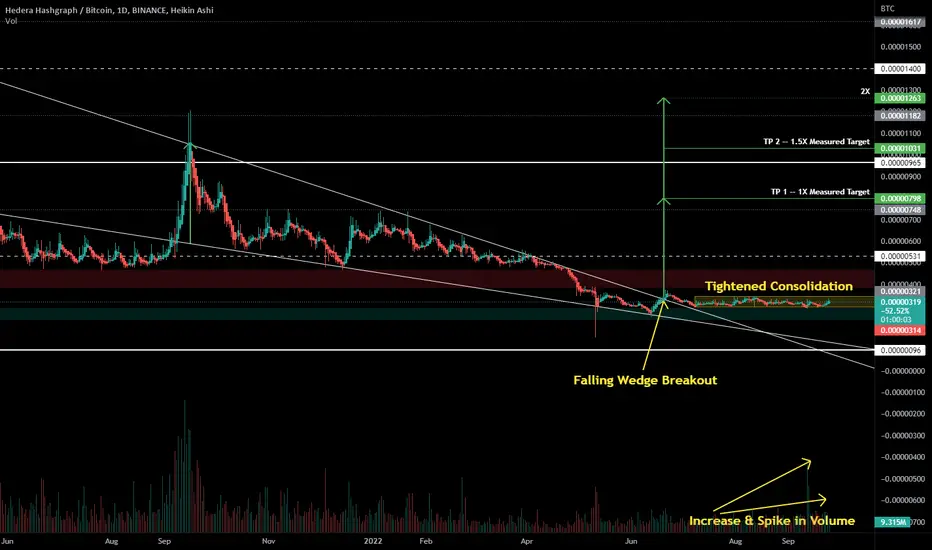
Signs of an Impending Move for Hedera vs. BitcoinAround June 19th, we broke out of a daily falling wedge (shown above), and again around end of July we broke out of a weekly falling wedge (not shown). Since then Hedera has started a pattern of consolidation within a very tight range, just above support, and below resistance. Measured wedge targets take us right at previous ATH (candle close), and a more liberal 2X target takes us above our all-time highest wick.
Each of these provide confluence that Hedera is gearing up for a move.
So, look for us to break out of the small range that we've been in for the last several weeks.
And, even if that becomes a break below the consolidation range before it breaks above, it could still act as a fulcrum for pivoting to a significant move up.
What we don't want to see is a loss of support (green box) that holds.
HBAR to Make Major Moves vs. ETHBroke out of two falling wedges. Measured targets for the smaller wedge line up closely with the first measured target for the larger wedge. Fib levels also show confluence with these levels.
HBAR charts vs. USD and BTC pairs are linked below under Links to Related Ideas

HBar under $0.18 is a bargainHBar is likely to move up to test higher price levels soon, we have a high likelihood of testing the 0.236 during during indicated zones.

Hedera HBAR updateIF HBAR makes contact with the 0.236 fib retracement zone at $0.18 during 2022 we could see price for HBAR soar above $0.30 by mid 2023

HBAR is going down?One of our readers asked us to do an HBAR analysis. Technically, I don’t see any signs of strength and I’m waiting for the lows to be broken out in the near future, we have a preload to a level that I think will be broken and we will wait for HBAR around $0.04 because we don’t even see any significant volumes and buyer reaction in the current zone, so maybe it just appear below 📉
HBAR L1 narrative is probably dead. ETH has upgraded. The future is in Ethereum now. All problems Ethereum has before have been eliminated. No need to develop on unsecure chain like this when Ethereum is good now.

HBARNot financial advice. The essence of investing & trading is the intelligent and patient preying on the greed, fear, impatience, addiction and ignorance of the majority. It's definitionally Darwinian.

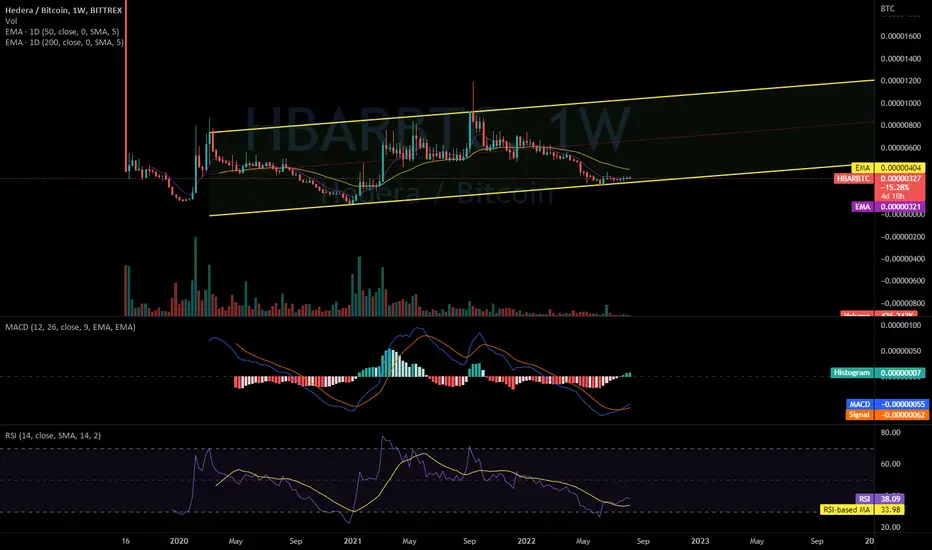
HBAR Ready to Rise for the 3rd TimeHBAR broke out of a falling wedge on its weekly chart a couple of months ago. It has since held above weekly support, and well above the wedge. If there is another dip prior to continuation, I could see it test the top of the wedge, near the bottom of support. However, if we lose support and close below the top of the wedge, this idea becomes invalidated.
Measured targets / fib levels:
-- TP 1 - 599-605 sats
-- TP 2 - 734-744 sats
Some confluence to support this idea:
-- Chart VWAP, with the full chart in view, wants average price to be near the top of the resistance area shown.
-- Zooming in to view the falling wedge moves the chart VWAP to line up with TP 1 as well (see chart snapshot below).
-- TP 1 lines up closely with our 0.618 fib (within 6 sats), where fibs are based on the previous move from trough to peak.
-- TP 2 also lines up closely with our 0.786 fib (within 10 sats)
-- RSI has bottomed out, slightly higher than our previous bottom, and it shows similar movement to the last two moves from bottom, theorizing that each in a series of 3 (assuming we've begun our 3rd move) has a consolidation period that begins closer to its initial impulse, and consolidates for a longer period each time.
-- Stoch RSI has also bottomed out and then reached top, also showing similar movement, and also theorizing that each in a series of 3 (again, assuming our 3rd move has begun) has a longer consolidation period between peak 1 and 2.
Zoomed in view of falling wedge and Chart VWAP lining up with TP 1:
Thanks for hearing my thoughts, please leave your own in the comments below. If this move does play out, I think it'll become highly likely that we see a new ATH before seeing any long-term bearish movement again. There is a linked idea for the HBAR/USD pair below under Link to Related Ideas, or here:
-dudebruh

HBAR is Ready For LONG PositionHBAR / USDT is Going to get a good setup for LONG POSITION
you can get this position with LEV10 X
Good Luck & dont forget to set SL & TP

HBAR great time to get in! Opinion:
Short term trade. TP at 0.08670! :)
Each level L1-L3 (S1-S3) and TP1-TP3 has a deployment percentage. The idea is to flag these levels so I can buy 11% at L1 , 28% at L2 and if L3 deploy 61% of assigned dry powder. The same in reverse goes for TP. TP1: 61%, TP2:28% and TP3:11%. If chart pivots between TP's and L's these percentages are still respected. I like to use the trading range to accumulate by using this tactic.
Just my personal way of using this. This is not intended or made to constitute any financial advice.
This is not intended or made to constitute any financial advice.
FED Macro Situation Consideration:
All TP's are drawn within the context of a return to FED neutral policy. I do not expect these levels to be reached before tightening is over.
NOT INVESTMENT ADVICE
I am not a financial advisor.
The Content in this TradingView Idea is for informational purposes only, you should not construe any such information or other material as legal, tax, investment, financial, or other advice. Nothing contained within this idea constitutes a solicitation, recommendation, endorsement, or offer to buy or sell any securities or other financial instruments in this or in in any other jurisdiction in which such solicitation or offer would be unlawful under the securities laws of such jurisdiction.
All Content on this idea post is information of a general nature and does not address the circumstances of any particular individual or entity. Nothing in the idea/post constitutes professional and/or financial advice, nor does any information on the idea/post constitute a comprehensive or complete statement of the matters discussed or the law relating thereto. You alone assume the sole responsibility of evaluating the merits and risks associated with the use of any information or other Content on the idea/post before making any decisions based on such information.


$HBAR Log chart Elliott Wave Analysis. Floki here with the first of many Elliott Wave Analysis crypto updates.
Starting with HBAR, a coin very close to my heart, which I will qualify as Blue Chip going forward. The RL use cases it brings to the table are undeniable.
But on the technical side, is the correction done? I'd say the odds of it being done are at about 70%. There is still room (30% chance) to go lower with a final 5th wave of Ⓒ. That would make this whole move up and down a Macro i & ii. And we all know what comes next right ? The infamous wave iii on macro scale.
My bias was way off in my last analysis on January. But the market has shown us its hand as of now.
Trade safe y'all.

HBAR/USDT - Elliot Wave Count Elliot Wave Count for HBAR - could be a nice trade , short from 3-4 with a bit of leverage then long the 5,

HBAR - Top Is In AugustThe TOP will likely be in August.
For now, the levels I've identified as possible reversals are 0.089 and 0.109.
Good luck
